LB Thesis NewSNR Corrections
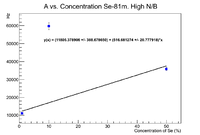
First plot the efficiency corrected activity as a function of concentration. These points are not weighted by mass, but they are fully corrected as per the thesis otherwise. These values are the activity at the highest value of N/B
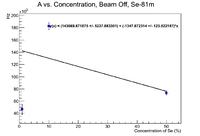
This plot doesn't look very good as the 50% sample has a lower activity than the 10% sample. Try plotting this at the time of beam off. Note these are done using fits with the accepted half life vs. the experimental half life. The error bars represent |(Free Fit A) - (Fixed Fit A)|
Perhaps the difference comes from the fact that the irradiation times were different, but to normalize to a standard beam time, a reference material must be used. Segebade says "Since, as already mentioned, yield values are normalized for a common exposure period of one hour, the following expression is required, which converts the individual activities yielded using other irradiation times to those after standard exposure period T (1h):
Where is the actual exposure period and T is the normalized exposure period of 1 hour"
So lets try to correct these ratios using Nickel
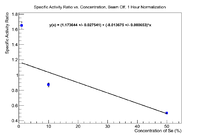
For correcting the 50%, we have (note these are the fixed fit values)
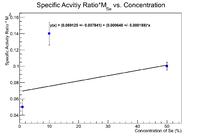
This ratio is lower than its original value (0.62), which makes sense because the nickel would not die off as much in the beam. The 10% and 1% values should not need this correction as they were irradiated for an hour, so the correction goes to unity. Plot the ratio of the specific activity as a function of concentration.
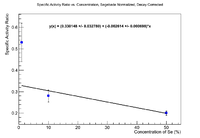
If I apply Dr. Forest's suggested decay correction as were applied to the ratios before (multiply by , I get
This still doesn't make physical sense. Try multiplying by the mass of the sample to see a change.
This would be the plot Dr. Dale wanted if I used Nickel foils for normalization. It doesn't seem to be physical. As far as I can tell, since we are back to using ratios of activities, the same problems will be encountered that the past year were dedicated to trying to fix, but never were. The largest contributor being a non constant flux across the face of the sample. Perhaps if there were something internal to the soil (Mn-54 search failed), the normalization would be better. Unfortunately I have a feeling the same problems will be encountered (at least in the 0.1% sample because the soil completely filled the Al cylinder, while the Se Pellets had a very small comparative volume.
Se-75 has a different problem, most notably the 50% and 10% samples were reirradiated using different (in mass and volume) Nickel foils. I feel the only solution is to find something internal to the soil to correct to.
Potassium Search
Each of the following histograms are weighted by the mass of the soil. K-44 has a half life of 22 minutes and a high branching ratio energy line of 1157 keV.
