Se170063 Thin Window Analysis
In order to try to pin down the ratio of pure selenium to the selenium in the soil, try using a 2 channel window to find the signal. The error in the signal will be found by standard error propagation in mathematica. Since the max value is fixed, it does not appear in the stats box, but I have included it in the table.
Below is the table for the Se-Ash Mixture
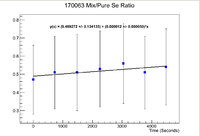
Below is a plot of the ratio of the activities where the pure selenium sample has been time corrected back to match the run time of the mixture.
Note that this does give the expected result that the ratio between the two samples is statistically the same as 0.5, which is the ratio of the masses. The only problem here is that the error is quite large, The average of the uncertainty divided by the mean is 39.6%.
Below are the half life plots for the Pure Selenium sample and the ash mixture


