Niowave 10-2015
Initial rate study
2mm thick PbBi, 10 MeV, 1 cm cylindrical incident electron distribution
G4beamline pencil beam 10 cm radius
beam ellipse particle=e- nEvents=1000000 beamZ=0.0 beamX=0. beamY=0. \
        sigmaX=10.0 sigmaY=10.0 sigmaXp=0.000 sigmaYp=0.000 \
      meanMomentum=10. sigmaE=0. maxR=10.
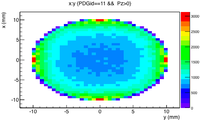
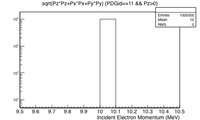
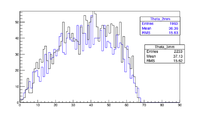
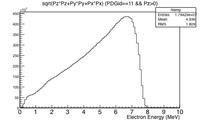
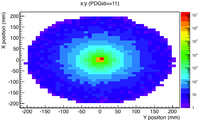
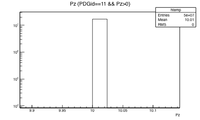
Incident Electron spatial distribution and energy
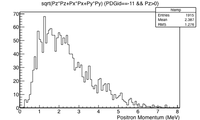
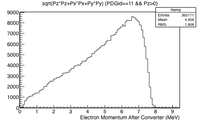
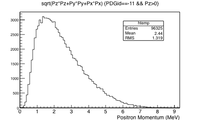
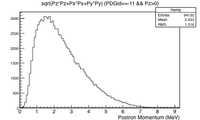
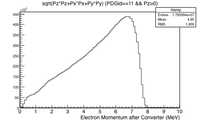
Positron and Electron Momentum after the converter
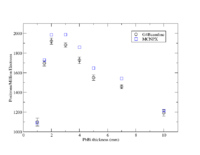
| PbBi Thickness (mm) | #positrons/million electrons (G4Beamline) | #positrons/million electrons (MCNPX) |
| 1 | 1169,1083,1068,1090,1088 =1100 40 | 1091 |
| 1.5 | 1723, 1668,1671, 1687,1726=1695 28 | 1728 |
| 2 | 1902,1921,1886,1967,1922=1920 30 | 1984 |
| 3 | 1920,1880,1883,1864,1857=1881 24 | 1986 |
| 4 | 1688, 1766, 1712, 1709, 1753=1726 33 | 1858 |
| 5 | 1569,1585,1509 ,1536,1551=1550 29 | 1646 |
| 7 | 1475,1450,1457,1428,1477 =1457 20 | 1541 |
| 10 | 1250,1180,1178,1186,1166=1192 33 | 1216 |
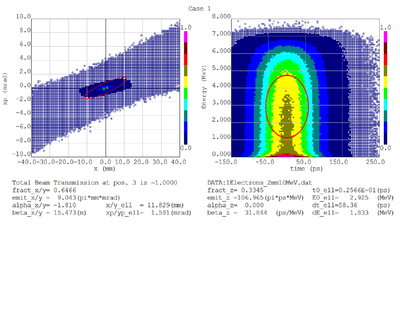
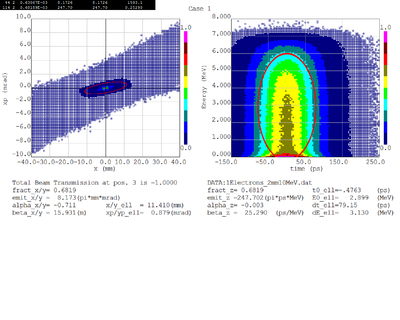
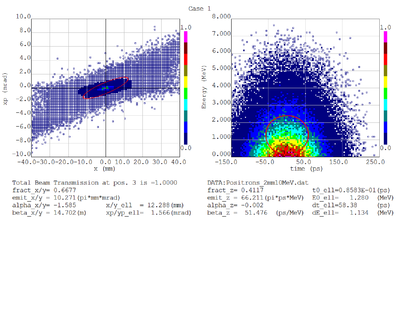
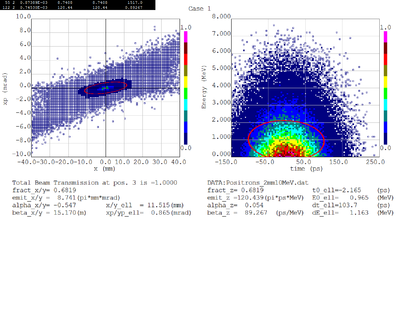
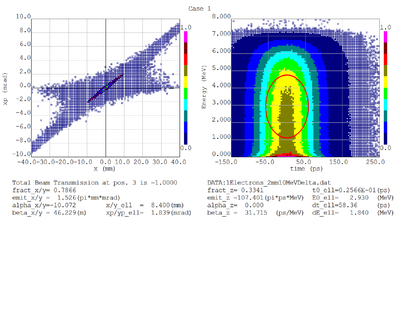
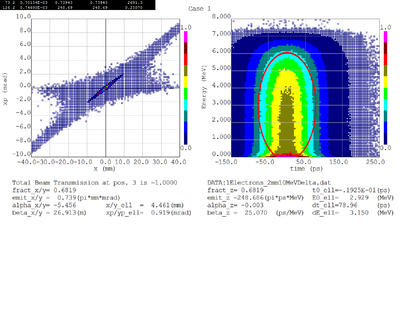
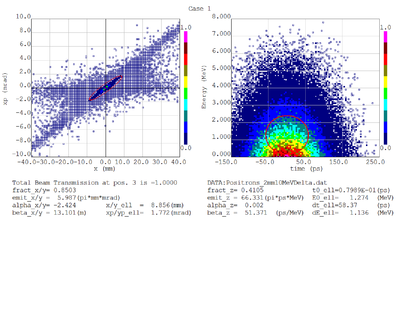
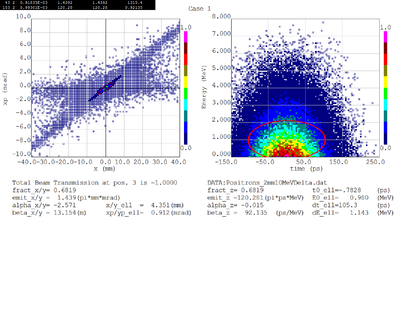
Dmitry's processing of Tony's GEANT simulations showing transverse phase space portrait (left) and longitudinal phase space portrait (right). Phase space portraits show coordinate x or y vs diveregense=px/pz or py/pz (or time vs kinetic energy ). Captions show:
1. geometric (not normalized) emittance for transverse and emittance for longitudinal phase space portraits (ellipse areas divided by "pi")
2. Twiss parameters
3. Ellipse centroid for longitudinal phase portrait
4. sqrt(beta*emittance) and sqrt(gamma*emittance) - half sizes of the projections of the ellipses on the coordinate and divergence axes respectively.
Electrons - RMS
Electrons - 68.2% core
Positrons - RMS
Positrons - 68.2% core
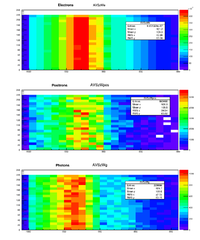
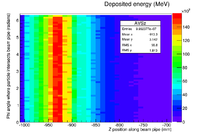
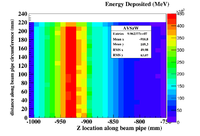
The plot below shows the energy deposited in MeV along the pipe. The Z axis is along the beam direction. The distance around the beam pipe is determine by taking the pipe radius (34.8 mm) and multiplying it by the Phi angle around the pipe. The bins are 1cm x 1cm.
 |
|
Below is energy deposited contributions from from photons(AVSzWg), positrons (AVSzWpos), and electrons.
Why is the positron hotspot upstream of the target? Because beam was going from right to left.
root commands used
TH2D *AVSz=new TH2D("AVSz","AVSz",100,-1000,0,12,-60,60)
BeamPipeE->Draw("35.*atan(PosYmm/PosXmm):PosZmm>>AVSz","DepEmeV");
AVSz->Draw("colz");
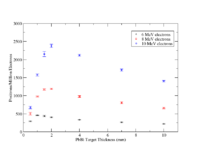
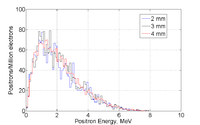
Rate comparison with Energy and target thickness
- Difference with above simulation are that GEANT4 has SS windows and all created positrons that leave the target are counted , not just those going through a Sensitive detector downstream
6MeV
| PbBi Thickness (mm) | #positrons/million electrons (GEANT4.9.6.p02 | #positrons/million electrons (G4Beamline) |
| 0.5 | 284,306,281,290,288 = 29010 | |
| 1 | 465,449,457,454,472 = 4599 | |
| 1.5 | 456,416,445,445,434 =43915 | |
| 2 | 396,418,394,415,395 =40412 | |
| 4 | 338,327,332,341,336=3355 | |
| 7 | 257,280,265,268,259 =2669 | |
| 10 | 223,225,234,210,221 =223 9 |
8 MeV
| PbBi Thickness (mm) | #positrons/million electrons (GEANT4.9.6.p02 | #positrons/million electrons (G4Beamline) |
| 0.5 | 458,458,535,533,516=500 39 | |
| 1 | 994,996,967,971,956=97718 | |
| 1.5 | 1166,1196,1139,1176,1178=1171 21 | |
| 2 | 1184,1212,1175,1194,1178=1189 15 | |
| 4 | 989,1013,975,962,956= 97923 | |
| 7 | 815,765,829,806,817=806 25 | |
| 10 | 641,660,636,671,682 = 65820 |
10 MeV
| PbBi Thickness (mm) | #positrons/million electrons (GEANT4.9.6.p02 | #positrons/million electrons (G4Beamline) |
| 0.5 | 628,653,713,686,689 = 67433 | |
| 1 | 1524,1607,1565,1598,1581 = 1575 33 | |
| 1.5 | 2163,2264,2091,2154,2094= 2153 70 | |
| 2 | 2445,2386,2321,2359,2368 = 2376 45 | |
| 4 | 2087,2104,2121,2154,2118 = 2117 25 | |
| 7 | 1675,1697,1708,1720,1750=1710 28 | |
| 10 | 1398,1421,1374,1418,1398 = 1402 19 |
Use Gaussian to make a incident uniform beam that is 1 cm in diameter and has a beam sigma of 1 cm , then cut out the beam to have a 0.5 cm circular radius.
First simple test is to send 1 million, 10 MeV electrons towards a PbBi target and count how many positrons leave the downstream side
The Random number seed is set by Time in G4beamline to use a different set of pseudo random numbers each time it is run
The G4Beamlin incident electron beam has the following properties
beam gaussian particle=e- nEvents=1000000 beamZ=0.0
        sigmaX=1.0 sigmaY=1.0 sigmaXp=0.100 sigmaYp=0.100
        meanMomentum=10.0 sigmaP=4.0 meanT=0.0 sigmaT=0.0
| PbBi Thickness (mm) | #positrons/million electrons (G4Beamline) | #positrons/million electrons (MCNPX) |
| 1 | 960,874, 916,934,897=916 +/- 33 | 1091 |
| 1.5 | 1508 | 1728 |
| 2 | 1963,1919,1880,1877,1970 = 1902 43 | 1984 |
| 2.5 | 1997 | 2062 |
| 3 | 2233,2250, 2251,2226 , 2222=2236 13 | 1986 |
| 3.5 | 2193 | 1938 |
| 4 | 2184,2156,2089,2173,2181=2157 39 | 1858 |
| 5 | 2042 | 1646 |
| 6 | 1851, 1932, 1857, 1896,1924 = 1892 37 | 1541 |
| 10 | 1480,1488 | 1216 |
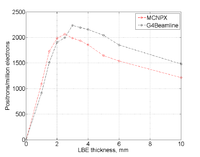
Comparison of G4Beamline and MCNPX
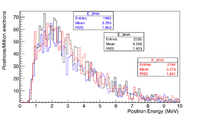
Energy Distribution
Angular distribution of positrons
I was unable to do anything other than a gaussian beam right now, I will try to do one later
For now I have a gaussian with an 8mm RMS and 10 MeV incident electrons as shown below.
The positron and electron momentum distributions after the PbBi converter are shown below
A comma delimited text file with the above events in the format of
x,y,z,Px,Py,Pz
in units of cm for distance and MeV for momentum is located at
for positrons
http://www2.cose.isu.edu/~foretony/Positrons_2mm10MeV.dat
and
http://www2.cose.isu.edu/~foretony/Electrons_2mm10MeV.dat
for electrons
For now I have a gaussian with an 1mm RMS and 10 MeV incident electrons as shown below.
The positron and electron momentum distributions after the PbBi converter are shown below
A comma delimited text file with the above events in the format of
x,y,z,Px,Py,Pz
in units of cm for distance and MeV for momentum is located at
for positrons
http://www2.cose.isu.edu/~foretony/Positrons_2mm10MeVDelta.dat
and
http://www2.cose.isu.edu/~foretony/Electrons_2mm10MeVDelta.dat
for electrons
Dmitry's processing of Tony's GEANT simulations showing transverse phase space portrait (left) and longitudinal phase space portrait (right). Phase space portraits show coordinate x or y vs
diveregense=px/pz or py/pz (or time vs kinetic energy ). Captions show:
1. geometric (not normalized) emittance for transverse and emittance for longitudinal phase space portraits (ellipse areas divided by "pi")
2. Twiss parameters
3. Ellipse centroid for longitudinal phase portrait
4. sqrt(beta*emittance) and sqrt(gamma*emittance) - half sizes of the projections of the ellipses on the coordinate and divergence axes respectively.
Electrons - RMS
Electrons - 68.2% core
Positrons - RMS
Positrons - 68.2% core
