Difference between revisions of "A W thesis old"
Jump to navigation
Jump to search
| Line 94: | Line 94: | ||
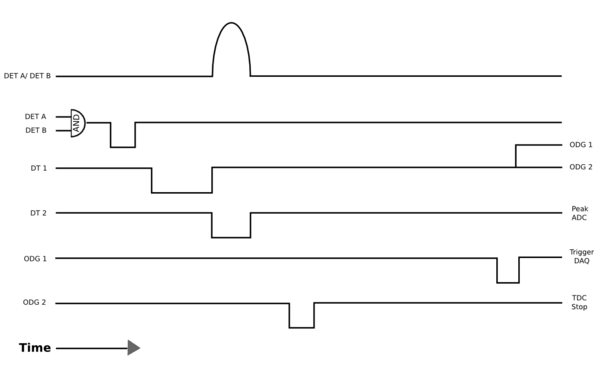
[[File:Signal_Diagram.png | 600 px]] | [[File:Signal_Diagram.png | 600 px]] | ||
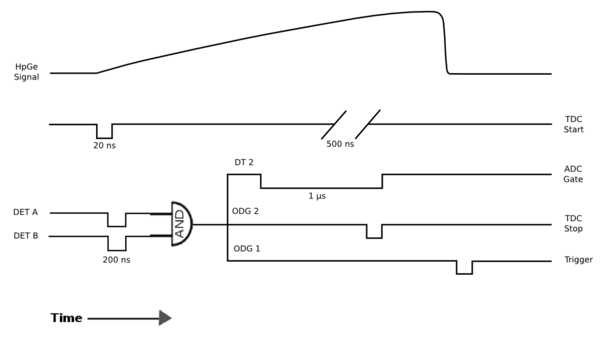
[[File:Signal_Diagram_2.png | 600 px]] | [[File:Signal_Diagram_2.png | 600 px]] | ||
| + | |||
| + | |||
| + | <math>\sigma_Fit</math> | ||
| + | |||
| + | {| border="1" |cellpadding="20" cellspacing="0 | ||
| + | |- | ||
| + | | <math>T_{1/2}</math> || Trig || colspan="5" | Fit Parameters || Signal Area || Noise Area || SNR | ||
| + | |- | ||
| + | | rowspan="2" | 0.98 || sing || <math>\mu=</math> 897.260 +/- 0.0047|| <math>\sigma=</math> 0.7074 +/- 0.0280|| A=0.725 +/- 0.0129 || B= 8.448e-4+/- 4.457e-5 || C=-0.7355 +/- 0.0408|| 0.9938 +/- 0.0054 || 0.3039 +/- 0.0380 || 3.270 +/- 0.0243 | ||
| + | |- | ||
| + | | coin || <math>\mu=</math> +/- || <math>\sigma=</math> +/- || A= +/- || B= +/- || C= +/- || +/- || +/- || +/- | ||
| + | |- | ||
| + | | rowspan="2" | 2.27 || sing || <math>\mu=</math> 903.482 +/- 0.0064 || <math>\sigma=</math> 0.6595 +/- 0.0877 || A= 0.3199 +/- 0.0156 ||B= -7.248e-4+/- 9.968e-7 ||C= 6.816e-1 +/- 8.138e-4 ||0.5146 +/- 0.0073||0.0852 +/- 0.0107|| 6.037 +/- 0.0082 | ||
| + | |- | ||
| + | | coin || <math>\mu=</math> +/- || <math>\sigma=</math> +/- || A= +/- || B= +/- || C= +/- || +/- || +/- || +/- | ||
| + | |- | ||
| + | |} | ||
[[A_W_thesis]] | [[A_W_thesis]] | ||
Revision as of 15:35, 22 August 2014
898 keV Signal and Background Noise Table
| Run # | Area of Signal | Area of Background | Signal to Noise Ratio |
| 7203 | 130.17 | 120.59 | 1.08 |
| 7204 | 825.34 | 558.66 | 1.48 |
| 7235 | 194.38 | 60.23 | 3.23 |
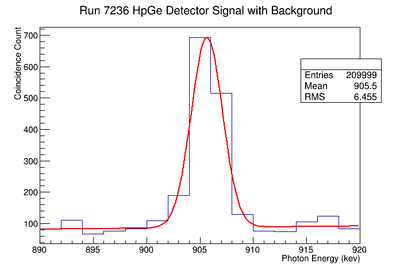
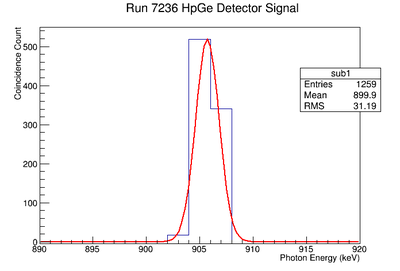
| 7236 | 1429.75 | 436.93 | 3.27 |
1836.1 keV Signal and Background Noise Table
| Run # | Area of Signal | Area of Background | Signal to Noise Ratio |
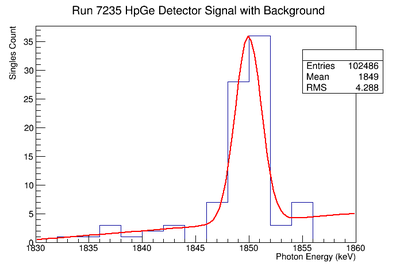
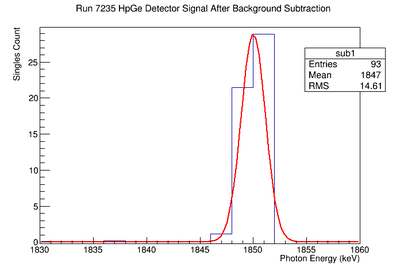
| 7203 | 83.29 | 24.73 | 3.37 |
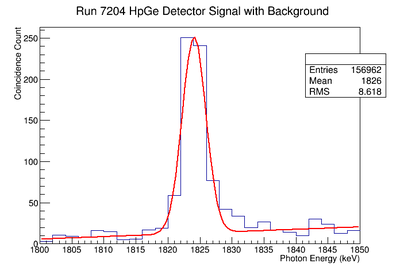
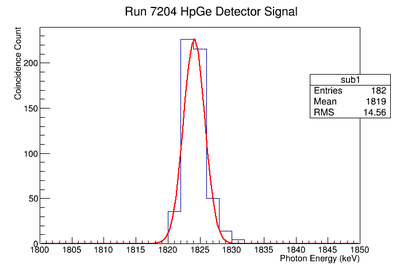
| 7204 | 944.58 | 101.68 | 9.29 |
| 7235 | 82.25 | 20.90 | 3.94 |
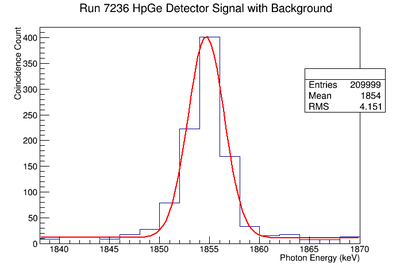
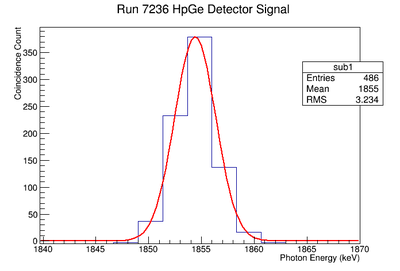
| 7236 | 1849.86 | 97.64 | 18.95 |
Efficiency on 2/28/2014
| Run | Source | Energy | Expected rate (Hz) | HpGe Det B Rate (ADC 7) (Hz) | HpGe Eff (%) |
| 7028 | Ba-133 | 80.9971 | 1067.468 +/- 1.131 | 14.483 +/- 1.442 | 1.357 |
| 7028 | Ba-133 | 276.3997 | 221.297 +/- 0.2345 | 4.239 +/- 0.9671 | 1.916 |
| 7028 | Ba-133 | 302.8510 | 574.310 +/- 0.6085 | 9.523 +/- 0.5539 | 1.658 |
| 7028 | Ba-133 | 356.0134 | 1941.418 +/- 2.057 | 27.130 +/- 1.316 | 1.397 |
| 7028 | Ba-133 | 383.8480 | 278.416 +/- 0.2950 | 3.982 +/- 0.2440 | 1.430 |
| 7027 | Na-22 | 511 | 1589.218 +/- 1.842 | 17.545 +/- 0.4560 | 1.104 |
| 7025 | Cs-137 | 661.657 | 2548.022 +/- 2.222 | 25.622+/- 0.3286 | 1.006 |
| 7029 | Mn-54 | 834.848 | 4032.782 +/- 0.0114 | 0.2911 +/- 0.1667 | 0.0072 |
| 7026 | Co-60 | 1173.228 | 1876.619 +/- 0.2687 | 11.062 +/- 0.1215 | 0.589 |
| 7027 | Na-22 | 1274.537 | 888.264 +/- 1.029 | 4.685 +/- 0.0825 | 0.527 |
| 7026 | Co-60 | 1332.492 | 1878.167 +/- 0.2690 | 9.616 +/- 0.1181 | 0.512 |
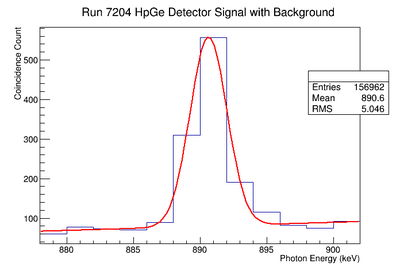
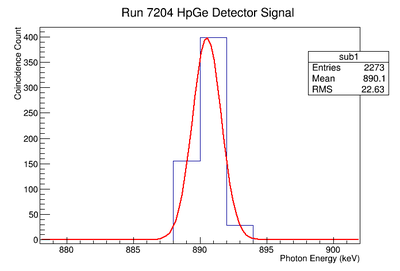
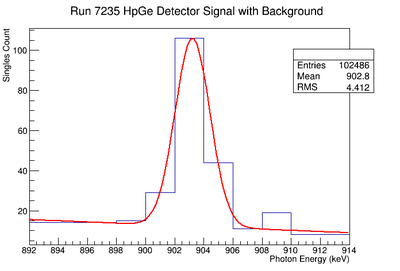
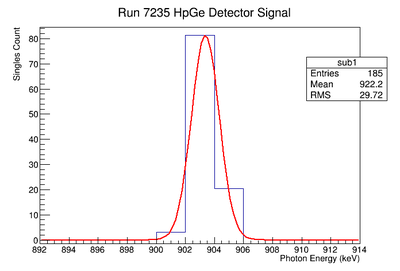
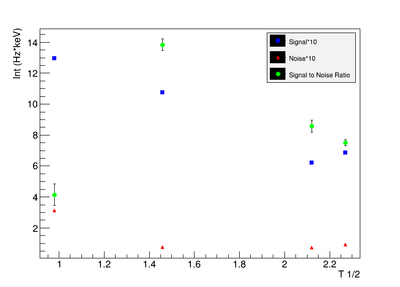
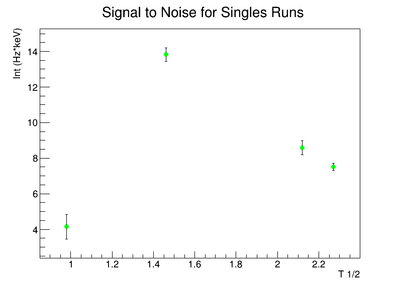
Signal, Noise, and Signal to Noise Ratio plots for 898 keV singles runs.
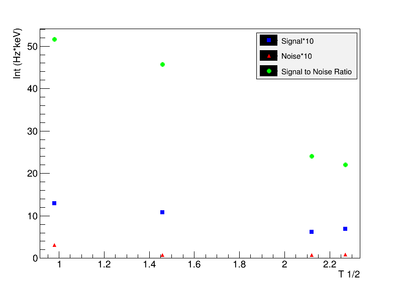
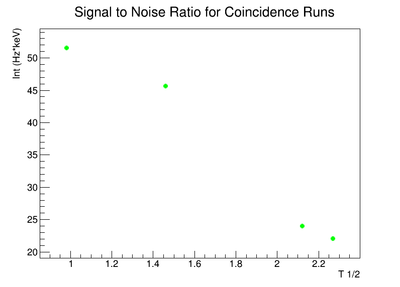
Signal, Noise, and Signal to Noise Ratio plots for 898 keV coincidence runs.
| Trig | Fit Parameters | Signal Area | Noise Area | SNR | |||||
| 0.98 | sing | 897.260 +/- 0.0047 | 0.7074 +/- 0.0280 | A=0.725 +/- 0.0129 | B= 8.448e-4+/- 4.457e-5 | C=-0.7355 +/- 0.0408 | 0.9938 +/- 0.0054 | 0.3039 +/- 0.0380 | 3.270 +/- 0.0243 |
| coin | +/- | +/- | A= +/- | B= +/- | C= +/- | +/- | +/- | +/- | |
| 2.27 | sing | 903.482 +/- 0.0064 | 0.6595 +/- 0.0877 | A= 0.3199 +/- 0.0156 | B= -7.248e-4+/- 9.968e-7 | C= 6.816e-1 +/- 8.138e-4 | 0.5146 +/- 0.0073 | 0.0852 +/- 0.0107 | 6.037 +/- 0.0082 |
| coin | +/- | +/- | A= +/- | B= +/- | C= +/- | +/- | +/- | +/- | |
