Difference between revisions of "2n opening angle"
| Line 4: | Line 4: | ||
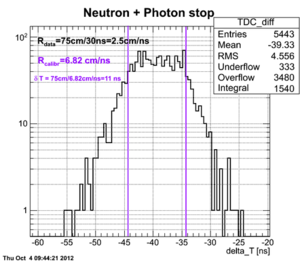
[[File:Cuts_explanation.png | 300 px]] | [[File:Cuts_explanation.png | 300 px]] | ||
| − | ===Experimental data with coordinate cuts applied | + | ===Experimental data with coordinate cuts applied=== |
Coordinate cuts were applied but the length of the active area was fixed to 75 cm (the actual length of the active area of the neutron detector) | Coordinate cuts were applied but the length of the active area was fixed to 75 cm (the actual length of the active area of the neutron detector) | ||
| Line 14: | Line 14: | ||
At this stage there is no efficiency normalization involved in the calculation. The main goal is to show that we've got 258 neutrons in all the runs. | At this stage there is no efficiency normalization involved in the calculation. The main goal is to show that we've got 258 neutrons in all the runs. | ||
| − | ===Experimental data without coordinate cuts applied=== | + | ===Experimental data without coordinate cuts applied I=== |
Coordinate cuts were NOT applied but the length of the active area was fixed to 75 cm (the actual length of the active area of the neutron detector) | Coordinate cuts were NOT applied but the length of the active area was fixed to 75 cm (the actual length of the active area of the neutron detector) | ||
[[File:Total_data_ana_NOcut.png | 900 px]] | [[File:Total_data_ana_NOcut.png | 900 px]] | ||
| + | |||
| + | ===Experimental data without coordinate cuts applied I=== | ||
| + | |||
| + | [[File:Total_data_ana_NOcut_calibr.png | 900 px]] | ||
==Simulation== | ==Simulation== | ||
Revision as of 22:03, 14 March 2013
Experimental data
2n opening angle spectra obtained after the processing of all the runs with thick uranium target are shown below for the tow cases (a) with coordinate cuts implied by the calibration with independent Co-60 source and (b) without the cuts applied and self calibration used:
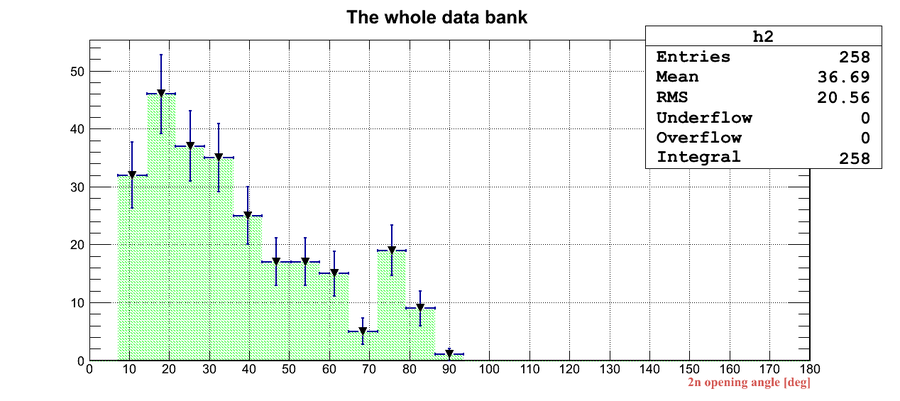
Experimental data with coordinate cuts applied
Coordinate cuts were applied but the length of the active area was fixed to 75 cm (the actual length of the active area of the neutron detector)
The bin width (x-error) is 7.2 degrees, the total number of bins is 25. Statistical error (y-error) is presented for each bin.
At this stage there is no efficiency normalization involved in the calculation. The main goal is to show that we've got 258 neutrons in all the runs.
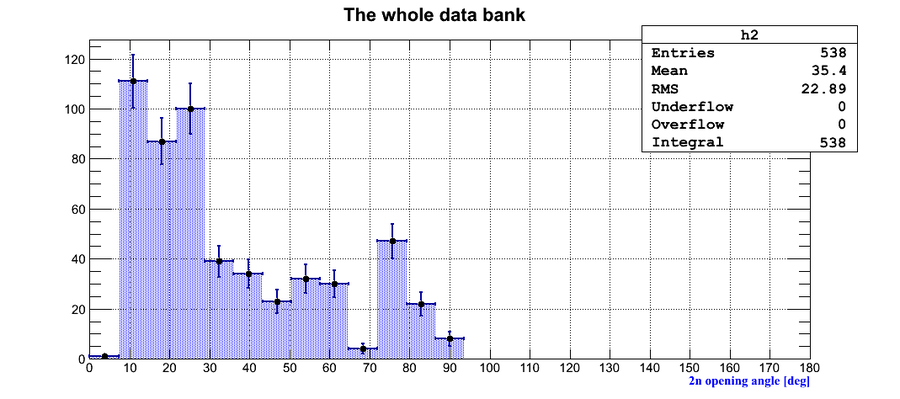
Experimental data without coordinate cuts applied I
Coordinate cuts were NOT applied but the length of the active area was fixed to 75 cm (the actual length of the active area of the neutron detector)
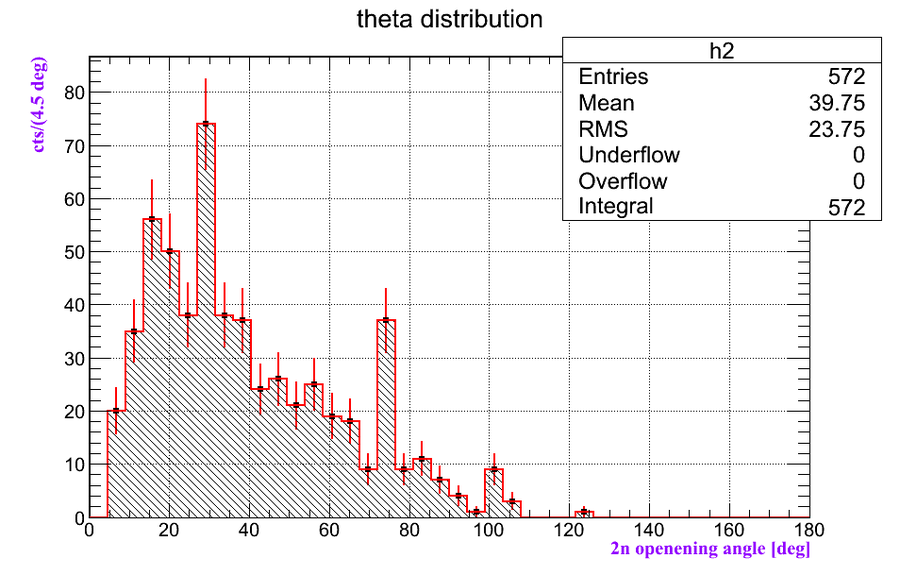
Experimental data without coordinate cuts applied I
Simulation
GEANT4 was used to sample two neutrons isotropically, to track them and opening angle was observed for two cases when (1) two neutrons hit the same detector (N(same)) and (2) two neutrons hit two different detectors (N(different)). After that the plot of N(different)/(N(same)+N(different)) was made.
The total number of neutron pairs sampled was , emission of neutrons was in form isotropic point source. Geometry of the experiment was preserved.
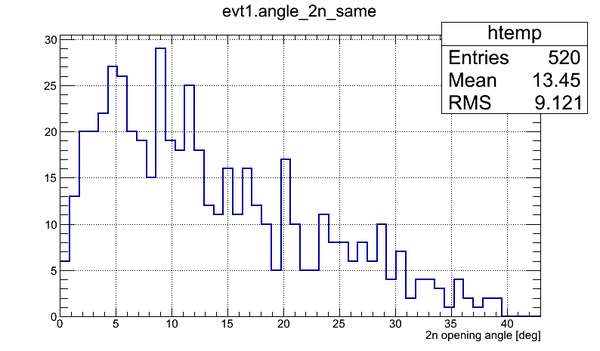
The 2n opening angle for the case (1) is shown below:
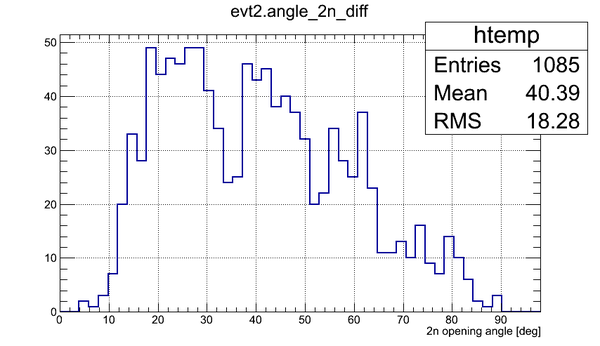
The 2n opening angle for the case (2) is shown below:
It can be seen that the probability to hit two different detectors about twice larger than the probability to hit the same detector for the isotropic point source of neutrons.
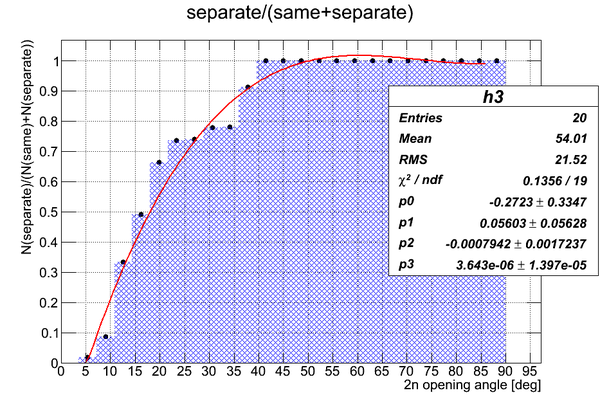
The plot of N(different)/(N(same)+N(different)):
Hence, (A) in the experimental data we can not see neutron pairs with the opening angle less then ~5 degrees because they all are multi-hit data, (B) multi-hit data disappear at 2n opening angle above 40 degrees.
Correction of experimental data for the geometry
As it was shown above we could not detect multiple hits of the same detector. In order to obtain the influence of the geometry on the data we will consider 2n opening angle for neutrons hitting two different detectors.
Comparison of the data and 2n opening angle obtained via simulation is shown below. The histograms have same number of bins (25) and same bin width (7.2).
The plot on the right was normalized to the total number of neutron pairs sampled during the simulation.
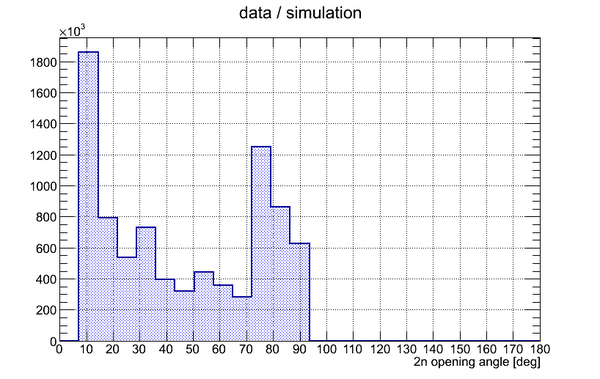
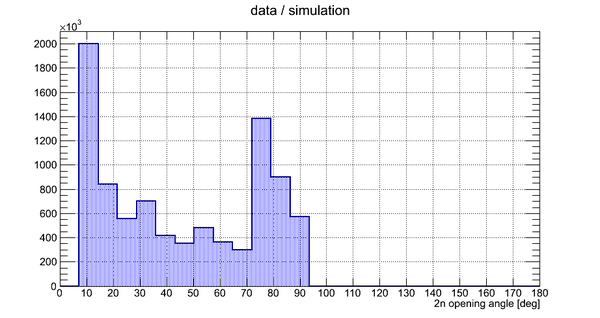
The result of division of experimental data histogram by the normalized simulation data histogram is shown below:
Statistics over the last three bins
The number of neutron pairs sampled was increased up to 4E+6. The simulated data (see figure below) have pretty much the same trend as it was presented above for 2.5E+6 sampled neutrons.
The last three bins were chosen to do statistical analysis. The data are shown below in the table.
| Bin center(full width) [deg] | Experiment [cnts+/-sqrt(cnts)] | Simulation [cnts+/-sqrt(cnts)] | Normzd simulation | Experiment/(Normlzd simulation) |
|---|---|---|---|---|
| 75.6(7.2) | 19.0 +/- 4.4 | 55.0 +/- 7.4 | (1.4 +/- 0.2)E-5 | 13.82E+5 +/- 27% |
| 82.8(7.2) | 9.0 +/- 3.0 | 40.0 +/- 6.3 | (1.0 +/- 0.2)E-5 | 9.0E+5 +/- 39% |
| 90(7.2) | 1.0 +/- 1.0 | 7.0 +/- 2.6 | (0.17 +/- 0.06)E-5 | 5.8E+5 +/- 100% |
As can be seen the last bin in the experimental data has only one count. So it is hard to do a certain conclusion about the precision of the measurement for the last bin. The errors are a bit smaller for the two following bins. It is possible to decrease the number of bins, however, the angular resolution will be decreased either. Currently the bin width is 7.2 degree.
Reduced number of bins
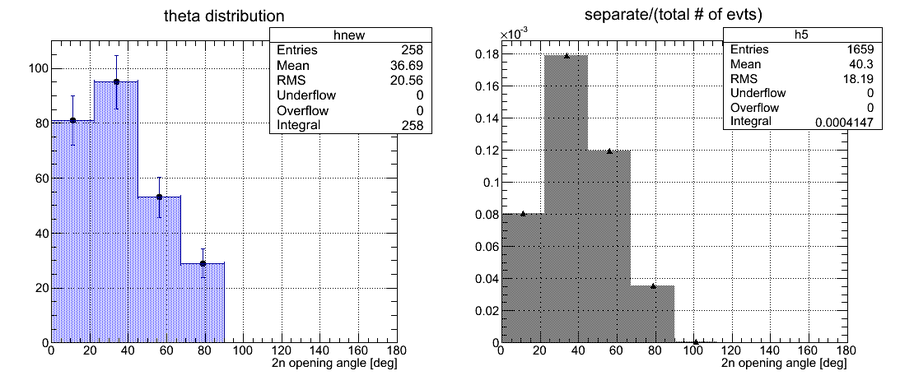
After the number of bins was reduced the experimental data (left) and normalized simulation data (right) look like this:
Now the bin width is 22.5 degrees.
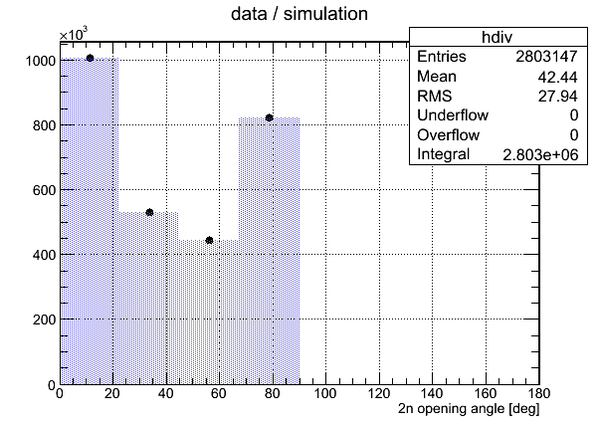
The plot of the experimental data divided by the normalized simulation data is shown below:
There is still increase of event number in the 2n opening angle spectrum in the bin# 4. Statistics on the 4th bin is presented below in the table.
| Bin center(full width) [deg] | Experiment [cnts+/-sqrt(cnts)] | Simulation [cnts+/-sqrt(cnts)] | Normzd simulation | Experiment/(Normlzd simulation) |
|---|---|---|---|---|
| 78.75(22.5) | 29.0 +/- 5.4 | 141.0 +/- 11.9 | (35.25 +/- 2.97)E-6 | 82E+4 +/- 20% |
