Difference between revisions of "HRRL 03-17-2011"
(→Q1) |
|||
| Line 176: | Line 176: | ||
y-projection: | y-projection: | ||
| + | |||
| + | |||
| + | |||
| + | = Fits After the Second Mapping of the Quad = | ||
| + | |||
| + | Quad was mapping for the second time to find effective length for the different currents. Link is at [[https://wiki.iac.isu.edu/index.php/Second_Mapping_of_Quadruple_Magnets]]. | ||
| + | |||
| + | == X == | ||
| + | [[File:HRRL_Pos_Emit_test_Mar17_2011_Fit_after_2nd_quad_mapping_q1.png | 300 px]] | ||
| + | |||
| + | x-projection: | ||
| + | |||
| + | emit=0.417 +- 0.023 mm*mrad, emit_norm=11.43 +- 0.64 mm*mrad | ||
| + | |||
| + | beta=1.385 +- 0.065, alpha=0.97 +-0.07 | ||
| + | |||
| + | parabola fit for x-projection (y in mm unit): | ||
| + | |||
| + | y = (3.67838 +-0.02232) + (-4.17265+-0.22057)*x + (5.55113+-0.42056)*x.*x | ||
| + | |||
| + | == Y == | ||
| + | |||
| + | [[File:HRRL_Pos_Emit_test_Mar17_2011_Fit_after_2nd_quad_mapping_q2.png | 300 px]] | ||
| + | |||
| + | y-projection: | ||
| + | |||
| + | emit=0.338 +- 0.065 mm*mrad, emit_norm=9.25 +- 1.77 mm*mrad | ||
| + | |||
| + | beta=1.170 +- 0.192, alpha=0.22 +-0.10 | ||
| + | |||
| + | parabola fit for y-projection (y in mm unit): | ||
| + | |||
| + | y = (2.84273 +-0.04370) + (1.02450+-0.51931)*x + (3.79913+-1.23728)*x.*x | ||
| + | |||
[[HRRL_Emittance_Measurements_March14-18-2011]] | [[HRRL_Emittance_Measurements_March14-18-2011]] | ||
Revision as of 06:10, 5 September 2011
Accelerator Tuning
Good Tune Used for good Scan
By Dr. Kim
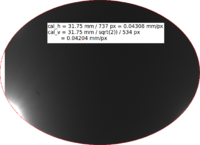
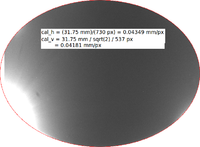
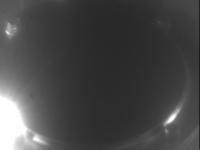
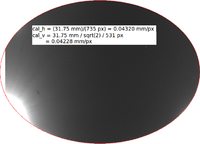
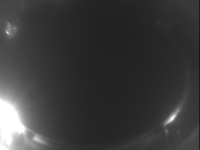
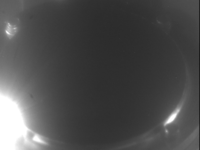
Calibration
| image | OTR image | cal_h (mm/px) | cal_v (mm/px) |
 |
 |
0.04308 | 0.04204 |
 |
 |
0.04320 | 0.04228 |
 |
 |
0.04349 | 0.04181 |
 |
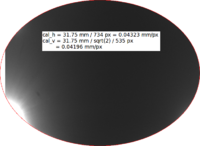 |
0.04323 | 0.04196 |
 |
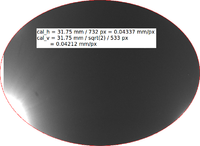 |
0.04337 | 0.04212 |
| mean (mm/px) | mean (mm/px) | ||
Results
Q1
At lower current background subtraction gets worse, because singal/noise drops.
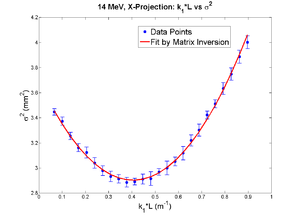
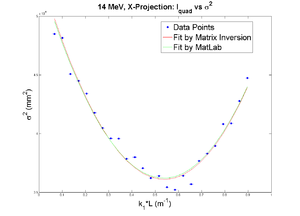
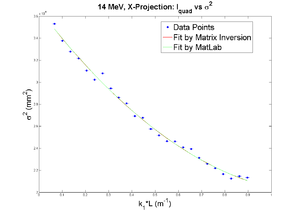
42 mA, Positive Current, X projection
emit=0.388 +- 0.008 mm*mrad, emit_norm=10.64 +- 0.22 mm*mrad
beta=1.285 +- 0.024, alpha=0.94 +-0.03
//K1*L(1/m) er K1*L sgima^2(mm) er sigma^2
Media:2011_Mar_Emit_fit_data_x.txt
parabola fit for x-projection:
parabola fit for y-projection (y in mm unit):
y = (3.69167 +-0.02346) + (-3.89000+-0.12250)*x + (4.79738+-0.13309)*x.*x
Data created from parabola fit
Media:2011_Mar_Emit_data_from_fit_x.txt
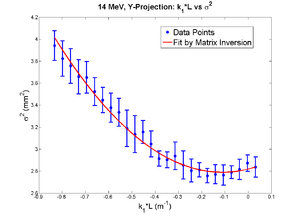
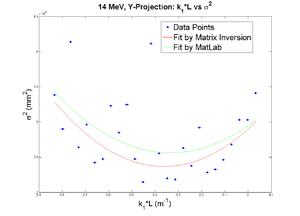
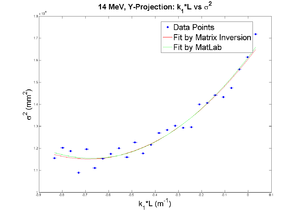
42 mA, Negative Current, Y projection
emit=0.266 +- 0.018 mm*mrad, emit_norm=7.30 +- 0.50 mm*mrad
beta=0.918 +- 0.068, alpha=0.19 +-0.06
//K1*L(1/m) er K1*L sgima^2(mm) er sigma^2
Media:2011_Mar_Emit_fit_data_y.txt
parabola fit for y-projection (y in mm unit):
y = (2.81806 +-0.03890) + (0.52202+-0.26284)*x + (2.35025+-0.34553)*x.*x
Data created from parabola fit
Media:2011_Mar_Emit_data_from_fit_y.txt
X and Y emittances are different. The parabola in X reaches min around 0.4, while in Y reaches around 0.15. Which suggests quadrupole strengths of X and Y are way different for same coil current. Which might suggest beam is not centered, because when beam is off-centered we have this can occur.
20 mA, Positive Current, X projection
10 mA, Positive Current, X projection
5 mA, Positive Current, X projection
Q4
42 mA All Other Quads off
Haven't reach minimum.
42 mA Q1_at_-2A, Q2_at_+8A, Q3_at_-6A
x-projection:
y-projection:
Fits After the Second Mapping of the Quad
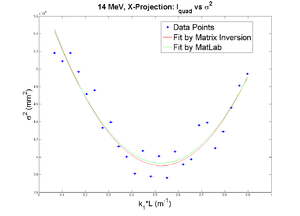
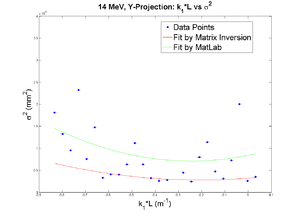
Quad was mapping for the second time to find effective length for the different currents. Link is at [[1]].
X
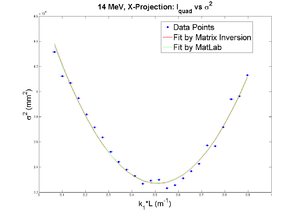
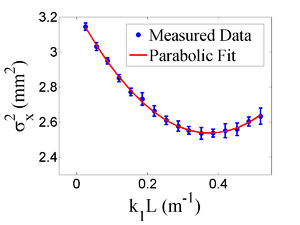
x-projection:
emit=0.417 +- 0.023 mm*mrad, emit_norm=11.43 +- 0.64 mm*mrad
beta=1.385 +- 0.065, alpha=0.97 +-0.07
parabola fit for x-projection (y in mm unit):
y = (3.67838 +-0.02232) + (-4.17265+-0.22057)*x + (5.55113+-0.42056)*x.*x
Y
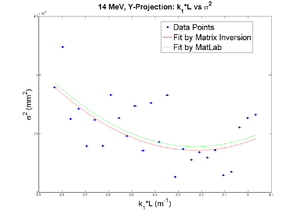
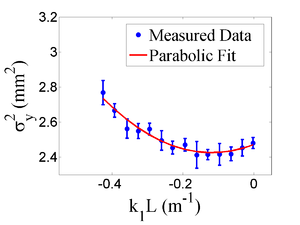
y-projection:
emit=0.338 +- 0.065 mm*mrad, emit_norm=9.25 +- 1.77 mm*mrad
beta=1.170 +- 0.192, alpha=0.22 +-0.10
parabola fit for y-projection (y in mm unit):
y = (2.84273 +-0.04370) + (1.02450+-0.51931)*x + (3.79913+-1.23728)*x.*x

