Difference between revisions of "Double Peak Analysis"
Jump to navigation
Jump to search
| Line 18: | Line 18: | ||
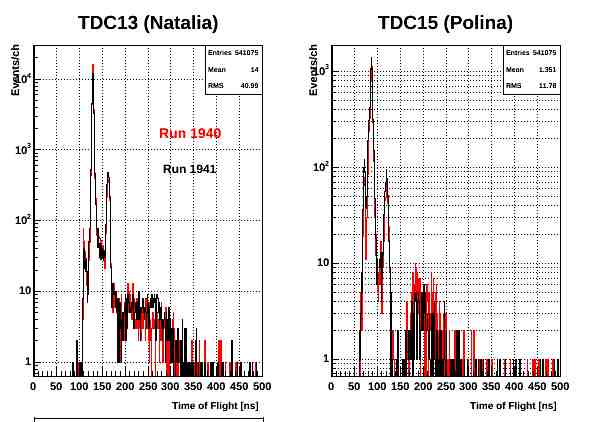
[[File:TODplot.jpg]] | [[File:TODplot.jpg]] | ||
| + | |||
| + | As can be seen, we have one peak to the right of the gamma flash and two to the left. | ||
[https://wiki.iac.isu.edu/index.php/Data_Analysis go back] | [https://wiki.iac.isu.edu/index.php/Data_Analysis go back] | ||
Revision as of 17:04, 18 April 2011
Gamma Peak Analysis
The point is to determine why we have all these peaks around the spot the gamma flash is supposed to be. First, I will do an analysis to see exactly where the gamma flash is. Then, we should be able to do some tracking down of what the other peaks are from by converting the TDC spectrum into a distance scale to see how far away the other peaks are, assuming they are from gammas.
Calibration Runs
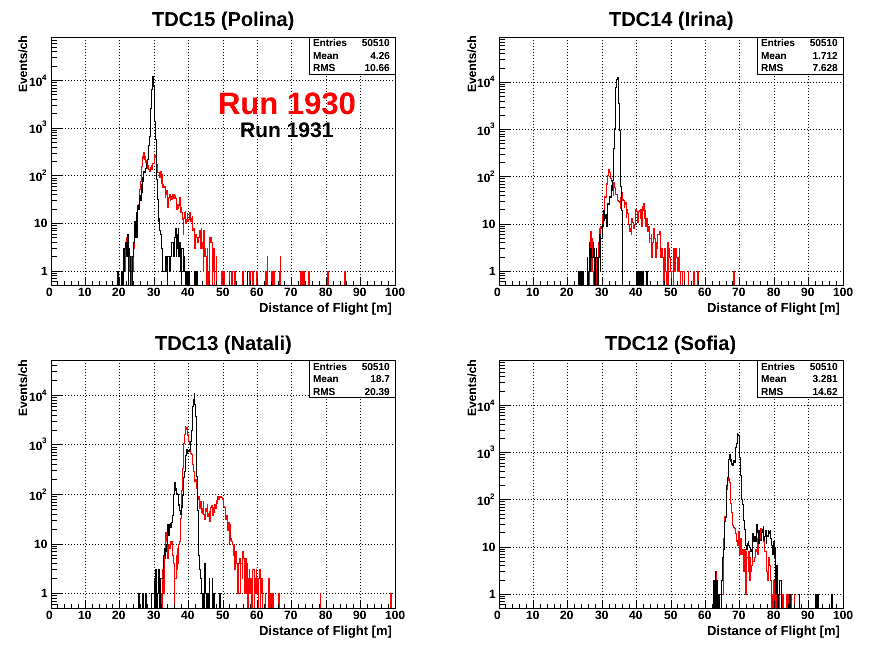
The lead in front of the neutron detectors was removed. Run 1930 shows the results with no physics target, and 1931 has a D2O target.
Distance Spectrum
The TDC spectra were then converted to a distance scale.
As can be seen, we have one peak to the right of the gamma flash and two to the left.

