Difference between revisions of "Lab 8 RS"
| Line 170: | Line 170: | ||
To find the effective impedance we just need the slope of this line so | To find the effective impedance we just need the slope of this line so | ||
| − | <math>R=\frac{1}{p_1}\ \left[ \frac{V}{mA} \right] = \frac{1}{181.6\pm 15.96}\ k\Omega | + | <math>R=\frac{1}{p_1}\ \left[ \frac{V}{mA} \right] = \frac{1}{181.6\pm 15.96}\ k\Omega = 5.51\ pm 0.48\ \Omega</math> |
Revision as of 04:54, 20 February 2011
- Lab 8 The Diode
- Objective: Measure the current-voltage curve of a silicon diode.
Reverse current
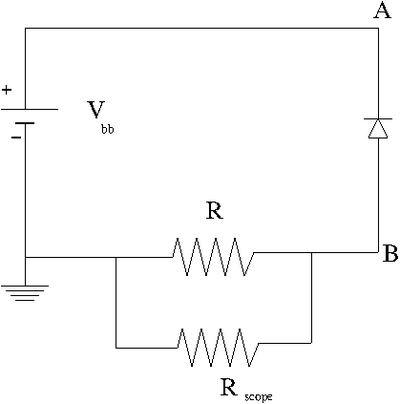
1.) Construct the circuit below using a DC power supply, a diode.
2.) Attach an Oscilloscope with internal resistance . The scope will measure the voltage drop across R and thus the current will be given by this voltage difference divided by R.
3.) Determine a value for R which will allow you to measure a current of at least 10 mA (prefeferably 50 mA) at the diodes reverse bias cut off voltage. Show your power calculation. (5 pnts)
For low current measurements I am going to use . Using this resistors and assuming the minimum voltage I can measure is I will be able to measure current equal . And assuming the maximum voltage I can measure is I will be able to measure current equal .
To measure some current points above I am going to use . Using this resistors and assuming the max voltage I will measure is I will be able to measure current about .
So I am going to cover during my measurements the range from to using resistor of . And the range from to using resistor of .
About my power calculation see my table below.
4.) Measure the diode reverse current as a function of the DC supply voltage.
| Resistor, | Bias Voltage, | Scope Voltage, | Current, | Diode power, | R power, |
|---|---|---|---|---|---|
| 988.00.5 | -0.041300.00005 | -0.00010.0002 | -0.0001 -0.0002 | 0.000 | 0.000 |
| 988.00.5 | -1.28100.0005 | -0.00010.0002 | -0.0001 -0.0002 | 0.000 | 0.000 |
| 988.00.5 | -2.07000.0005 | -0.0040.002 | -0.004 -0.002 | 0.000 | 0.000 |
| 988.00.5 | -2.90700.0005 | -0.0800.005 | -0.08 -0.01 | 0.000 | 0.000 |
| 988.00.5 | -3.40100.0005 | -0.30 0.01 | -0.30 -0.01 | 0.001 | 0.000 |
| 988.00.5 | -3.89100.0005 | -1.00 0.05 | -1.01 -0.05 | 0.004 | 0.001 |
| 988.00.5 | -4.1600.005 | -2.00 0.05 | -2.02 -0.05 | 0.008 | 0.004 |
| 988.00.5 | -4.4000.005 | -4.0 0.1 | -4.05 -0.10 | 0.018 | 0.016 |
| 988.00.5 | -4.6000.005 | -8.0 0.2 | -8.10 -0.20 | 0.037 | 0.065 |
| 988.00.5 | -4.6600.005 | -10.0 0.5 | -10.12 -0.51 | 0.047 | 0.101 |
| 988.00.5 | -4.7500.005 | -15.0 0.5 | -15.18 -0.51 | 0.072 | 0.228 |
| 988.00.5 | -4.7900.005 | -18.0 0.5 | -18.22 -0.51 | 0.087 | 0.328 |
| 988.00.5 | -4.8100.005 | -20.0 0.5 | -20.24 -0.51 | 0.097 | 0.405 |
| 98.400.05 | -4.8400.005 | -2.4 0.1 | -24.39 -1.02 | 0.118 | 0.059 |
| 98.400.05 | -4.8800.005 | -3.0 0.1 | -30.49 -1.02 | 0.149 | 0.091 |
| 98.400.05 | -4.9300.005 | -4.0 0.1 | -40.65 -1.02 | 0.200 | 0.163 |
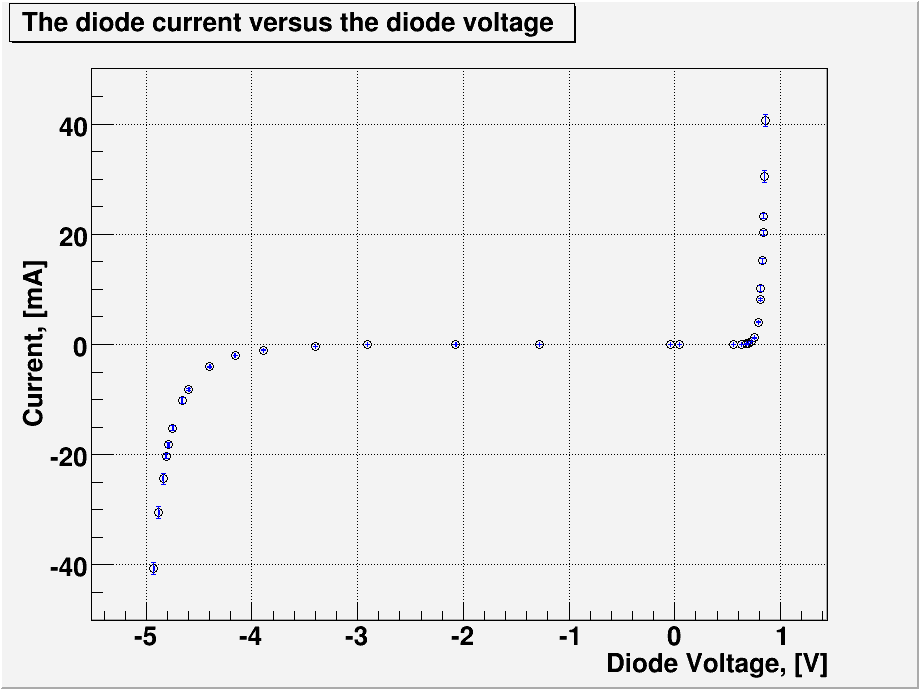
5.) Fill in the blank. The reverse biased diode act as a constant current source. As we can see from the plot below it keeps the constant current before the turn on voltage point.(5 pnts)
Forward Current
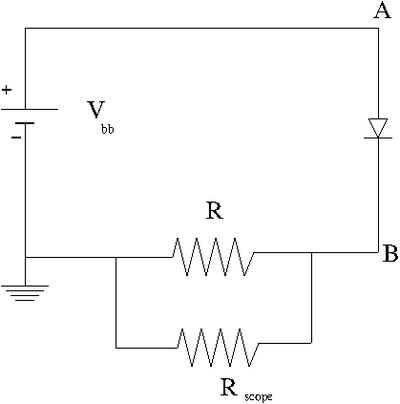
1.) now swap the diode direction and repeat the measurement in the previous section.
2.) Attach an Oscilloscope with internal resistance . The scope will measure the voltage drop across R and thus the current will be given by this voltage difference divided by R.
3.) Determine a value for R which will allow you to measure a current of at least 10 mA (preferably 50 mA) at the diodes forward bias cut off voltage.
All my R calculation is the same as for reverse current case above. I am going to cover during my measurements the range from to using resistor of . And the range from to using resistor of .
About my power calculation see my table below.
4.)Measure the diode reverse current as a function of the DC supply voltage.
| Resistor, | Bias Voltage, | Scope Voltage, | Current, | Diode power, | R power, |
|---|---|---|---|---|---|
| 988.0± 0.5 | 0.04120± 0.00005 | 0.0001± 0.0002 | 0.0001± 0.0002 | 0.000 | 0.000 |
| 988.0± 0.5 | 0.5530± 0.0005 | 0.0001± 0.0002 | 0.0001± 0.0002 | 0.000 | 0.000 |
| 988.0± 0.5 | 0.6340± 0.0005 | 0.010± 0.002 | 0.010± 0.002 | 0.000 | 0.000 |
| 988.0± 0.5 | 0.6760± 0.0005 | 0.090± 0.005 | 0.09± 0.01 | 0.000 | 0.000 |
| 988.0± 0.5 | 0.6990± 0.0005 | 0.200± 0.005 | 0.20± 0.01 | 0.000 | 0.000 |
| 988.0± 0.5 | 0.7290± 0.0005 | 0.50± 0.01 | 0.51± 0.01 | 0.000 | 0.000 |
| 988.0± 0.5 | 0.7520± 0.0005 | 1.20± 0.05 | 1.21± 0.05 | 0.001 | 0.001 |
| 988.0± 0.5 | 0.7900± 0.0005 | 4.0± 0.1 | 4.05± 0.10 | 0.003 | 0.016 |
| 988.0± 0.5 | 0.8090± 0.0005 | 8.0± 0.2 | 8.10± 0.20 | 0.007 | 0.065 |
| 988.0± 0.5 | 0.8150± 0.0005 | 10.0± 0.5 | 10.12± 0.51 | 0.008 | 0.101 |
| 988.0± 0.5 | 0.8270± 0.0005 | 15.0± 0.5 | 15.18± 0.51 | 0.013 | 0.228 |
| 988.0± 0.5 | 0.8370± 0.0005 | 20.0± 0.5 | 20.24± 0.51 | 0.017 | 0.405 |
| 988.0± 0.5 | 0.8410± 0.0005 | 23.0± 0.5 | 23.28± 0.51 | 0.020 | 0.535 |
| 98.40± 0.05 | 0.8510± 0.0005 | 3.0± 0.1 | 30.49± 1.02 | 0.026 | 0.091 |
| 98.40± 0.05 | 0.8610± 0.0005 | 4.0± 0.1 | 40.65± 1.02 | 0.035 | 0.163 |
5.) Fill in the blank. The forward biased diode act as a constant voltage source. As we can see from the plot below it keeps the constant voltage beyond the turn on voltage point. (5 pnts)
Graph
- Plot the diode current (on the ordinate) versus the diode voltage (on the abscissa)for the forward and reverse biased diode on the same graph. (35 pnts)
Questions
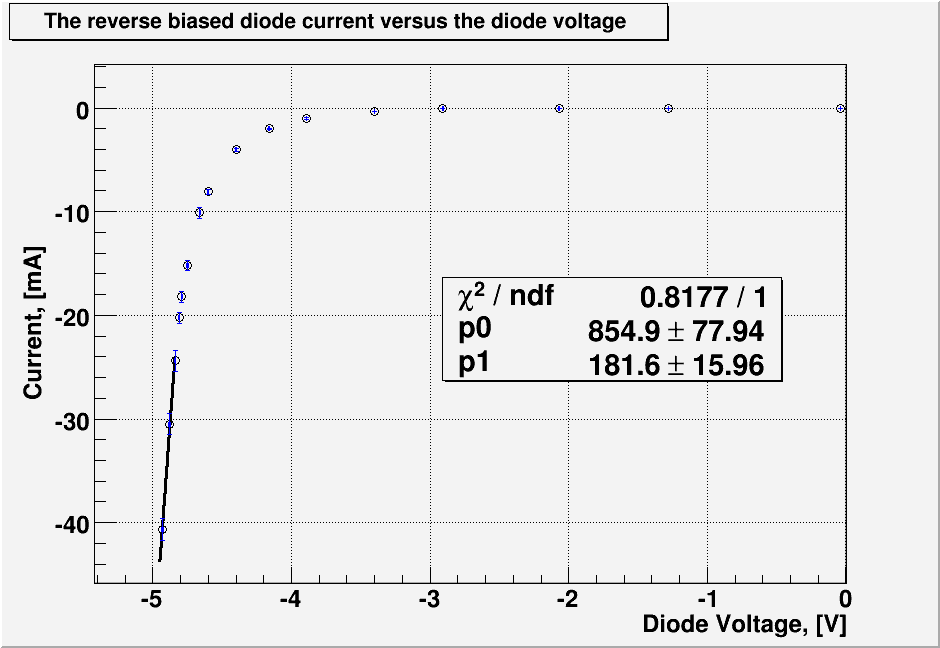
1.) Plot the reverse biased diode for voltages beyond the turn on voltage and measure the effective impedance of the diode using a linear fit. (20 pnts)
From the plot above the fitting line beyond the turn on reverse voltage is given by
where and .
To find the effective impedance we just need the slope of this line so
2.)The measured reverse biased turn on voltage is _________ Volts for silicon diode type # IN_____________. The % difference between the measured turn on voltage and the one given in the specification is __________%. Circle the correct answer in the parentheses. This % difference (is / is not) within the measurement uncertainty. ( 10 pnts)
3.) Plot the forward biased diode and measure the effective impedance of the diode using a linear fit in the linear region at large bias voltages. ( 20 pnts)
Show and tell
1.) Use a two channel oscilloscope in "x-y" mode to illustrate the V-vs-I curve to your instructor.
2.) Create a circuit to cause an LED to illuminate.
Forest_Electronic_Instrumentation_and_Measurement
Go Back to All Lab Reports


