Difference between revisions of "Lab 5 RS"
Jump to navigation
Jump to search
| Line 98: | Line 98: | ||
==Questions== | ==Questions== | ||
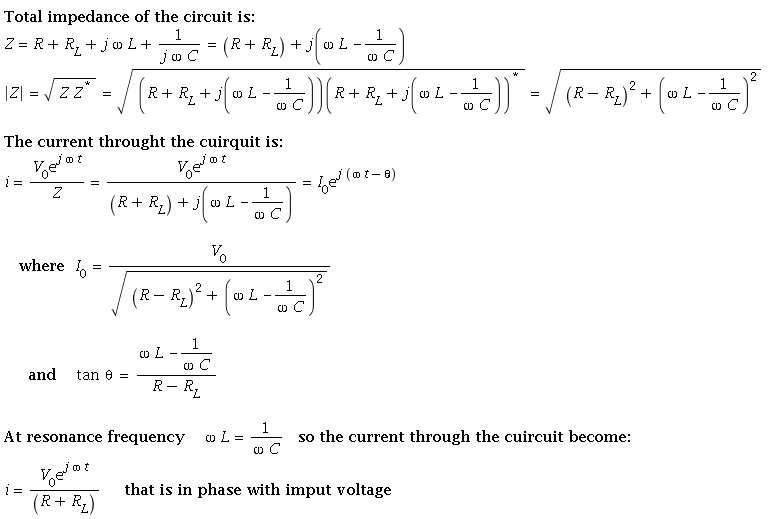
===What is the current <math>I</math> at resonance? (5 pnts)=== | ===What is the current <math>I</math> at resonance? (5 pnts)=== | ||
| + | |||
| + | [[File:Question1.png | 800 px]] | ||
| + | |||
===What is the current as <math>\nu \rightarrow \infty</math>? (5 pnts)=== | ===What is the current as <math>\nu \rightarrow \infty</math>? (5 pnts)=== | ||
Revision as of 05:02, 6 February 2011
- LC Resonance circuits
The LC circuit
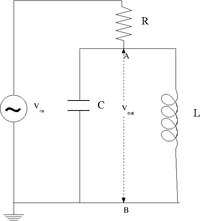
Design a parallel LC resonant circuit with a resonant frequency between 50-200 kHz. use = 10 - 100 , R = 1k
I choose the following values for and :
So the resonance frequency is
And
Construct the LC circuit using a non-polar capacitor
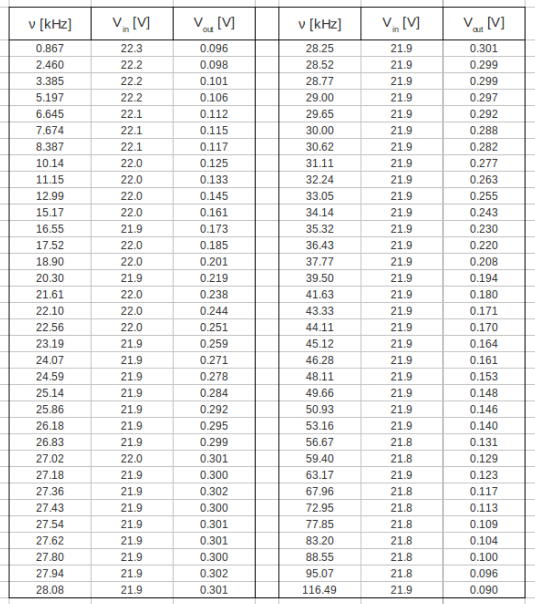
Measure the Gain as a function of frequency. (25 pnts)
Compare the measured and theoretical values of the resonance frequency () (10 pnts)
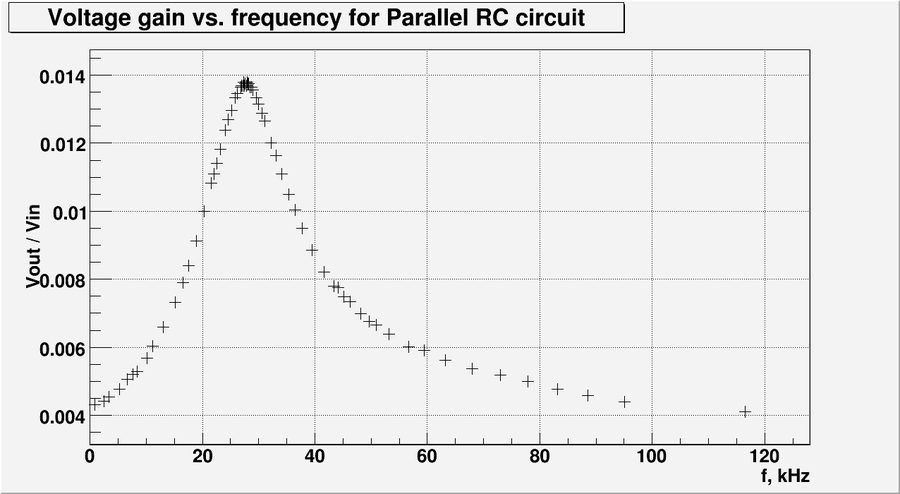
Let's plot the data from table above:
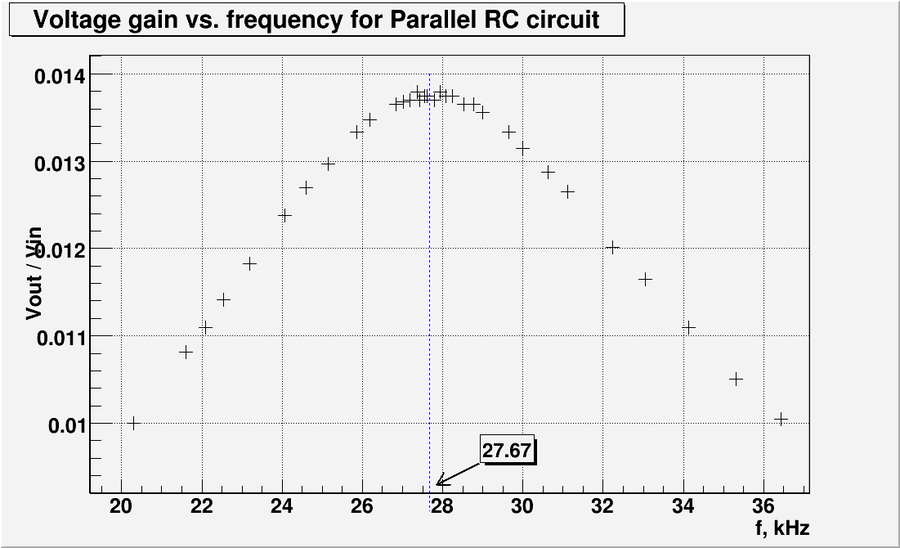
And let's zoom the graph above at resonance frequency:
So the experimentally measured resonance frequency is:
And the predicted value of resonance frequency is:
The error is:
The error is small so I was lucky
Questions
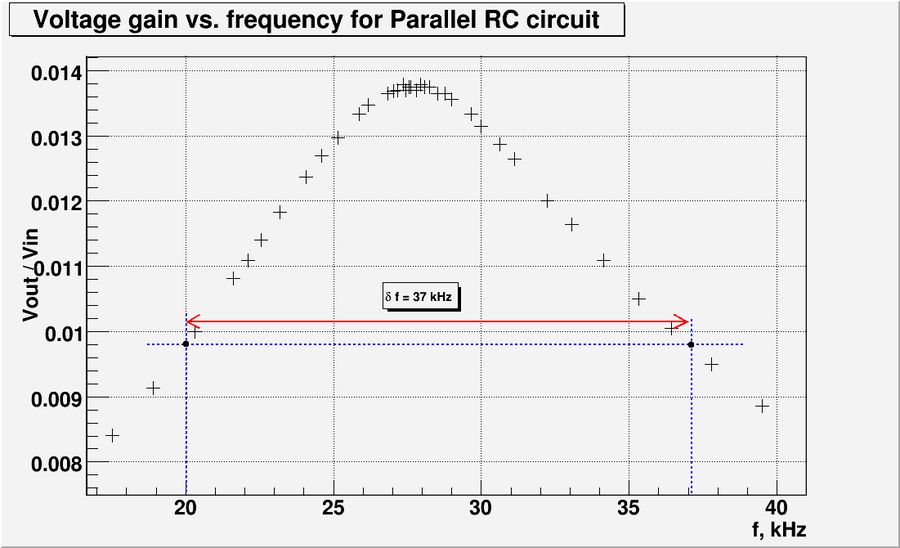
What is the bandwidth of the above circuit? (5 pnts)
From the plot above we have
The bandwidth defined as the width from to where the amplitude of signal drop down to .
At this point . Let's plot this line and calculate the bandwidth.
So the bandwidth of the above circuit is
The RLC cicuit
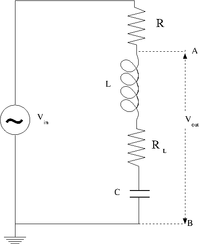
Design and construct a series LRC circuit
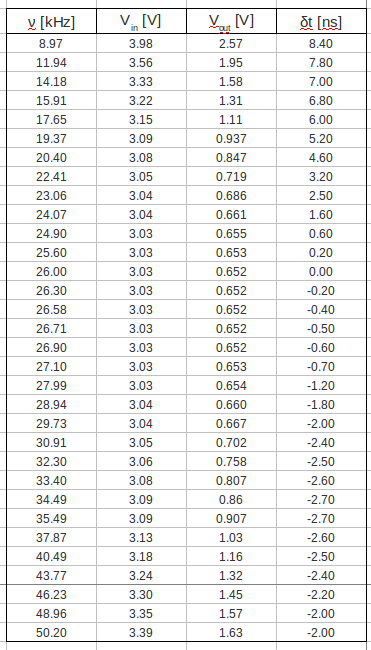
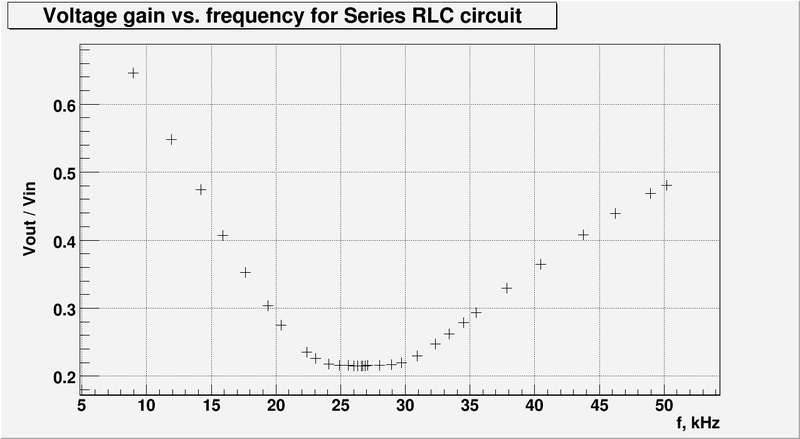
Measure and Graph the Gain as a function of the oscillating input voltage frequency. (25 pnts)
- In the table below are my measurements for voltage gain and phase shift:
- And let's graph the gain as a function of the input voltage frequency:
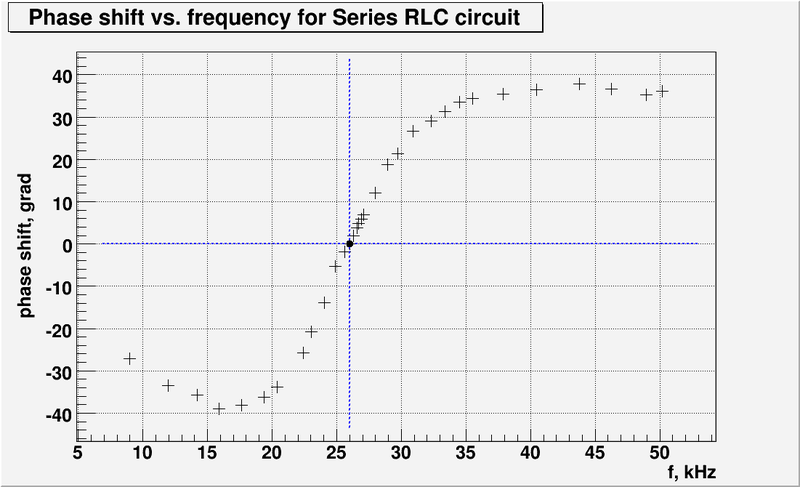
Measure and Graph the Phase Shift as a function of the oscillating input voltage frequency. (25 pnts)
- My phase shift measurements presented in the table above. And let's graph the phase shift as a function of the input voltage frequency:
