Difference between revisions of "Emittance/TWISS parameter extraction"
Jump to navigation
Jump to search
| Line 5: | Line 5: | ||
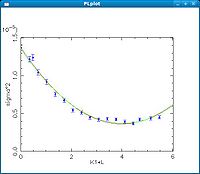
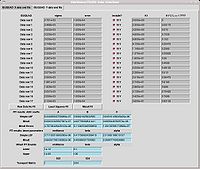
Y plot and the GUI with results for the first quad scan. | Y plot and the GUI with results for the first quad scan. | ||
[[File:ISU_1.jpeg|200px|thumb|left|Y beam size squared vs K1*L]] | [[File:ISU_1.jpeg|200px|thumb|left|Y beam size squared vs K1*L]] | ||
| − | [[File:ISU_2.jpeg|200px|thumb| | + | [[File:ISU_2.jpeg|200px|thumb|center|CEBAF graphical emittance tool with Y data and results shown]] |
| Line 12: | Line 12: | ||
X plot and the GUI with results for the second quad scan. | X plot and the GUI with results for the second quad scan. | ||
[[File:ISU_3.jpeg|200px|thumb|left|X beam size squared vs K1*L]] | [[File:ISU_3.jpeg|200px|thumb|left|X beam size squared vs K1*L]] | ||
| − | [[File:ISU_4.jpeg|200px|thumb| | + | [[File:ISU_4.jpeg|200px|thumb|center|CEBAF graphical emittance tool with X data and results shown]] |
Revision as of 20:03, 22 October 2010
Using the perl/PDL script, beam sizes for Y (quad scan 0) and X (quad scan 1) were measured. These beam sizes were put into a "sdds" file so the nominal CEBAF emittance/TWISS tool could be used to plot and fit the data.
Two fits are performed a simple Least Squares Fit and one based on MINUIT. The LSF is also used to seed the MINUIT fit.
Y plot and the GUI with results for the first quad scan.
X plot and the GUI with results for the second quad scan.


