Difference between revisions of "FC Analysis"
Jump to navigation
Jump to search
| Line 18: | Line 18: | ||
1. x axis: ADC mean value for one pulse (need to be normalized by factor (1/1000))<br> | 1. x axis: ADC mean value for one pulse (need to be normalized by factor (1/1000))<br> | ||
2. y axis: number of pulse w/ that ADC mean value<br> | 2. y axis: number of pulse w/ that ADC mean value<br> | ||
| − | [[File:1477_1.png]] | + | [[File:1477_1.png]] [[File:1473_1.png]]<br> |
| − | [[File:1473_1.png]]<br> | ||
[[File:1465_1.png]]<br> | [[File:1465_1.png]]<br> | ||
Revision as of 00:17, 28 March 2010
For each beam pulse:
For distribution over all beam pulses:
Here is:
1. ADC# = bridge#
2. Pulse# = ReadOut# = Entry# = Event#
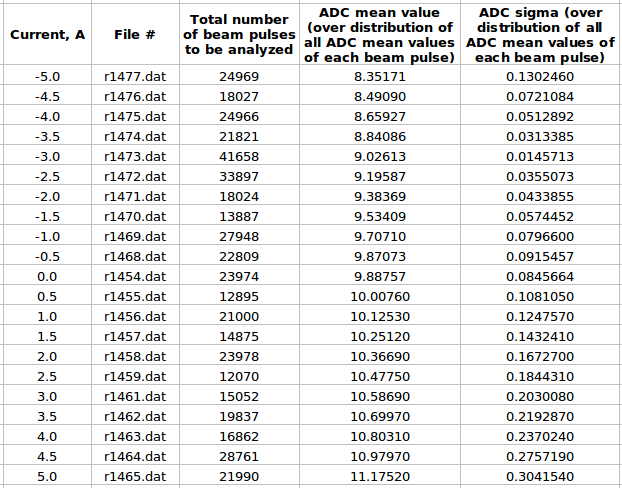
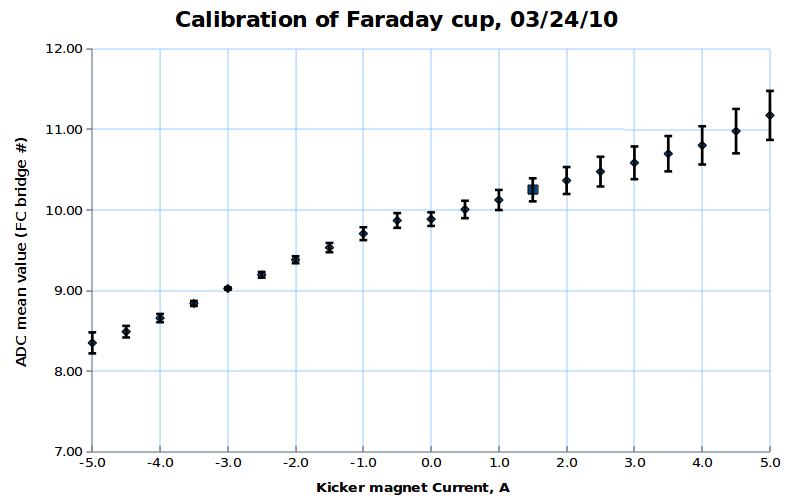
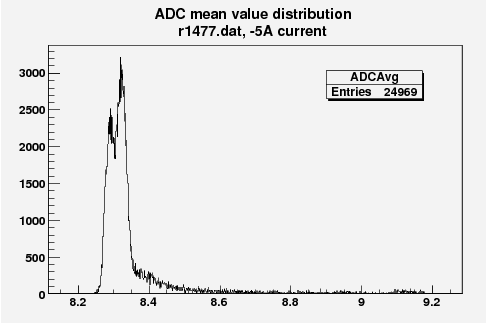
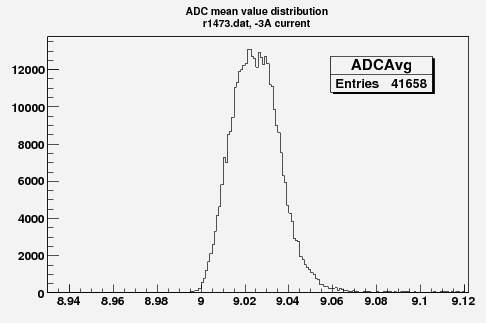
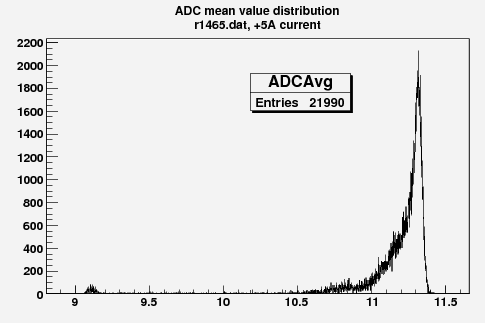
Some examples of ADC mean value distribution. Here are:
1. x axis: ADC mean value for one pulse (need to be normalized by factor (1/1000))
2. y axis: number of pulse w/ that ADC mean value
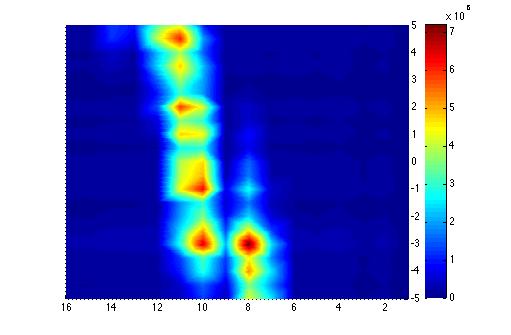
Below is the plot of the charge in Faraday cup (pC) as a function of magnet current (vertical axis, A) (basically magnetic field) and ADC (horizontal axis).
