Difference between revisions of "Plot"
Jump to navigation
Jump to search
| Line 1: | Line 1: | ||
[[Image:Spread_of_exp_points.jpg | 500px]] | [[Image:Spread_of_exp_points.jpg | 500px]] | ||
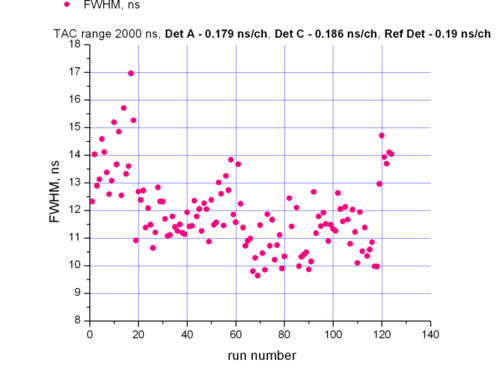
| − | Fig 1. - FWHM distribution measured for <math>\gamma - peak</math> | + | '''Fig 1. - FWHM distribution measured for <math>\gamma - peak</math>''' |
| + | |||
[[Image:histo1.jpg | 500px]] | [[Image:histo1.jpg | 500px]] | ||

