Difference between revisions of "LB Thesis NewSNR Corrections"
Jump to navigation
Jump to search
| Line 2: | Line 2: | ||
[[File:HighSNR AvsConc Se81m.png|200px]] | [[File:HighSNR AvsConc Se81m.png|200px]] | ||
| + | |||
| + | This plot doesn't look very good as the 50% sample has a lower activity than the 10% sample. Try plotting this at the time of beam off. Note these are done using fits with the accepted half life vs. the experimental half life. The error bars represent |(Free Fit A) - (Fixed Fit A)| | ||
| + | |||
| + | [[File:Se81m AvsConc BeamOff.png|200px]] | ||
Revision as of 15:44, 25 July 2018
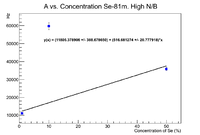
First plot the efficiency corrected activity as a function of concentration. These points are not weighted by mass, but they are fully corrected as per the thesis otherwise. These values are the activity at the highest value of N/B
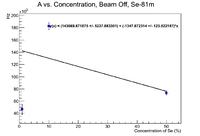
This plot doesn't look very good as the 50% sample has a lower activity than the 10% sample. Try plotting this at the time of beam off. Note these are done using fits with the accepted half life vs. the experimental half life. The error bars represent |(Free Fit A) - (Fixed Fit A)|

