Difference between revisions of "LB Thesis SNR"
| Line 12: | Line 12: | ||
[[File:LB 170048 Background HLPlot Expo.png|200px]] | [[File:LB 170048 Background HLPlot Expo.png|200px]] | ||
[[File:LB 170049 Background HLPlot Expo.png|200px]] | [[File:LB 170049 Background HLPlot Expo.png|200px]] | ||
| + | |||
| + | 50% Fit Parameters: Constant = 2.11 <math> \pm </math> 0.004 , Slope = 1.99 <math> \pm </math> 0.002 <math> \times 10^{-4} </math> | ||
| + | |||
| + | 10% Fit Parameters: 3.22 <math> \pm </math> 0.008, Slope = 3.67 <math> \pm </math> 0.003 <math> \times 10^{-4} </math> | ||
| + | |||
| + | 1% Fit Parameters: | ||
| + | 1% Fit Parameters 4.685 <math> \pm </math> 0.004, 4.30 <math> \pm </math> 0.001 <math> \times 10^{-4} </math> | ||
Revision as of 23:27, 24 June 2018
Background Analysis
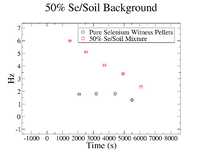
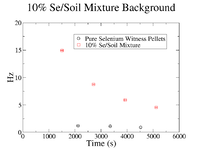
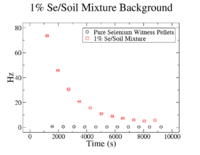
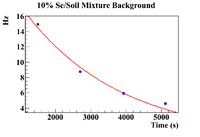
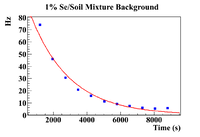
In order to find the SNR at , the background was analyzed to check if it remained constant from until . First, the background was plotted for each concentration of Se/Soil and was overlaid with the the background in the pure sample for each respective target.
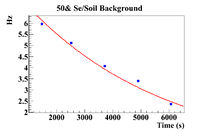
The clearest exponential behavior is seen in the 1% sample. The background rate dropped by 62% between the first and second measurements ( = 7.5 minutes). This indicated that considering the background to be constant from until , which was an average of 23.3 2.67 minutes would not be sufficient. Since this was the case, an exponential fit was attempted on the 1% mixture data to find the half life of the background (even though this is still just an estimate).
50% Fit Parameters: Constant = 2.11 0.004 , Slope = 1.99 0.002
10% Fit Parameters: 3.22 0.008, Slope = 3.67 0.003
1% Fit Parameters: 1% Fit Parameters 4.685 0.004, 4.30 0.001
