Difference between revisions of "LB Thesis Outline"
| Line 40: | Line 40: | ||
[[LB May 2017 Det B Efficiency]] | [[LB May 2017 Det B Efficiency]] | ||
| + | |||
| + | |||
| + | ==Calibration Method== | ||
=Data/Error Analysis= | =Data/Error Analysis= | ||
Revision as of 17:42, 6 March 2018
Abstract
Photon Activation Analysis functions as a way to quantify isotopic concentrations in a certain material. This information is very useful when trying to find potential contaminants within a sample. Selenium, when ingested in large amounts, is harmful as it is a toxic substance. When applying PAA, one of the most important pieces of the investigation is ensuring that isotopes within a sample are detectable i.e. how active does a sample have to be to detect the isotopes of interest? Soil was gathered and targets were created with 50%, 10%, 1%, and 0.1% concentration by mass of selenium which was introduced to the soil during the target creation. The targets were irradiated using the Linear Accelerator at the Idaho Accelerator Center with a beam energy of 32 MeV. Once active, the spectral data was gathered using a high purity germanium detector.
- Give results of signal to noise ratio plot (Experimental MDA)*
Theory
Experimental Setup
Give beam parameters, include schematic of the experimental setup (xfig),include pictures of accelerator and W/Al Radiator. Give GPS coordinates for soil gathered.
Target Information
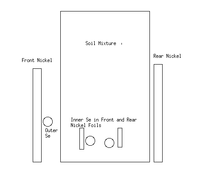
a schematic of the target is shown below:
| Sample | Soil Mass (g) | Inner Se Mass (g) | Outer Se Mass (g) | Front Outer Nickel Foil (g) | Front Inner Nickel Foil (g) | Rear Inner Nickel Foil (g) | Rear Outer Nickel Foil (g) |
| 50% Sample | 0.4921 | 0.5145 | 0.0900 | 1.5535 | 0.3956 | 0.3050 | 1.6140 |
| 10% Sample | 4.9921 | 0.5142 | 0.1245 | 1.3310 | 0.3592 | 0.2768 | 1.2196 |
| 1% Sample | 10.2403 | 0.0954 | 0.0914 | 3.4274 | 1.8672 | 1.7220 | 3.4887 |
| 0.1% Sample | 100.1242 | 0.1074 | 0.1042 | 1.3911 | 0.4467 | 0.2548 | 1.3804 |
DAQ
Split Run Measurement Technique
Talk about how data was gathered using the split run technique. Include plot of Time vs. counts to show how time cuts are selected from a sample. Co-60 was used as a flag because it has 2 energy lines that are higher than 1000 keV, which is well away from our lines of interest. The Co-60 marker was placed in front of the detector for roughly 1 min to ensure that a clear signal was present before continuing.
Detector Efficiencies
Calibration Method
Data/Error Analysis
LB Thesis Thin Window Analysis
Conclusion
Appendices
- Include arrays of plots similar to analysis pages?
- Include ROOT macros?
