Difference between revisions of "LB Thesis Theory Section"
| Line 7: | Line 7: | ||
[[File:170063 EnergySpectrumSample.png|200px]] | [[File:170063 EnergySpectrumSample.png|200px]] | ||
| − | Note that there will be many different isotopic decay lines present in the spectrum, but there are several methods to ensure that information about the isotope of interest can be found. The first step to proving that an isotope is present in the sample is to first look at the energy lines. Since each isotope has characteristic gamma decay lines, if the isotope is present, then those lines should be apparent in the spectrum (assuming the branching ratio is high enough that the lines don't get washed out in the background). Consider some isotope that has 3 large characteristic decay lines. If all of those 3 lines are present in the spectrum, then that would be a good indicator that the isotope is in the sample. Unfortunately more information is needed due to the fact that there are so many isotopes that 3 separate isotopes could produce lines close the energy lines of the isotope of interest, which produces a false positive. To strengthen the argument, multiple measurements can be made using the same sample to see how the rate of photons into the HpGe detector change with time. By finding how the number of counts seen by the HpGe detector change with time can be used to find the half life of the decay | + | Note that there will be many different isotopic decay lines present in the spectrum, but there are several methods to ensure that information about the isotope of interest can be found. The first step to proving that an isotope is present in the sample is to first look at the energy lines. Since each isotope has characteristic gamma decay lines, if the isotope is present, then those lines should be apparent in the spectrum (assuming the branching ratio is high enough that the lines don't get washed out in the background). Consider some isotope that has 3 large characteristic decay lines. If all of those 3 lines are present in the spectrum, then that would be a good indicator that the isotope is in the sample. Unfortunately more information is needed due to the fact that there are so many isotopes that 3 separate isotopes could produce lines close the energy lines of the isotope of interest, which produces a false positive. To strengthen the argument, multiple measurements can be made using the same sample to see how the rate of photons into the HpGe detector change with time. By finding how the number of counts seen by the HpGe detector change with time can be used to find the half life of the decay via the standard radioactive decay equation |
| + | |||
| + | <math> A_{Measured} = A_0 e^{-\lambda t} </math> | ||
==Neutron Knockout of Selenium== | ==Neutron Knockout of Selenium== | ||
Revision as of 18:03, 11 January 2018
PAA Theory
General PAA Method
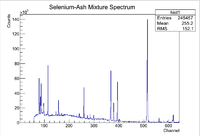
Photon activation analysis is a method used to analyze the isotopic composition of a sample by exploiting the characteristic decays of certain radioactive isotopes. The sample is activated using a Linear Accelerator (LINAC) which accelerates electrons that eventually hit an aluminum radiator that produces Bremsstrahlung radiation when the electrons slow down within the radiator. These Bremsstrahlung photons are then able to knock out nucleons from within the target nuclei in the sample of interest. After the nucleons have been removed from the nucleus, the nucleus becomes unstable and starts to undergo gamma decay. Nuclear gamma decay lines are characteristic to each isotope which can be used as a compositional fingerprint, but one must prove that energy lines of interest are indeed the assumed isotope. Typically High Purity Germanium Detectors are used to count the photons and create energy spectra for the sample of interest. A sample of a full energy spectrum as seen by the HpGe detector is shown below
Note that there will be many different isotopic decay lines present in the spectrum, but there are several methods to ensure that information about the isotope of interest can be found. The first step to proving that an isotope is present in the sample is to first look at the energy lines. Since each isotope has characteristic gamma decay lines, if the isotope is present, then those lines should be apparent in the spectrum (assuming the branching ratio is high enough that the lines don't get washed out in the background). Consider some isotope that has 3 large characteristic decay lines. If all of those 3 lines are present in the spectrum, then that would be a good indicator that the isotope is in the sample. Unfortunately more information is needed due to the fact that there are so many isotopes that 3 separate isotopes could produce lines close the energy lines of the isotope of interest, which produces a false positive. To strengthen the argument, multiple measurements can be made using the same sample to see how the rate of photons into the HpGe detector change with time. By finding how the number of counts seen by the HpGe detector change with time can be used to find the half life of the decay via the standard radioactive decay equation
