Difference between revisions of "2NCorr SP DP analysis"
Jump to navigation
Jump to search
| Line 3: | Line 3: | ||
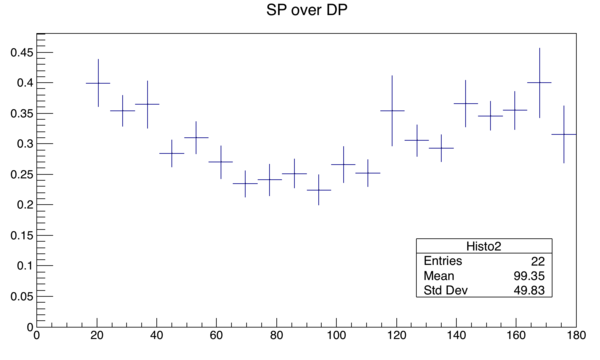
Simply dividing SP distribution by DP distribution from DU produces the following plot: | Simply dividing SP distribution by DP distribution from DU produces the following plot: | ||
| − | [[File:2NCorrSP Over DP DU.png| | + | [[File:2NCorrSP Over DP DU.png|600px]] |
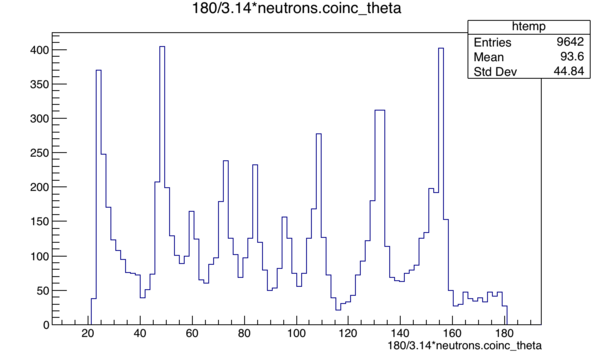
Acceptance plot for different pulses | Acceptance plot for different pulses | ||
| − | [[File:2Ncorr Acceptance.png| | + | [[File:2Ncorr Acceptance.png|600px]] |
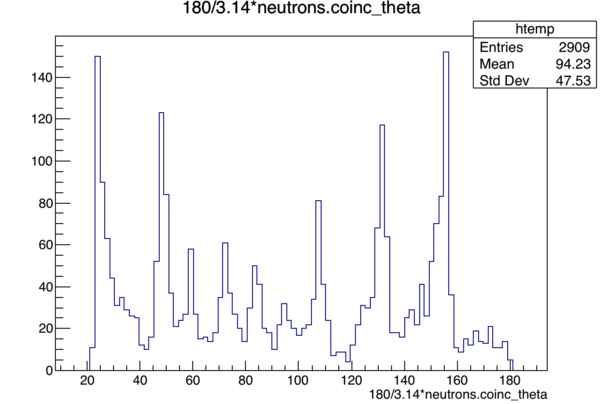
Acceptance plot for same pulses | Acceptance plot for same pulses | ||
| − | [[File:2NCorrAcceptance SP.png| | + | [[File:2NCorrAcceptance SP.png|600px]] |
Revision as of 18:33, 7 December 2017
Simply dividing SP distribution by DP distribution from DU produces the following plot:
Acceptance plot for different pulses
Acceptance plot for same pulses


