Difference between revisions of "PMT Linearity"
Jump to navigation
Jump to search
| Line 4: | Line 4: | ||
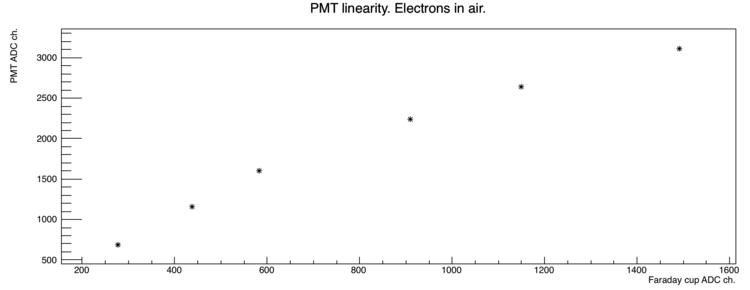
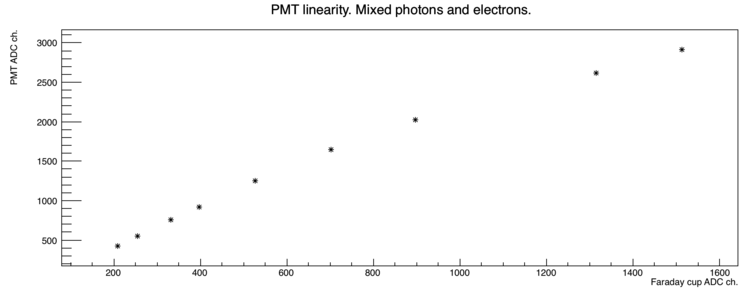
The error bars in the plots below are too small to be seen. Error is calculated by <math>\frac{\sigma}{\sqrt{NumCounts}}</math>. | The error bars in the plots below are too small to be seen. Error is calculated by <math>\frac{\sigma}{\sqrt{NumCounts}}</math>. | ||
| − | [[File:PMTLinearity Electrons.png| | + | [[File:PMTLinearity Electrons.png|750px]] |
| − | [[File:PMTLinearity PhtnsPlusElectrons.png| | + | [[File:PMTLinearity PhtnsPlusElectrons.png|750px]] |
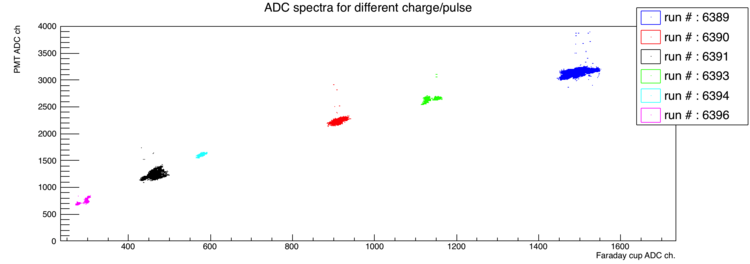
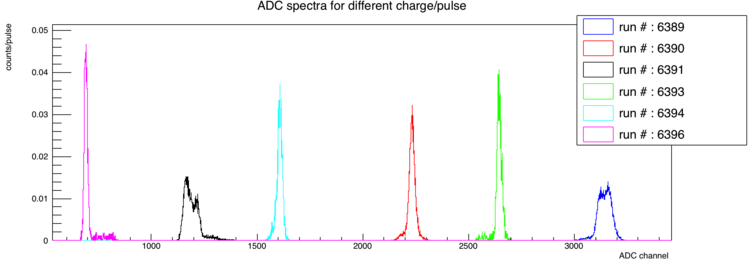
These plots below are from electrons in air. | These plots below are from electrons in air. | ||
| − | [[File:ADC_SpectraUnderDiffChargePerPulse(2D).png| | + | [[File:ADC_SpectraUnderDiffChargePerPulse(2D).png|750px]] |
| − | [[File:ADC SpectraUnderDiffChargePerPulse.png| | + | [[File:ADC SpectraUnderDiffChargePerPulse.png|750px]] |
Revision as of 18:54, 1 June 2017
PMT Linearity
The error bars in the plots below are too small to be seen. Error is calculated by .
These plots below are from electrons in air.


