Difference between revisions of "Plotting Different Frames"
| Line 375: | Line 375: | ||
<center>[[File:x2y2plane.png]]</center> | <center>[[File:x2y2plane.png]]</center> | ||
| + | |||
| + | |||
| + | The point that was the semi-major vertex, when rotated 6\[Degree] to the right becomes | ||
| + | |||
| + | <pre> | ||
| + | In[1603]:= rFromYtoX.{1.6831832367824053`, 0, 0} // MatrixForm | ||
| + | |||
| + | Out[1603]//MatrixForm= \!\( | ||
| + | TagBox[ | ||
| + | RowBox[{"(", "", | ||
| + | TagBox[GridBox[{ | ||
| + | {"1.6739625828969429`"}, | ||
| + | {"0.17594055713873974`"}, | ||
| + | {"0.`"} | ||
| + | }, | ||
| + | GridBoxAlignment->{ | ||
| + | "Columns" -> {{Center}}, "ColumnsIndexed" -> {}, | ||
| + | "Rows" -> {{Baseline}}, "RowsIndexed" -> {}}, | ||
| + | GridBoxSpacings->{"Columns" -> { | ||
| + | Offset[0.27999999999999997`], { | ||
| + | Offset[0.5599999999999999]}, | ||
| + | Offset[0.27999999999999997`]}, "ColumnsIndexed" -> {}, "Rows" -> { | ||
| + | Offset[0.2], { | ||
| + | Offset[0.4]}, | ||
| + | Offset[0.2]}, "RowsIndexed" -> {}}], | ||
| + | Column], "", ")"}], | ||
| + | Function[BoxForm`e$, | ||
| + | MatrixForm[BoxForm`e$]]]\) | ||
| + | </pre> | ||
| + | |||
| + | |||
| + | Solving for the ellipse parameter given the angle and the corresponding X'' and Y'' components | ||
| + | |||
| + | |||
| + | <pre> | ||
| + | X = 1.6739625828969429`; | ||
| + | Y = 0.17594055713873974`; | ||
| + | \[Theta] = 40; | ||
| + | t = t /. Solve[ | ||
| + | X^2 (Cos[6 \[Degree]])^2 + | ||
| + | Y^2 (Sin[6 \[Degree]])^2 + \[CapitalDelta]a^2 + | ||
| + | 2 X Y Cos[6 \[Degree]] Sin[6 \[Degree]] + | ||
| + | 2 X \[CapitalDelta]a Cos[6 \[Degree]] + | ||
| + | 2 Y \[CapitalDelta]a Sin[6 \[Degree]] + | ||
| + | X^2 (Sin[6 \[Degree]])^2 + Y^2 (Cos[6 \[Degree]])^2 - | ||
| + | 2 X Y Sin[6 \[Degree]] Cos[6 \[Degree]] == | ||
| + | a^2 (Cos[t])^2 (Cos[6 \[Degree]])^2 + | ||
| + | b^2 (Sin[t])^2 (Sin[6 \[Degree]])^2 + \[CapitalDelta]a^2 + | ||
| + | 2 a b Cos[t] Cos[6 \[Degree]] Sin[t] Sin[6 \[Degree]] + | ||
| + | 2 a \[CapitalDelta]a Cos[t] Cos[6 \[Degree]] + | ||
| + | 2 b \[CapitalDelta]a Sin[t] Sin[6 \[Degree]] + | ||
| + | a^2 (Cos[t])^2 (Sin[6 \[Degree]])^2 + | ||
| + | b^2 (Sin[t])^2 (Cos[6 \[Degree]])^2 - | ||
| + | 2 a b Cos[t] Sin[6 \[Degree]] Cos[6 \[Degree]] Sin[t], t] | ||
| + | ClearAll[X, Y, \[Theta]]; | ||
| + | </pre> | ||
| + | |||
| + | |||
| + | <pre>{-1.31406, 1.4676, 3.06482 - 1.66742 I, 3.06482 + 1.66742 I}</pre> | ||
| + | |||
| + | We can see that at the vertex position, the parameter reaches it's minimum at 1.4676. This point reflects the right and left sides of the ellipse and the corresponding decreases in wire number as the parameter is increased. | ||
Revision as of 20:58, 3 May 2017
We can define different arrays to collect the coordinates in the different frames using a passive transformation. Assuming that the intersection of the ellipse and sense wires is in the y-x plane, we will have a positive rotation,
rFromYtoX = ( {
    {Cos[6 \[Degree]], -Sin[6 \[Degree]], 0},
    {Sin[6 \[Degree]], Cos[6 \[Degree]], 0},
    {0, 0, 1}
   } );
rFromXtoY = ( {
    {Cos[6 \[Degree]], Sin[6 \[Degree]], 0},
    {-Sin[6 \[Degree]], Cos[6 \[Degree]], 0},
    {0, 0, 1}
   } );
yxPoints = constant\[Theta];
constant\[Theta]yx = constant\[Theta];
constant\[Theta]yxRotated = constant\[Theta];
constant\[Theta]xyz = constant\[Theta];
constant\[Theta]xyzRotated = constant\[Theta];

RowLengths = Table[{Nothing}, {i, 1, 36}];
For[rows = 1, rows < 37, rows++,
  RowLengths[[rows]] = Length[constant\[Theta][[rows]]];
  For[columns = 1, columns < RowLengths[[rows]] + 1, columns++,
   \[Theta] = rows + 4;
   \[Phi] = constant\[Theta][[rows, columns, 1]];
   constant\[Theta]yx[[rows, columns]] = {y,
     Sqrt[a^2 (1 - y^2/b^2)] - \[CapitalDelta]a};
   constant\[Theta]xyz[[rows,
     columns]] = {constant\[Theta]yx[[rows, columns, 2]],
     constant\[Theta]yx[[rows, columns, 1]], 0};
   If[constant\[Theta][[rows, columns, 1]] < 0,
    constant\[Theta]yx[[rows, columns,
      1]] = -constant\[Theta]yx[[rows, columns, 1]];
    constant\[Theta]xyz[[rows, columns,
      2]] = -constant\[Theta]xyz[[rows, columns, 2]];
    ];
   constant\[Theta]xyzRotated[[rows, columns]] =
    rFromYtoX.{constant\[Theta]xyz[[rows, columns, 1]],
      constant\[Theta]xyz[[rows, columns, 2]],
      constant\[Theta]xyz[[rows, columns, 3]]};

   constant\[Theta]yxRotated[[rows,
     columns]] = {constant\[Theta]xyzRotated[[rows, columns, 2]],
     constant\[Theta]xyzRotated[[rows, columns, 1]]};
   yxPoints[[rows, columns]] = {y,
     Sqrt[a^2 (1 - y^2/b^2)] - \[CapitalDelta]a,
     constant\[Theta][[rows, columns, 1]],
     constant\[Theta][[rows, columns, 2]]};

   ]
  ];
ClearAll[\[Theta], \[Phi]];
DesiredyxPoints = Desiredconstant\[Theta];
Desiredconstant\[Theta]yx = Desiredconstant\[Theta];
Desiredconstant\[Theta]yxRotated = Desiredconstant\[Theta];
Desiredconstant\[Theta]xyz = Desiredconstant\[Theta];
Desiredconstant\[Theta]xyzRotated = Desiredconstant\[Theta];

DesiredRowLengths = Table[{Nothing}, {i, 1, 36}];
For[rows = 1, rows < 37, rows++,
  DesiredRowLengths[[rows]] =
   Length[Desiredconstant\[Theta][[rows]]];
  For[columns = 1, columns < DesiredRowLengths[[rows]] + 1,
   columns++,
   \[Theta] = rows + 4;
   \[Phi] = Desiredconstant\[Theta][[rows, columns, 1]];
   Desiredconstant\[Theta]yx[[rows, columns]] = {y,
     Sqrt[a^2 (1 - y^2/b^2)] - \[CapitalDelta]a};
   Desiredconstant\[Theta]xyz[[rows,
      columns]] = {Desiredconstant\[Theta]yx[[rows, columns, 2]],
     Desiredconstant\[Theta]yx[[rows, columns, 1]], 0};
   If[Desiredconstant\[Theta][[rows, columns, 1]] < 0,
    Desiredconstant\[Theta]yx[[rows, columns,
       1]] = -Desiredconstant\[Theta]yx[[rows, columns, 1]];
    Desiredconstant\[Theta]xyz[[rows, columns,
       2]] = -Desiredconstant\[Theta]xyz[[rows, columns, 2]];
    ];
   Desiredconstant\[Theta]xyzRotated[[rows, columns]] =
    rFromYtoX.{Desiredconstant\[Theta]xyz[[rows, columns, 1]],
      Desiredconstant\[Theta]xyz[[rows, columns, 2]],
      Desiredconstant\[Theta]xyz[[rows, columns, 3]]};

   Desiredconstant\[Theta]yxRotated[[rows,
      columns]] = {Desiredconstant\[Theta]xyzRotated[[rows, columns,
       2]], Desiredconstant\[Theta]xyzRotated[[rows, columns, 1]]};
   DesiredyxPoints[[rows, columns]] = {y,
     Sqrt[a^2 (1 - y^2/b^2)] - \[CapitalDelta]a,
     Desiredconstant\[Theta][[rows, columns, 1]],
     Desiredconstant\[Theta][[rows, columns, 2]]};

   ]
  ];
ClearAll[\[Theta], \[Phi]]
The parameter's range changes from the DC frame with 0<t<2, since
In the frame of the wires, the x axis no longer is aligned with the semi-major axis, therefore for in the DC frame
In[153]:= ClearAll[X, \[Theta]];
\[Theta] = 40;
X = X /. Solve[(X + \[CapitalDelta]a)^2/a^2 == 1 && X > 0, X]

Out[155]= {1.68318}
This gives the (x' , y')=(1.68318, 0) in the DC frame for
The center of the ellipse in the DC frame becomes
In[157]:= rFromYtoX.{\[CapitalDelta]a, 0, 0} // MatrixForm

Out[157]//MatrixForm= \!\(
TagBox[
RowBox[{"(", "",
TagBox[GridBox[{
{"1.0760024073650314`"},
{"0.11309241017012851`"},
{"0.`"}
},
GridBoxAlignment->{
       "Columns" -> {{Center}}, "ColumnsIndexed" -> {},
        "Rows" -> {{Baseline}}, "RowsIndexed" -> {}},
GridBoxSpacings->{"Columns" -> {
Offset[0.27999999999999997`], {
Offset[0.5599999999999999]},
Offset[0.27999999999999997`]}, "ColumnsIndexed" -> {}, "Rows" -> {
Offset[0.2], {
Offset[0.4]},
Offset[0.2]}, "RowsIndexed" -> {}}],
Column], "", ")"}],
Function[BoxForm`e$,
MatrixForm[BoxForm`e$]]]\)
Likewise the position where the semi-major axis is reached on the x' axis becomes
In[158]:= rFromYtoX.{1.6831832367824053`, 0, 0} // MatrixForm

Out[158]//MatrixForm= \!\(
TagBox[
RowBox[{"(", "",
TagBox[GridBox[{
{"1.6739625828969429`"},
{"0.17594055713873974`"},
{"0.`"}
},
GridBoxAlignment->{
       "Columns" -> {{Center}}, "ColumnsIndexed" -> {},
        "Rows" -> {{Baseline}}, "RowsIndexed" -> {}},
GridBoxSpacings->{"Columns" -> {
Offset[0.27999999999999997`], {
Offset[0.5599999999999999]},
Offset[0.27999999999999997`]}, "ColumnsIndexed" -> {}, "Rows" -> {
Offset[0.2], {
Offset[0.4]},
Offset[0.2]}, "RowsIndexed" -> {}}],
Column], "", ")"}],
Function[BoxForm`e$,
MatrixForm[BoxForm`e$]]]\)
The slope m, with respect to x, is found as=9.514
Slope point form gives
SemiMajorAxis =
  ContourPlot[Y == 0, {Y, -1, 1}, {X, 0, 1.8},
   Frame -> {True, True, False, False},
       PlotLabel ->
    "Right side limit of DC as a function of X and Y",
   FrameLabel -> {"y (meters)", "x (meters)"}, ContourStyle -> Red,
       PlotLegends -> Automatic];
SemiMajorAxisRotated =
  ContourPlot[X == 9.614 Y, {Y, -2, 2}, {X, 0, 1.8},
   Frame -> {True, True, False, False},
       PlotLabel ->
    "Right side limit of DC as a function of X and Y",
   FrameLabel -> {"y (meters)", "x (meters)"}, ContourStyle -> Blue,
       PlotLegends -> Automatic];
The center
In[161]:= rFromXtoY.{\[CapitalDelta]a, 0, 0} // MatrixForm

Out[161]//MatrixForm= \!\(
TagBox[
RowBox[{"(", "",
TagBox[GridBox[{
{"1.0760024073650314`"},
{
RowBox[{"-", "0.11309241017012851`"}]},
{"0.`"}
},
GridBoxAlignment->{
       "Columns" -> {{Center}}, "ColumnsIndexed" -> {},
        "Rows" -> {{Baseline}}, "RowsIndexed" -> {}},
GridBoxSpacings->{"Columns" -> {
Offset[0.27999999999999997`], {
Offset[0.5599999999999999]},
Offset[0.27999999999999997`]}, "ColumnsIndexed" -> {}, "Rows" -> {
Offset[0.2], {
Offset[0.4]},
Offset[0.2]}, "RowsIndexed" -> {}}],
Column], "", ")"}],
Function[BoxForm`e$,
MatrixForm[BoxForm`e$]]]\)
The vertex
In[162]:= rFromXtoY.{1.6831832367824053`, 0, 0} // MatrixForm

Out[162]//MatrixForm= \!\(
TagBox[
RowBox[{"(", "",
TagBox[GridBox[{
{"1.6739625828969429`"},
{
RowBox[{"-", "0.17594055713873974`"}]},
{"0.`"}
},
GridBoxAlignment->{
       "Columns" -> {{Center}}, "ColumnsIndexed" -> {},
        "Rows" -> {{Baseline}}, "RowsIndexed" -> {}},
GridBoxSpacings->{"Columns" -> {
Offset[0.27999999999999997`], {
Offset[0.5599999999999999]},
Offset[0.27999999999999997`]}, "ColumnsIndexed" -> {}, "Rows" -> {
Offset[0.2], {
Offset[0.4]},
Offset[0.2]}, "RowsIndexed" -> {}}],
Column], "", ")"}],
Function[BoxForm`e$,
MatrixForm[BoxForm`e$]]]\)
The slope m, with respect to x, is found as
Slope point form gives
SemiMajorAxisRotatedReverse =
  ContourPlot[X == -9.514 Y, {Y, -2, 2}, {X, 0, 1.8},
   Frame -> {True, True, False, False},
       PlotLabel ->
    "Right side limit of DC as a function of X and Y",
   FrameLabel -> {"y (meters)", "x (meters)"},
   ContourStyle -> Green,
       PlotLegends -> Automatic];
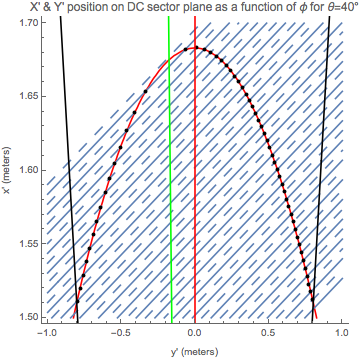
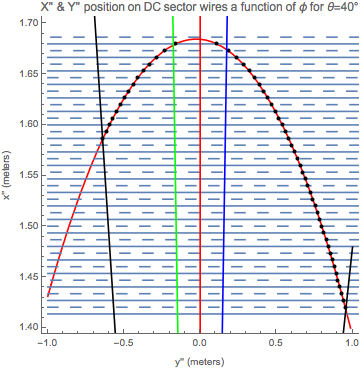
Graphing the frame of the sector and the wires within the sector,
DataXY = Table[
   ListPlot[{constant\[Theta]yx[[i]]}, PlotStyle -> Black,
    AxesLabel -> {"y", "x"},
    PlotLabel ->
     "DC Wire for Constant \[Theta] as a Function of \[Phi]"], {i, 1,
    36}];
DataXYRotated =
  Table[ListPlot[{constant\[Theta]yxRotated[[i]]}, PlotStyle -> Black,
     AxesLabel -> {"y'", "x'"},
    PlotLabel ->
     "DC Wire for Constant \[Theta] as a Function of \[Phi]"],
   {i, 1, 36}];
DesiredDataXY =
  Table[ListPlot[{Desiredconstant\[Theta]yx[[i]]}, PlotStyle -> Black,
     AxesLabel -> {"y", "x"},
    PlotLabel ->
     "DC Wire for Constant \[Theta] as a Function of \[Phi]"], {i, 1,
    36}];
DesiredDataXYRotated =
  Table[ListPlot[{Desiredconstant\[Theta]yxRotated[[i]]},
    PlotStyle -> Black, AxesLabel -> {"y'", "x'"},
    PlotLabel ->
     "DC Wire for Constant \[Theta] as a Function of \[Phi]"],
   {i, 1, 36}];
ClearAll[\[Theta]];
\[Theta] = 40;
ellipse40 =
  ContourPlot[(x + \[CapitalDelta]a)^2/a^2 + y^2/b^2 == 1, {y, -1,
    1}, {x, 1.5, 1.7}, Frame -> {True, True, False, False},
   PlotLabel ->
    "X' & Y' position on DC sector plane as a function of \[Phi] for \
\[Theta]=40\[Degree]", FrameLabel -> {"y' (meters)", "x' (meters)"},
   ContourStyle -> Red, PlotLegends -> Automatic];
ellipse40Rotated =
  ContourPlot[(X Cos[6 \[Degree]] +
       Y Sin[6 \[Degree]] + \[CapitalDelta]a)^2/
     a^2 + (-X Sin[6 \[Degree]] + Y Cos[6 \[Degree]])^2/b^2 ==
    1, {Y, -1, 1}, {X, 1.4, 1.7}, Frame -> {True, True, False, False},
    PlotLabel ->
    "X'' & Y'' position on DC sector wires a function of \[Phi] for \
\[Theta]=40\[Degree]", FrameLabel -> {"y'' (meters)", "x'' (meters)"},
    ContourStyle -> Red, PlotLegends -> Automatic];
Show[ellipse40,
 Table[ContourPlot[
   xWire == Tan[6 \[Degree]] yWire + x0forWires[number], {yWire, -1,
    1}, {xWire, 1.5, 1.7},
   FrameLabel -> {"y(meters)", "x(meters)"}], {number, 89, 109}],
 Table[ContourPlot[
   xWire ==
    Tan[6 \[Degree]] yWire + x0forWireMiddles[number2], {yWire, -1,
    1}, {xWire, 1.5, 1.7},
   ContourStyle -> {Dashing[Large]}], {number2, 89, 109}],
 DataXY[[36]],
 DesiredDataXY[[36]], left, right, SemiMajorAxis, \
SemiMajorAxisRotatedReverse]
Show[ellipse40Rotated,
 Table[ContourPlot[
   xWire == Cos[6 \[Degree]] x0forWires[number], {yWire, -1,
    1.2}, {xWire, 1.4, 1.7},
   FrameLabel -> {"y(meters)", "x(meters)"}], {number, 89, 109}],
 Table[ContourPlot[
   xWire == Cos[6 \[Degree]] x0forWireMiddles[number2], {yWire, -1,
    1.2}, {xWire, 1.4, 1.7},
   ContourStyle -> {Dashing[Large]}], {number2, 89, 109}],
 DataXYRotated[[36]],
 DesiredDataXYRotated[[36]], rightRotated, leftRotated, \
SemiMajorAxisRotated, SemiMajorAxis, SemiMajorAxisRotatedReverse]
ClearAll[\[Theta]];


The point that was the semi-major vertex, when rotated 6\[Degree] to the right becomes
In[1603]:= rFromYtoX.{1.6831832367824053`, 0, 0} // MatrixForm

Out[1603]//MatrixForm= \!\(
TagBox[
RowBox[{"(", "",
TagBox[GridBox[{
{"1.6739625828969429`"},
{"0.17594055713873974`"},
{"0.`"}
},
GridBoxAlignment->{
       "Columns" -> {{Center}}, "ColumnsIndexed" -> {},
        "Rows" -> {{Baseline}}, "RowsIndexed" -> {}},
GridBoxSpacings->{"Columns" -> {
Offset[0.27999999999999997`], {
Offset[0.5599999999999999]},
Offset[0.27999999999999997`]}, "ColumnsIndexed" -> {}, "Rows" -> {
Offset[0.2], {
Offset[0.4]},
Offset[0.2]}, "RowsIndexed" -> {}}],
Column], "", ")"}],
Function[BoxForm`e$,
MatrixForm[BoxForm`e$]]]\)
Solving for the ellipse parameter given the angle and the corresponding X and Y components
X = 1.6739625828969429`;
Y = 0.17594055713873974`;
\[Theta] = 40;
t = t /. Solve[
   X^2 (Cos[6 \[Degree]])^2 +
     Y^2 (Sin[6 \[Degree]])^2 + \[CapitalDelta]a^2 +
     2 X Y Cos[6 \[Degree]] Sin[6 \[Degree]] +
     2 X \[CapitalDelta]a Cos[6 \[Degree]] +
     2 Y \[CapitalDelta]a Sin[6 \[Degree]] +
     X^2 (Sin[6 \[Degree]])^2 + Y^2 (Cos[6 \[Degree]])^2 -
     2 X Y Sin[6 \[Degree]] Cos[6 \[Degree]] ==
    a^2 (Cos[t])^2 (Cos[6 \[Degree]])^2 +
     b^2 (Sin[t])^2 (Sin[6 \[Degree]])^2 + \[CapitalDelta]a^2 +
     2 a b Cos[t] Cos[6 \[Degree]] Sin[t] Sin[6 \[Degree]] +
     2 a \[CapitalDelta]a Cos[t] Cos[6 \[Degree]] +
     2 b \[CapitalDelta]a Sin[t] Sin[6 \[Degree]] +
     a^2 (Cos[t])^2 (Sin[6 \[Degree]])^2 +
     b^2 (Sin[t])^2 (Cos[6 \[Degree]])^2 -
     2 a b Cos[t] Sin[6 \[Degree]] Cos[6 \[Degree]] Sin[t], t]
ClearAll[X, Y, \[Theta]];
{-1.31406, 1.4676, 3.06482 - 1.66742 I, 3.06482 + 1.66742 I}
We can see that at the vertex position, the parameter reaches it's minimum at 1.4676. This point reflects the right and left sides of the ellipse and the corresponding decreases in wire number as the parameter is increased.