Difference between revisions of "LB RunGroupC Vertex"
| Line 124: | Line 124: | ||
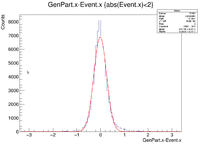
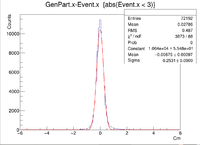
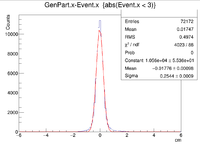
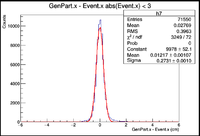
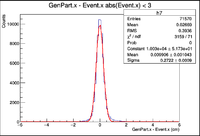
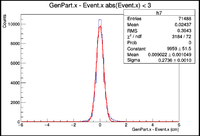
|| Vx Difference (cm) || [[File:0.5ZTarg VxDiff.png|200px]] || [[File:1cmZTarg VxDiff.png|200px]] || ** || [[File:3cmZTarg VxDiff.png|200px]] || [[File:4cmZTarg VxDiff.png|200px]] || [[File:5cmZTarg VxDiff.png|200px]] || | || Vx Difference (cm) || [[File:0.5ZTarg VxDiff.png|200px]] || [[File:1cmZTarg VxDiff.png|200px]] || ** || [[File:3cmZTarg VxDiff.png|200px]] || [[File:4cmZTarg VxDiff.png|200px]] || [[File:5cmZTarg VxDiff.png|200px]] || | ||
|- | |- | ||
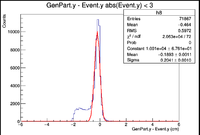
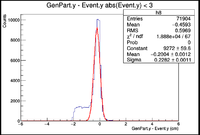
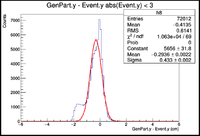
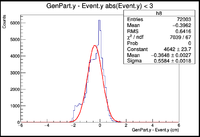
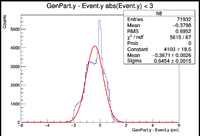
| − | || Vy Difference (cm) || [[File:0.5ZTarg VyDiff.png|200px]] || [[File:1cmZTarg VyDiff.png|200px]] || ** || [[File:3cmZTarg VyDiff.png|200px]] || [[File:4cmZTarg VyDiff.png|200px]] || | + | || Vy Difference (cm) || [[File:0.5ZTarg VyDiff.png|200px]] || [[File:1cmZTarg VyDiff.png|200px]] || ** || [[File:3cmZTarg VyDiff.png|200px]] || [[File:4cmZTarg VyDiff.png|200px]] || [[File:5cmZTarg VyDiff.png|200px]] || |
|- | |- | ||
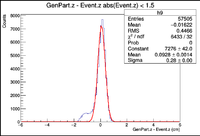
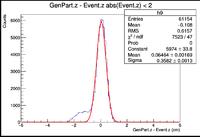
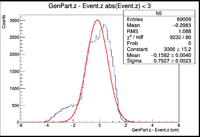
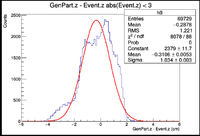
|| Vz Difference (cm) || [[File:0.5ZTarg VzDiff.png|200px]] || [[ File:1cmZTarg VzDiff.png|200px]]|| ** || [[File:3cmZTarg VzDiff.png|200px]] || [[ File:4cmZTarg VzDiff.png|200px]] || | || Vz Difference (cm) || [[File:0.5ZTarg VzDiff.png|200px]] || [[ File:1cmZTarg VzDiff.png|200px]]|| ** || [[File:3cmZTarg VzDiff.png|200px]] || [[ File:4cmZTarg VzDiff.png|200px]] || | ||
Revision as of 18:50, 25 July 2016
Vertex Reconstruction studies
Inclusive electron GEMC 2.4 & Coatjava 2.4
Summary
Set all histogram ranges to -6,6 cm and bin sizes of 0.1 cm
Point target X,Y,Z=0 cm
| No Rastering | |
|---|---|
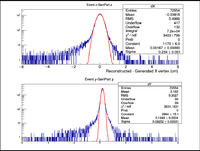
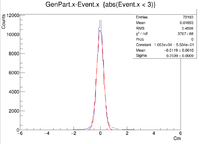
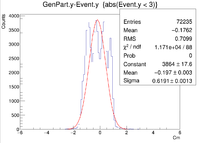
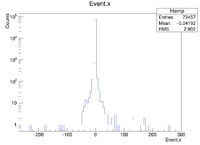
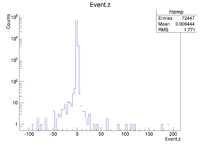
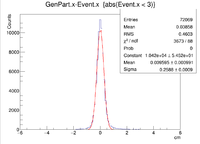
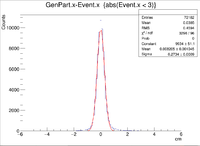
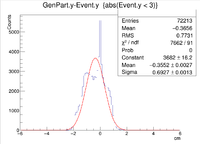
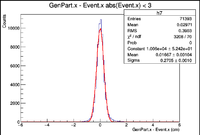
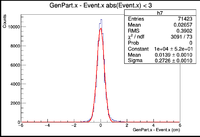
| Vx Difference | 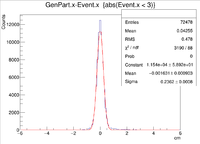
|
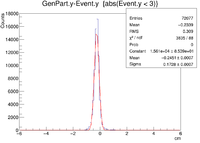
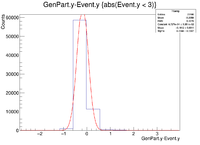
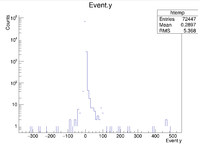
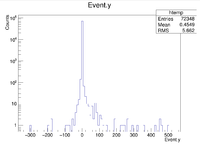
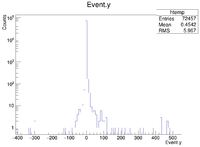
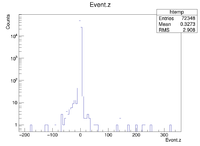
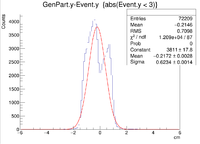
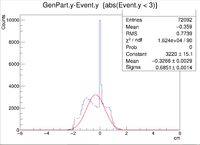
| Vy Difference | 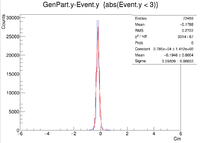
|
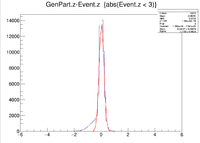
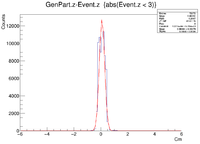
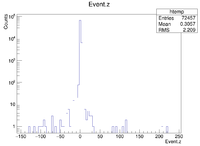
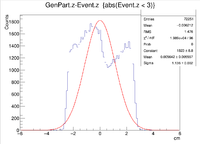
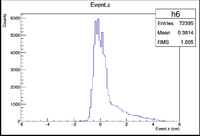
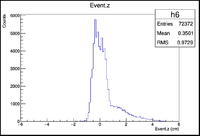
| Vz Difference | 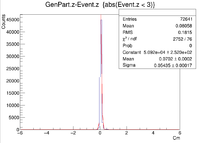
|
| X Resolution (cm) | 0.2362 |
| Y Resolution(cm) | 0.09809 |
| Z Resolution (cm) | 0.05435 |
These histograms raise some questions. To begin I created a LUND file with 6 GeV incident electrons at 25 degrees in theta and 0 degrees in phi. All of the vertex positions were set to 0. I then ran GEMC 2.4 using the command line ~/src/CLAS/GEMC/source/gemc -USE_GUI=0 -INPUT_GEN_FILE="LUND,No_Raster.LUND" -N=75000 eg12_sol_No_Raster.gcard
which created an output file called eg12_sol_75k_No_Raster.ev. After that the reconstruction command line used was
~/src/CLAS/coatjava-2.4/bin/clas12-reconstruction -i eg12_sol_75k_No_Raster.ev-config GEOM::new=true -config MAG::torus=-1.0 -config MAG::solenoid=1.0 -o eg12_sol_75k_No_Raster_rec.evio -s DCHB:DCTB:EC:FTOF:EB -config DATA::mc=true -config DCTB::useRaster=true
After the reconstruction a root file was created using
~/src/CLAS/evio2root/bin/evio2root eg12_sol_75k_No_Raster_rec.evio eg12_sol_75k_No_Raster_rec.root 75000
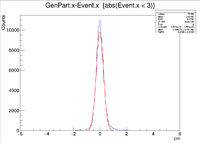
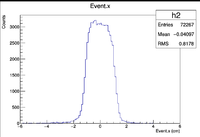
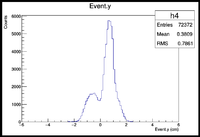
A plot was then created to show the X Vertex and Y Vertex Differences
The first question is why is there a shift in the Y Difference. What would make X more centered around 0? The next question is when rastering begins, why do the resolutions in the X Vertices remain unchanged while the resolutions in the Y Vertices change?
Point in 2-D but extended target in 1-D
Two vertex variables are fixed at zero and the third vertex variable is altered
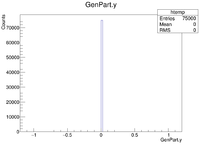
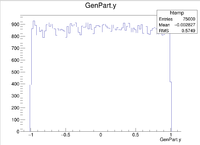
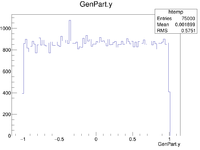
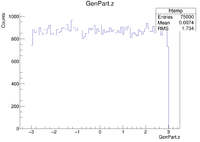
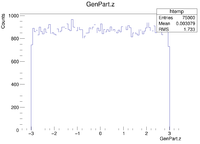
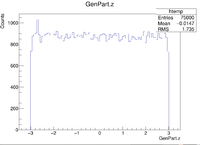
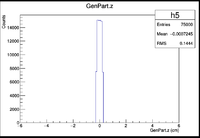
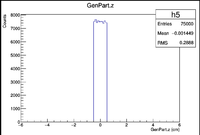
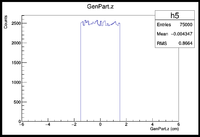
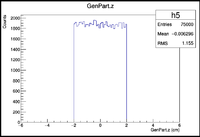
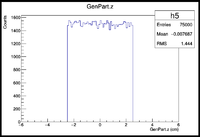
Extended target -3 < Z < 3 cm
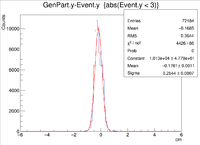
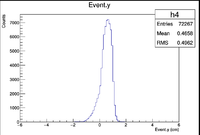
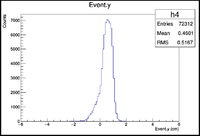
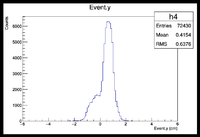
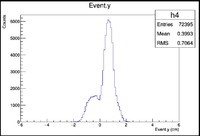
Extended target in Z. Vy shift analysis
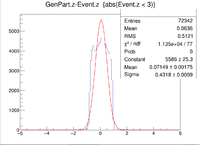
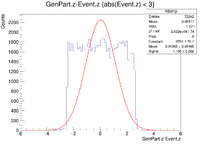
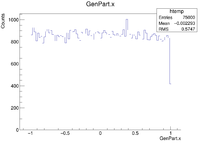
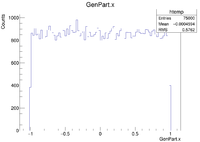
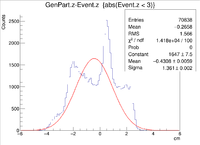
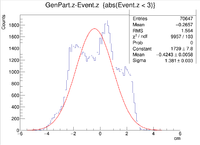
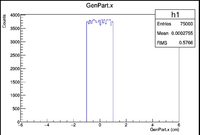
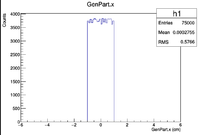
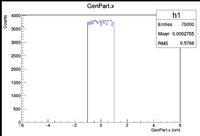
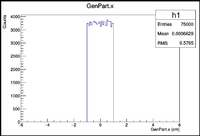
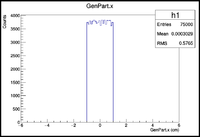
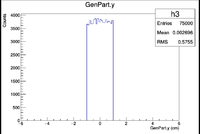
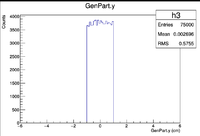
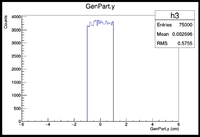
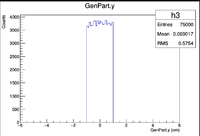
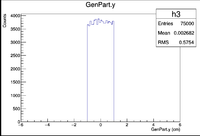
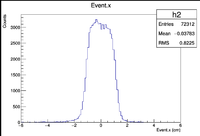
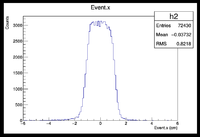
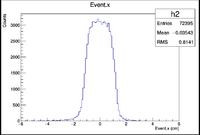
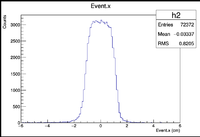
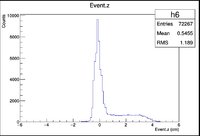
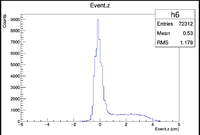
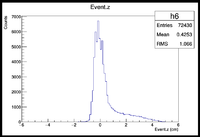
All Histograms below were created by simply making the target longer along the Z axis. Each case uses vertex points for X and Y ranging from -1cm to 1cm
Elastic electron proton GEMC 2.4 & Coatjava 2.4
References
https://clasweb.jlab.org/wiki/index.php/TF_EG12_Vertex#Z_resolution_With_micro-megas
