Difference between revisions of "LB RunGroupC Vertex"
Jump to navigation
Jump to search
| Line 12: | Line 12: | ||
[[File:eVyDiffCuts.jpg]] | [[File:eVyDiffCuts.jpg]] | ||
| + | |||
| + | Now I will show the histograms for the difference between the simulated and the reconstructed vertex positions for the proton | ||
| + | |||
| + | Histogram for Vx Differences | ||
| + | |||
| + | [[File:pVxDiffCuts.jpg]] | ||
=References= | =References= | ||
Revision as of 18:59, 20 July 2015
Vertex Reconstruction studies
Electron Vertex reconstruction
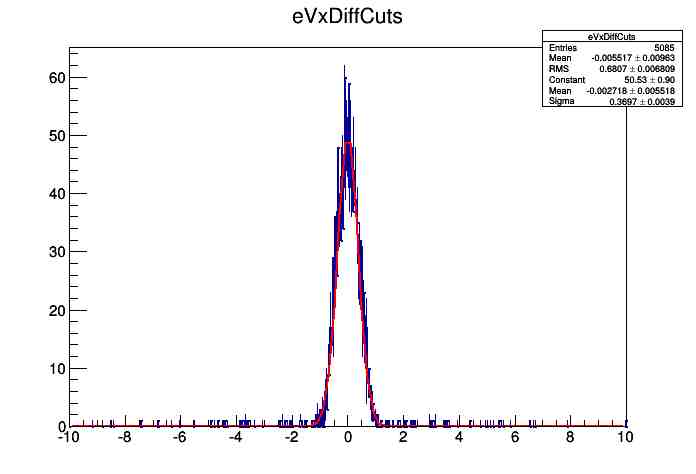
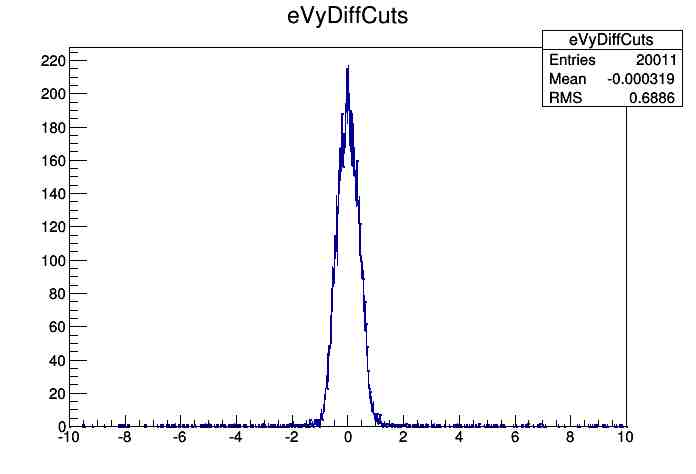
Here are the plots of differences between the simulated x, y, and z vertex positions and the reconstructed vertex positions for a 2cm target. Each histogram corresponds to a difference in the matching coordinate i.e. Simulated Vx - Reconstructed Vx
Histogram for Vx Differences
Histogram for Vy Differences
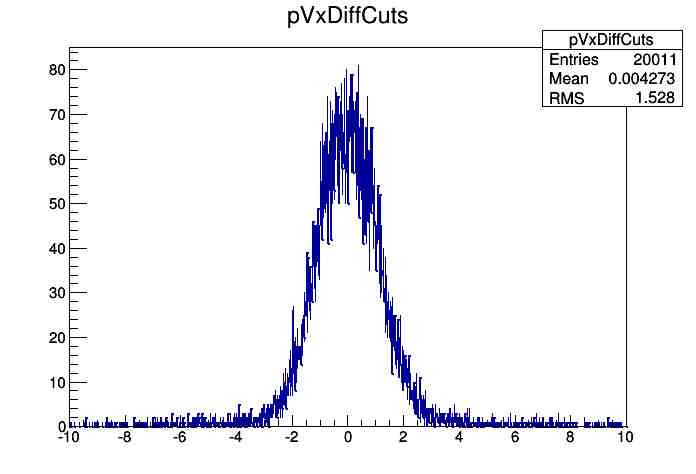
Now I will show the histograms for the difference between the simulated and the reconstructed vertex positions for the proton
Histogram for Vx Differences
References
https://clasweb.jlab.org/wiki/index.php/TF_EG12_Vertex#Z_resolution_With_micro-megas


