Difference between revisions of "Neutron Corr"
| Line 1: | Line 1: | ||
| + | =Using the 44 MeV machine= | ||
| + | |||
| + | [[2nCor_44]] | ||
| + | |||
| + | =Using the HRRL= | ||
| + | |||
| + | [[nCorr_HRRL]] | ||
| + | |||
[https://wiki.iac.isu.edu/index.php/HRRL Go Back] | [https://wiki.iac.isu.edu/index.php/HRRL Go Back] | ||
| − | =8/13/2012= | + | ==8/13/2012== |
Revision as of 17:10, 12 March 2015
Using the 44 MeV machine
Using the HRRL
8/13/2012
http://www.hamamatsu.com/resources/pdf/etd/R580_TPMH1100E.pdf
First Results
8/14/2012
Gun/RF Tests
8/15/2012
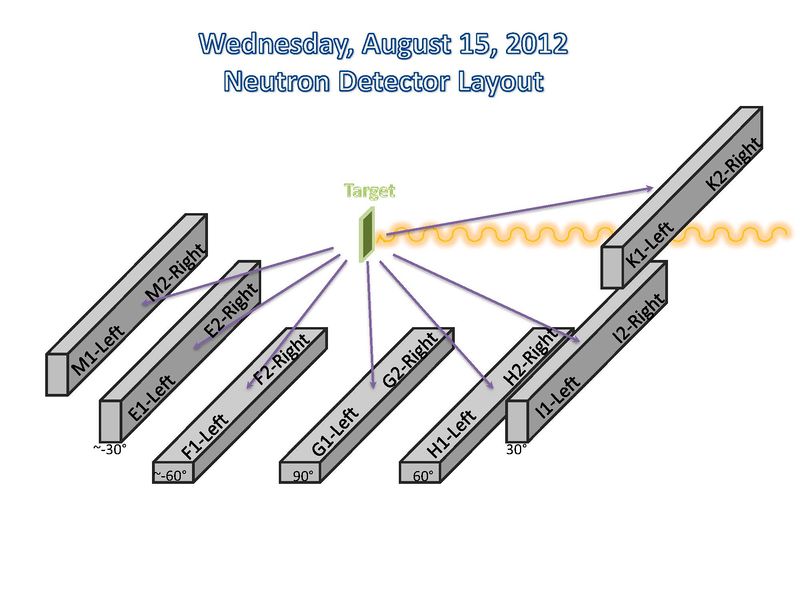
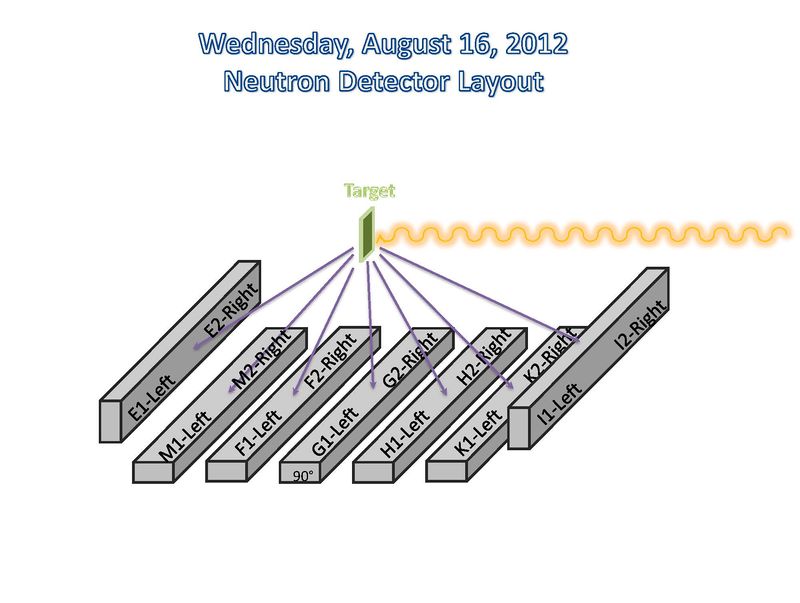
Neutron Detector Layout
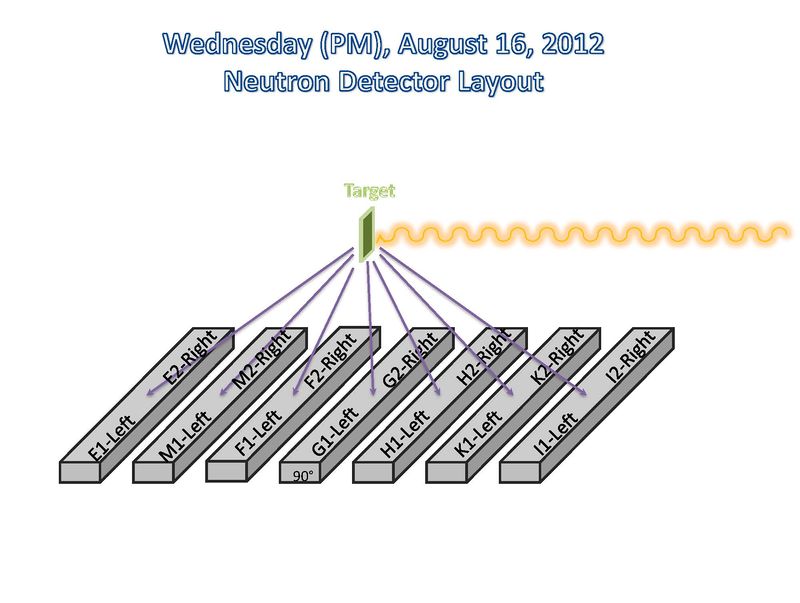
8/16/2012
Neutron Detector Layout(morning)
Neutron Detector Layout(afternoon)
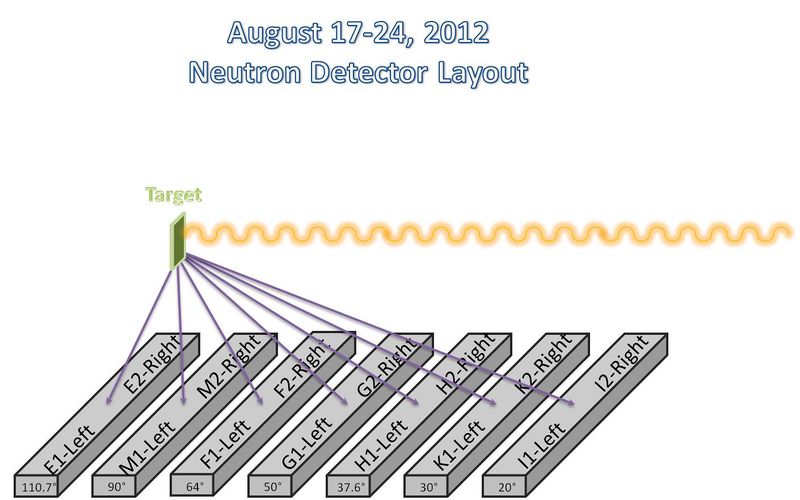
8/17/2012 - 8/24/2012
Neutron Detector Layout
August 2012 HRRL Data Analysis
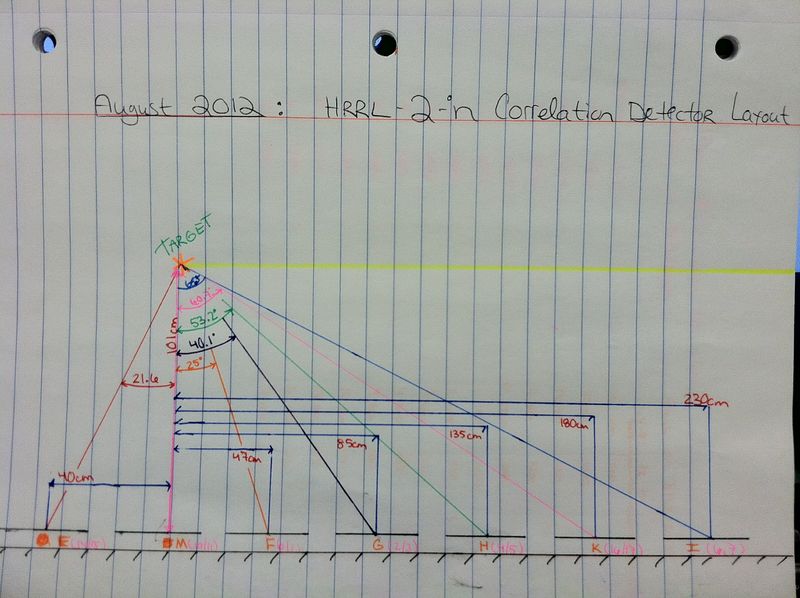
The detector measurements used for this data analysis are illustrated in the schematic below:
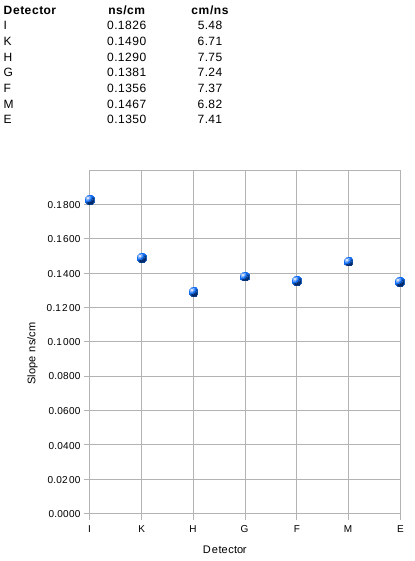
Using the index of refraction Oleksiy found:
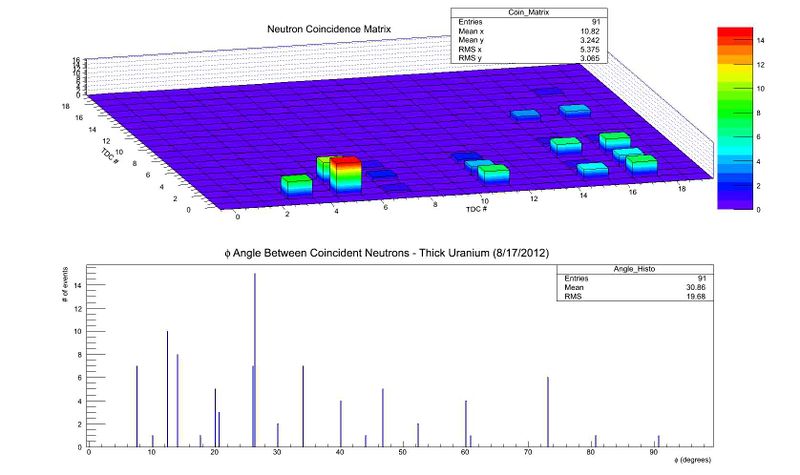
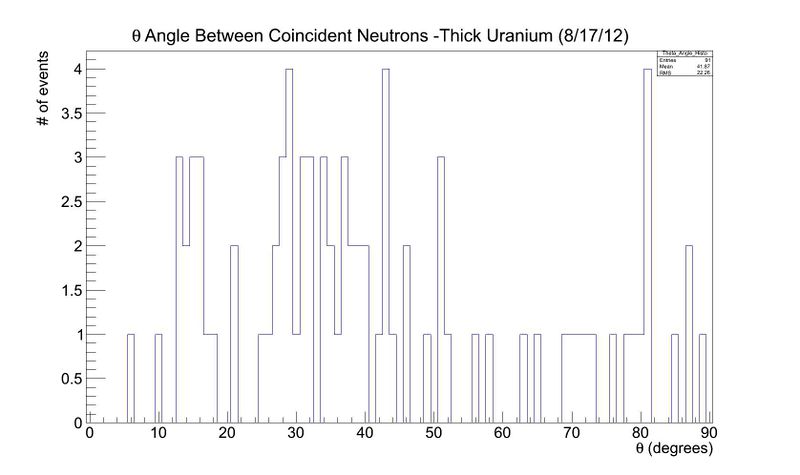
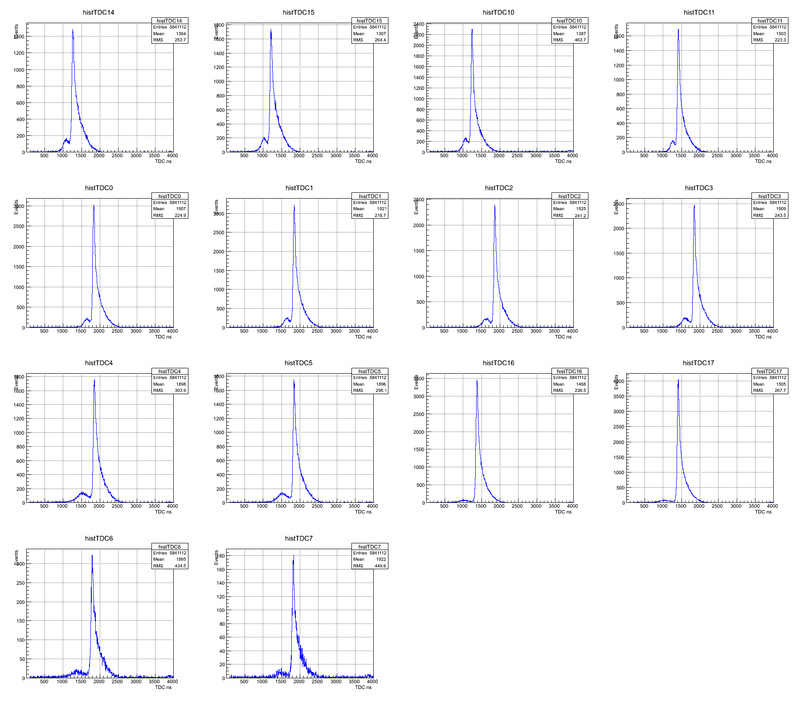
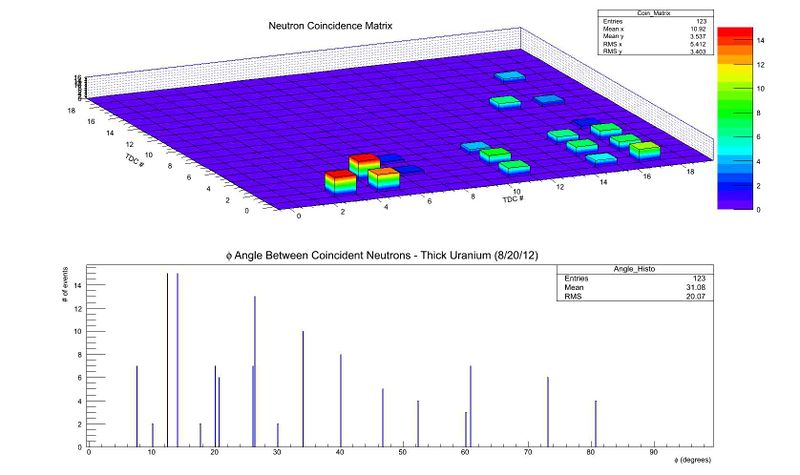
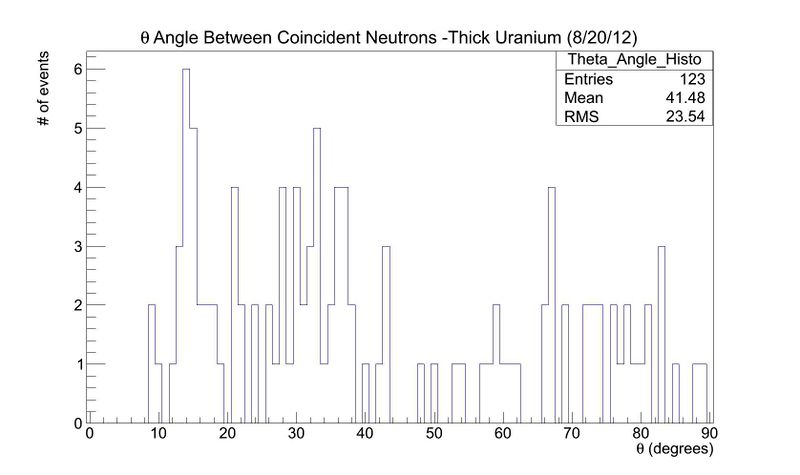
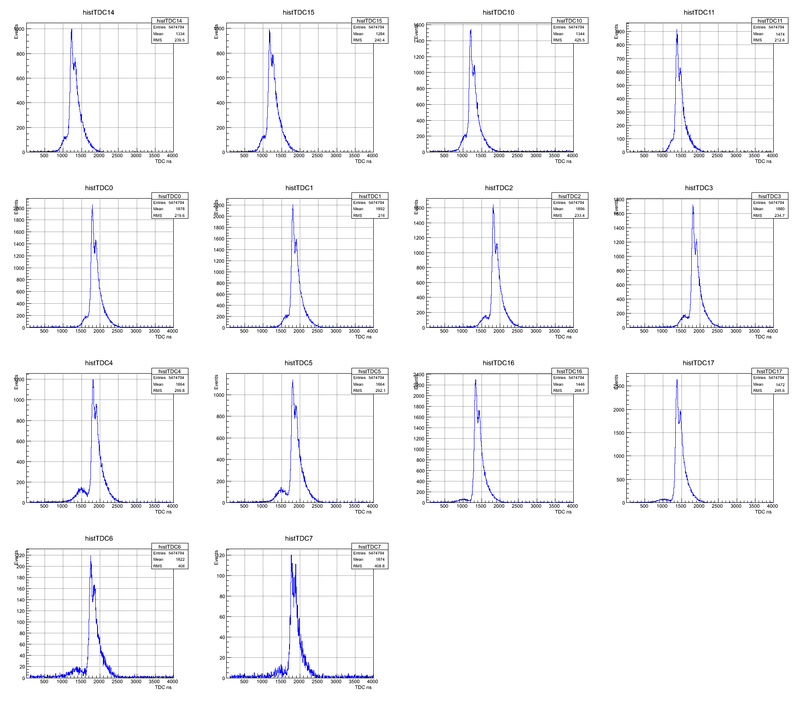
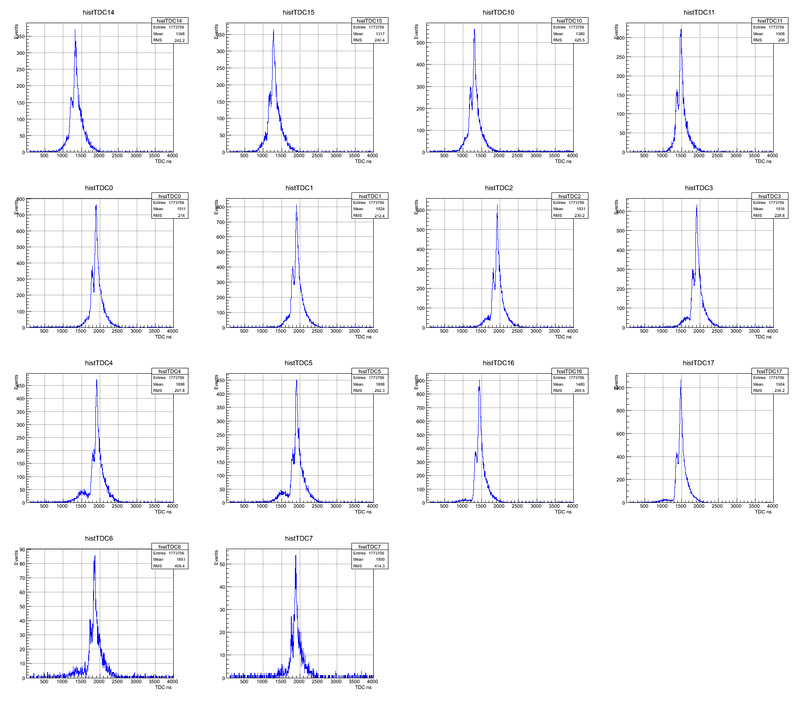
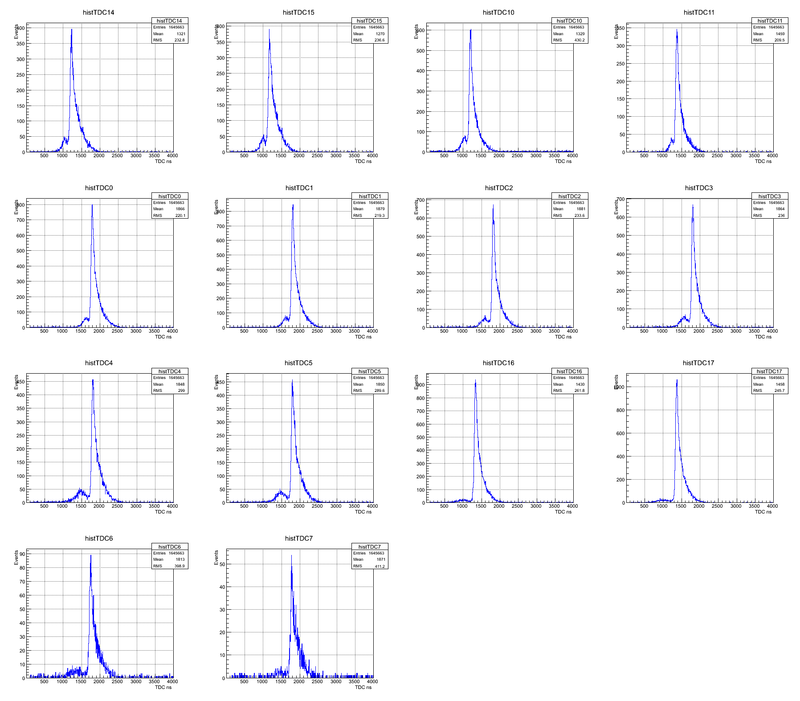
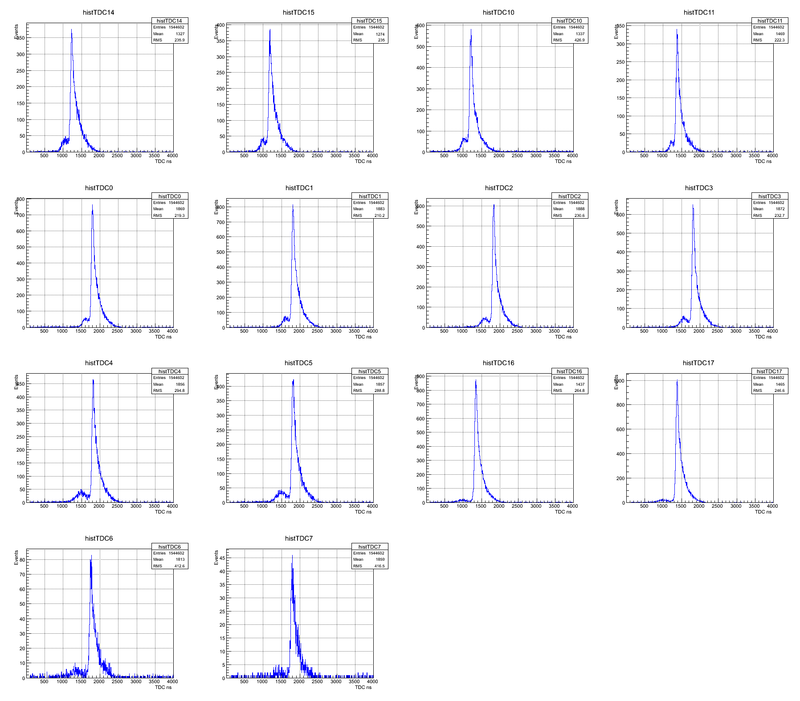
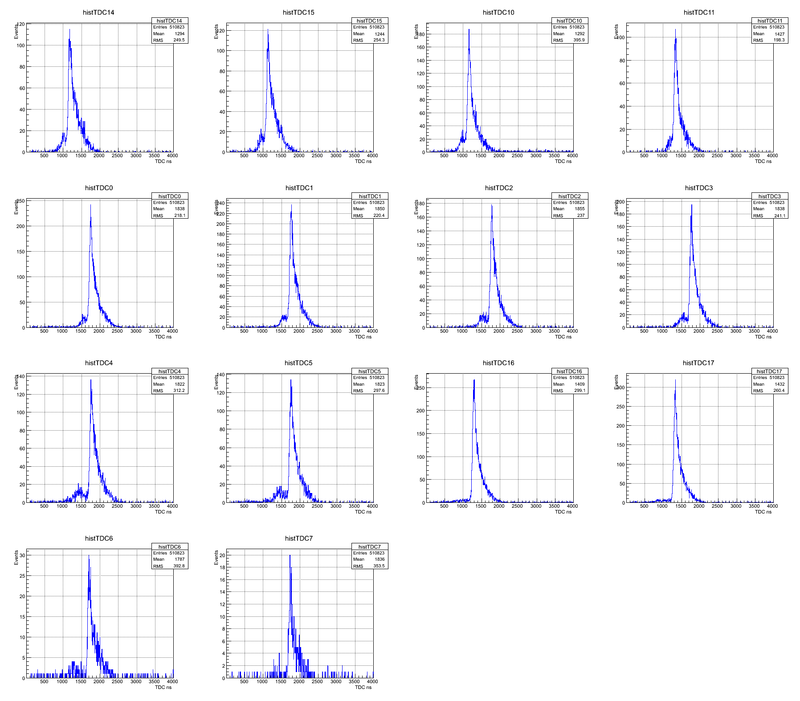
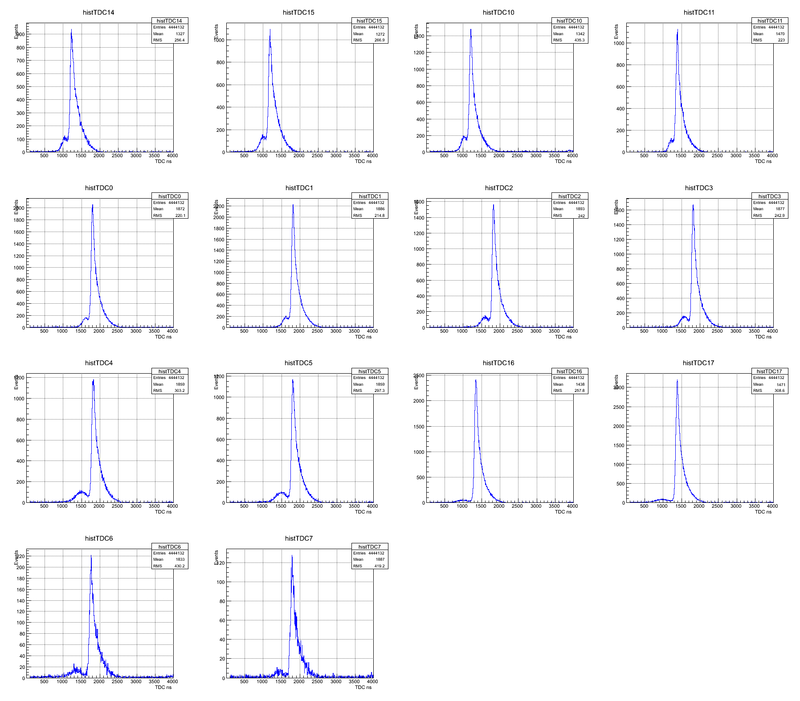
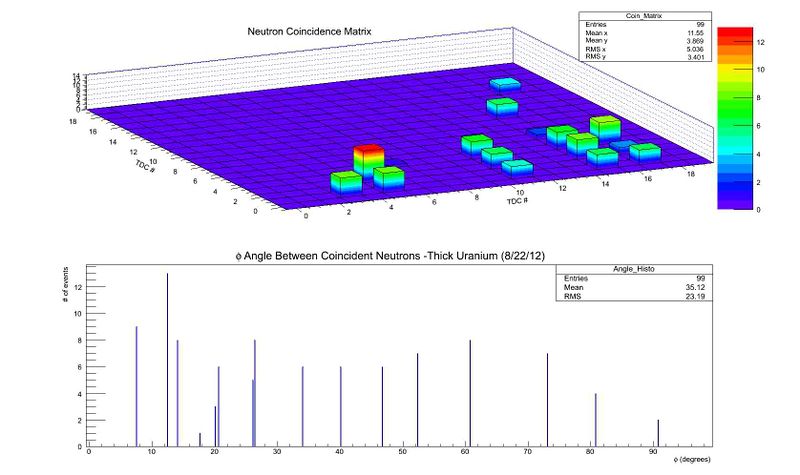
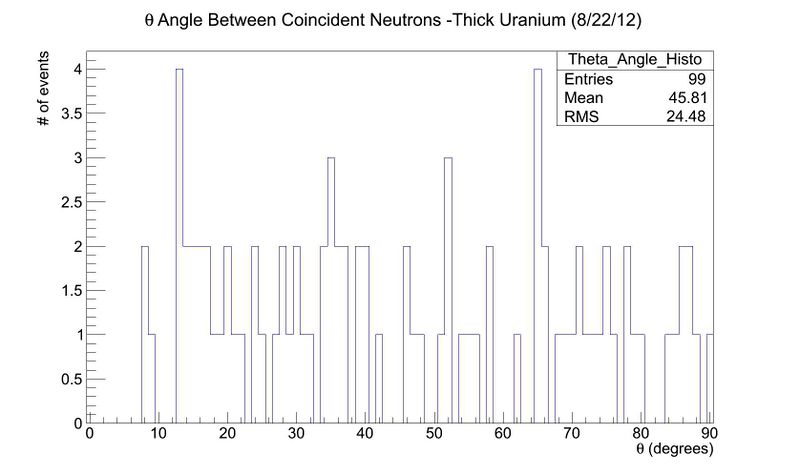
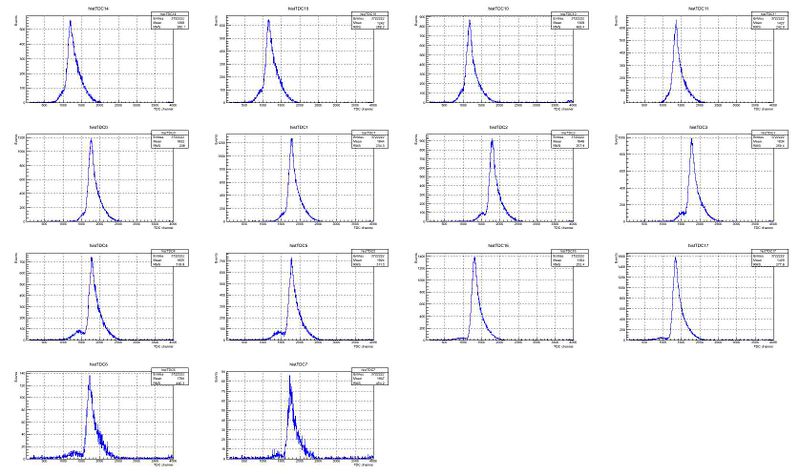
When analyzing the data, all the runs in a particular day were added together for better statistics. First, the raw data was used to determine where the neutrons cut would need to be placed for each run (or each day of runs if they were able to be combined). Applying those neutron cuts to each TDC, coincidences were found. The TDC spectra of the detectors that detected these coincidences were then analyzed to determine the spot on the detectors where each neutron hit. Knowing the location of detection, the theta and phi angles between coincident neutrons were found.
8/17
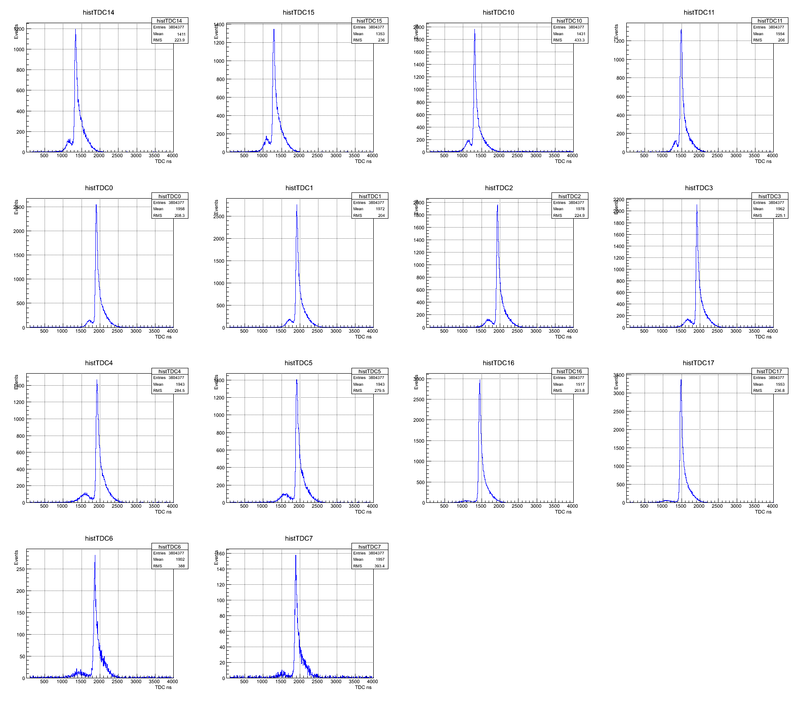
Raw Data:
Coincidence Data:
8/20
Raw Data:
Coincidence Data:
8/21
Raw Data:
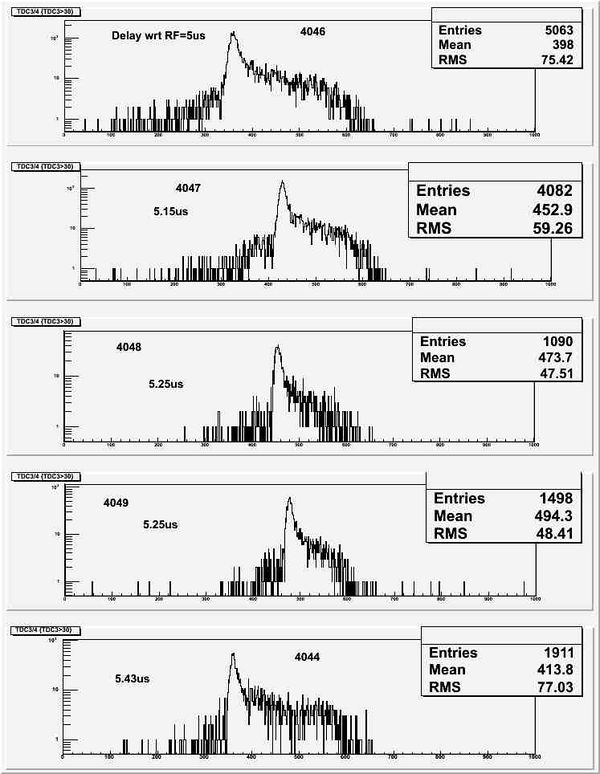
Here the multiple peak indicate that the timing in the beam was shifting, thus not allowing to combine. Each run of this day is plotted below.
4143
4144
4145
4146
8/22
Raw Data:
Coincidence Data:
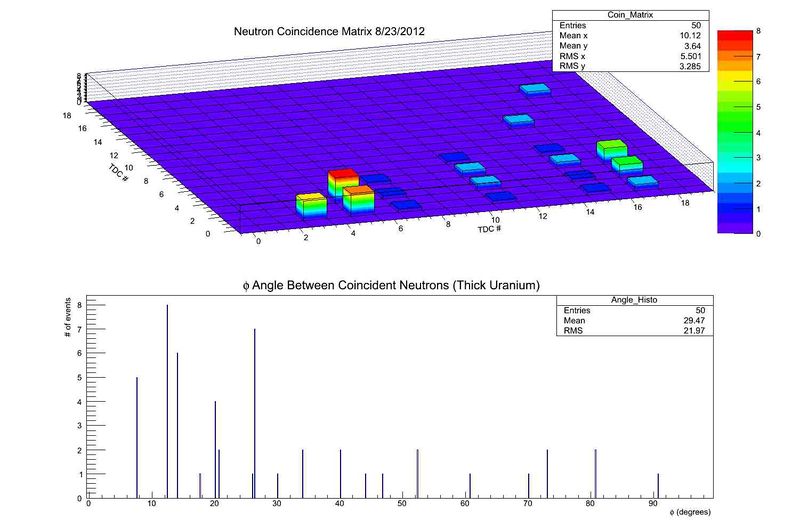
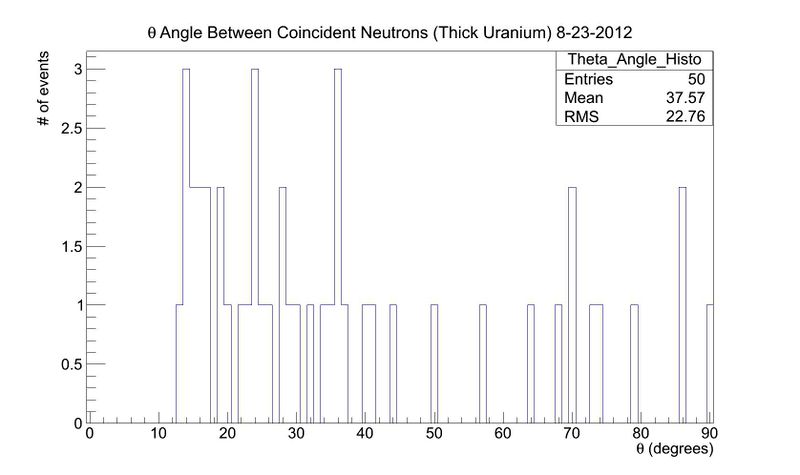
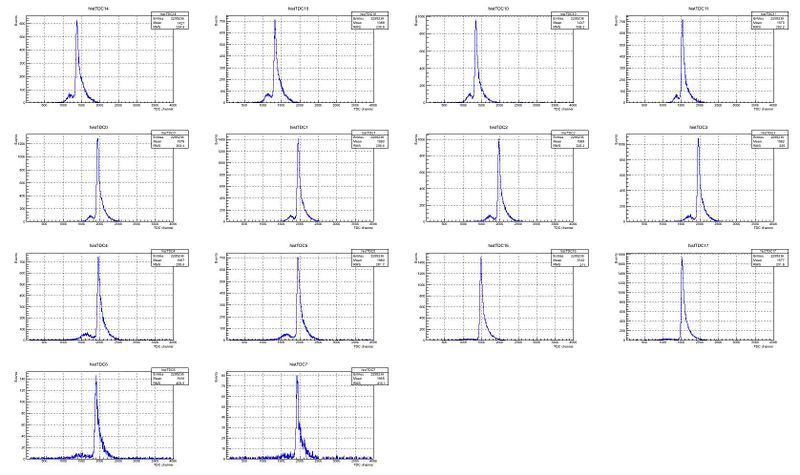
8/23
Raw Data:
Coincidence Data:
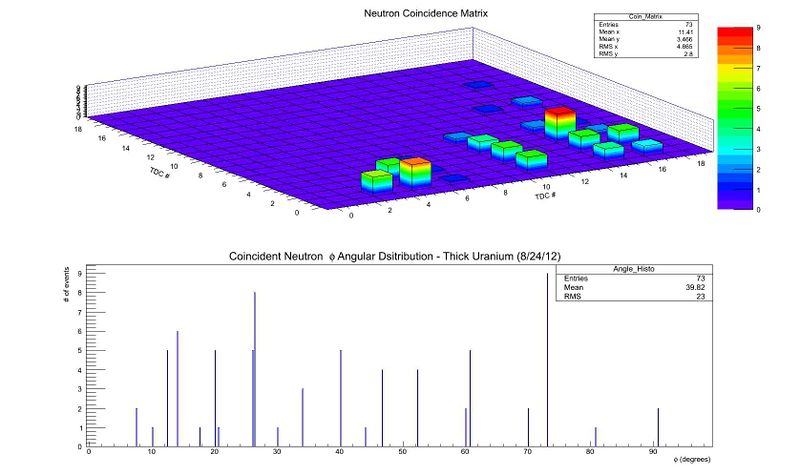
8/24
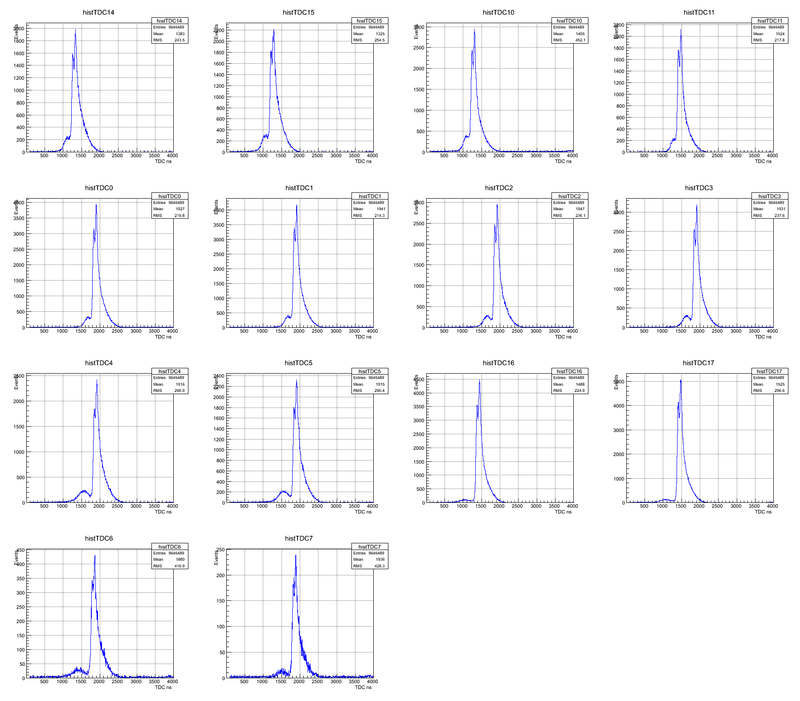
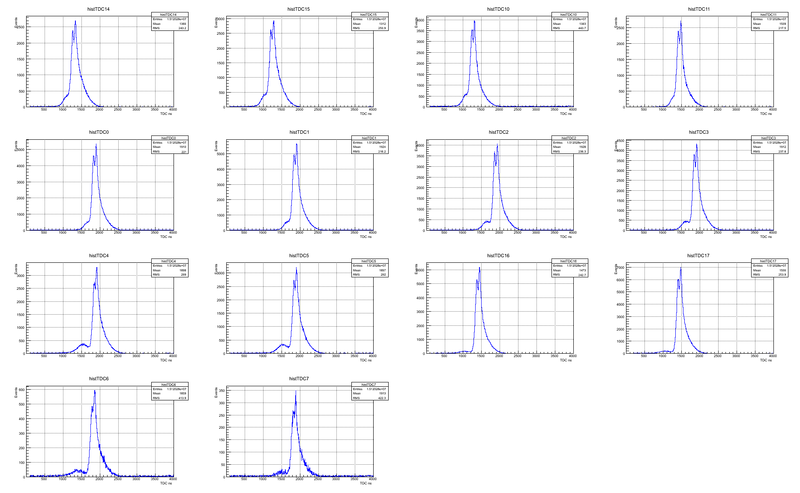
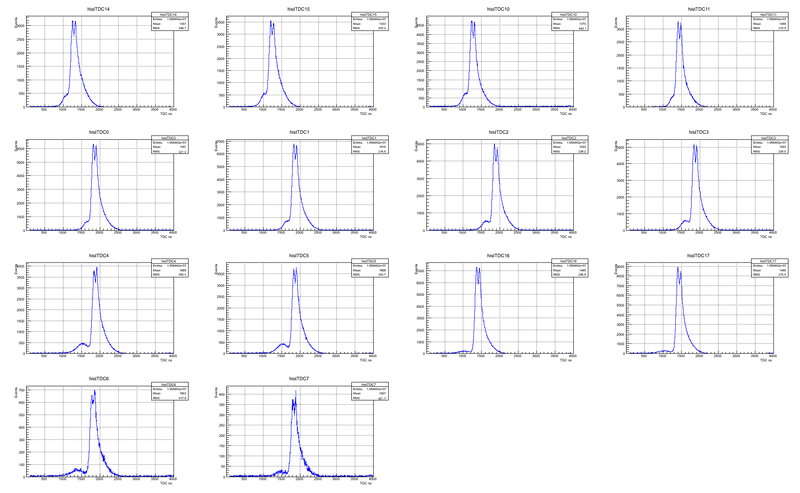
Raw Data:
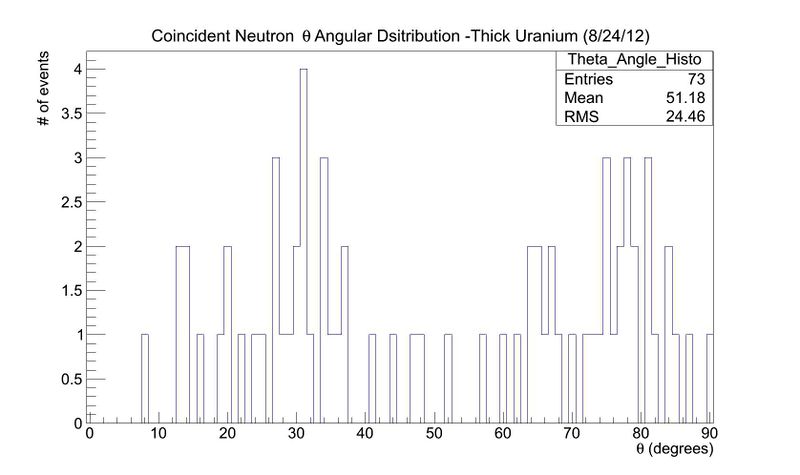
Coincidence Data:
8/17 - 8/20
8/17 - 8/21
8/17 - 8/22
