Difference between revisions of "2n Position resolution"
Jump to navigation
Jump to search
| Line 1: | Line 1: | ||
| + | ==FFT algorithm test== | ||
| + | |||
Experimental distribution of TDC difference time spectrum (blue) and ideal response function (red) are shown below: | Experimental distribution of TDC difference time spectrum (blue) and ideal response function (red) are shown below: | ||
Revision as of 21:43, 25 April 2013
FFT algorithm test
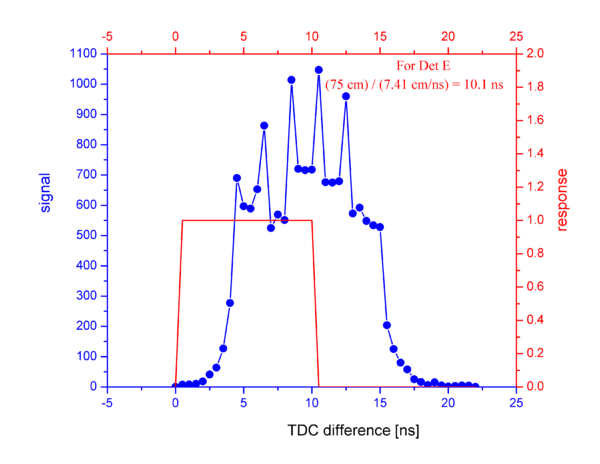
Experimental distribution of TDC difference time spectrum (blue) and ideal response function (red) are shown below:
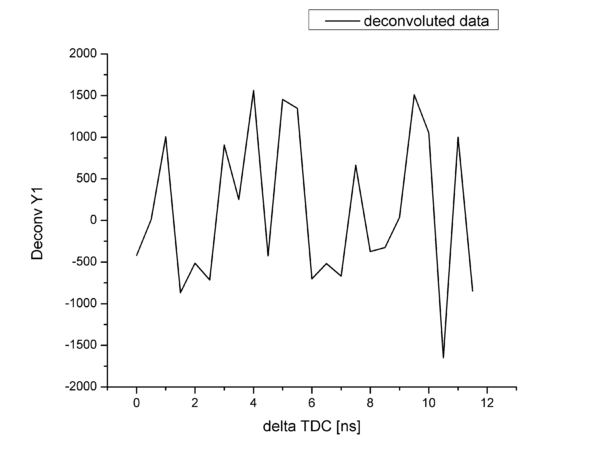
Raw data of FFT deconvolution of signal function and response function is presented below:
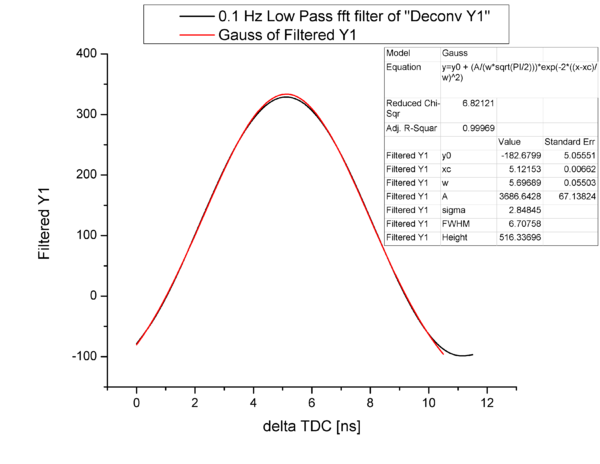
It can be seen the high frequency noise component in the raw data. Applying low pass filtering we could get the deconvoluted data:
Hence, any coordinate of the neutron hit has the following uncertainty in: sigma = 2.8 ns and its value converted into cm is 2.8 ns x 7.41 cm/ns = 20.7 cm. The total length of the active area of the neutron detector is 75 cm.


