Difference between revisions of "NSF 2012 CLAS PSF"
m (Protected "NSF 2012 CLAS PSF" ([edit=autoconfirmed] (indefinite) [move=autoconfirmed] (indefinite) [read=autoconfirmed] (indefinite))) |
|||
| Line 34: | Line 34: | ||
|}<br> | |}<br> | ||
| + | [[File:DeltaDoverD.eps]] | ||
| + | |||
| + | [[File:DeltaDoverD.xmgrace.txt]] | ||
[[2012_NSF_Proposal]] | [[2012_NSF_Proposal]] | ||
Revision as of 17:13, 23 October 2012
The CLAS12 Polarized Structure Function Program
- 2007 NSAC long range plan has a Delta-d/d graph in Fig 2.3 on pg 23.
\paragraph{The CLAS12 Polarized Structure Function Program}
Nucleon spin structure functions have been measured using deep inelastic lepton scattering (DIS) for over 20 years since the first experiments at SLAC. Interest increased substantially in the 1980s when the EMC collaboration reported that quarks make a small contribution to the overall spin of the proton. This ``spin puzzle" led to a vigorous theoretical and experimental effort that continues to this day. A substantially amount of data has been collected at CERN, SLAC, DESY, and JLab which covers a kinematic range that is sensitive to both valence quarks and quark-antiquark pairs.
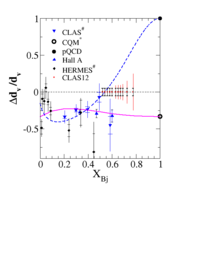
Interest in the quark contribution to a nucleon's structure continues unabated. At large Bjorken $x$, new data from JLab address for the first time the question of the helicity structure of the nucleon in a kinematic realm where sea quark and gluon contributions are minimal thereby making one mostly sensitive to valence quarks. An example of these results is shown in Fig.~\ref{deltadJLab}. To extend this region to higher $x$ and moderate $Q^2$, one needs higher beam energies than presently available at JLab. In particular, to test various models of the asymptotic value of the virtual photon asymmetry $A_1(x)$ as $x \rightarrow 1$, one needs the upgraded CEBAF with 12~GeV beam energy.
\singlespace
\begin{figure} [t]
\begin{center}
{
\scalebox{0.4} [0.5]{\includegraphics[height=5in]{figs/DeltaDoverD_CLAS12.eps}}
}
\caption{The expected statistical uncertainty of a $\Delta d/d$ measurement from CLAS12. The dashed line represents a pQCD prediction while the solid line represents the prediction from a hyperfine perturbed constituent quark model. The solid triangles are measurements from X.~Zheng {\it et al.}~\cite{Zhang}, and the diamonds are from A.~Airapetian {\it et al.}~\cite{AirapetianHERMES}. The squares represent a prediction of the precision obtained by a SIDIS measurement performed using the energy upgraded CEBAF and the upgraded CLAS. The risers represent systematic uncertainty and the error bar lines are statistical uncertainties.}
\label{deltadJLab}
\end{center}
\end{figure}
\doublespace
The comprehensive data set to be collected by experiment PR12-06-109 will contribute substantially to our knowledge of polarized parton distribution functions for all quark flavors and even the polarized gluon distribution $\Delta g$. Through Next-to-Leading Order (NLO) analysis of the world data on inclusive DIS (using the DGLAP evolution equations), one can constrain these distribution functions and their integrals. Existing CLAS data from 6 GeV have already made an impact on these fits. The expected data from the proposed experiment at 11~GeV will further reduce the uncertainties of these distributions. Semi-inclusive DIS (SIDIS) data will also be collected, where, in addition to the scattered electron, hadrons produced after the struck quark hadronizes are also detected. These data will further constrain the NLO fits and improve the separation of the various quark flavors' contribution to nucleon observables.
