Difference between revisions of "GradFinalLab RS"
| Line 19: | Line 19: | ||
==Graph <math>V_{out}</math> as a function of <math>V_{in}</math>. Is there a hysteresis loop?== | ==Graph <math>V_{out}</math> as a function of <math>V_{in}</math>. Is there a hysteresis loop?== | ||
| + | |||
| + | If the input voltage goes up my measured output voltages are: | ||
| + | |||
| + | [[File:Table input up.png | 400px]] | ||
| + | |||
| + | If the input voltage goes down my measured output voltages are: | ||
| + | |||
| + | [[File:Table input down.png | 400px]] | ||
| + | |||
| + | |||
| + | |||
| + | In the plot below I overplay the output voltages vs. input voltages for both cases as input voltage goes up (black line) and down (red line): | ||
| + | |||
| + | [[File:Plot hysteresis.png | 800px]] | ||
==Identify the input voltage threshold levels at which a <math> V_{in}</math> will produce <math>V_{out} \approx V_{cc}</math>== | ==Identify the input voltage threshold levels at which a <math> V_{in}</math> will produce <math>V_{out} \approx V_{cc}</math>== | ||
Revision as of 03:33, 27 April 2011
Construct a Schmitt Trigger using the 741 Op Amp
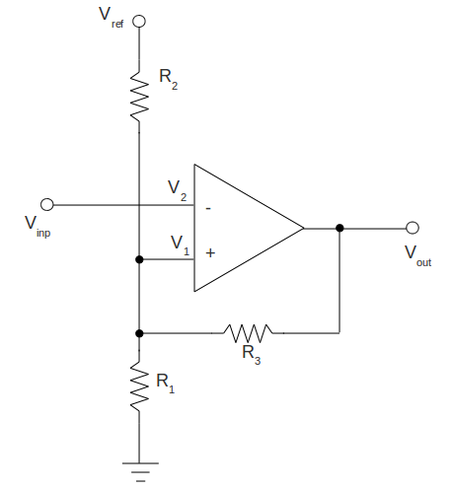
Draw the Schmitt Trigger circuit you constructed. Identify the values of all components
To construct the circuit above I am going to use the following components and voltages:
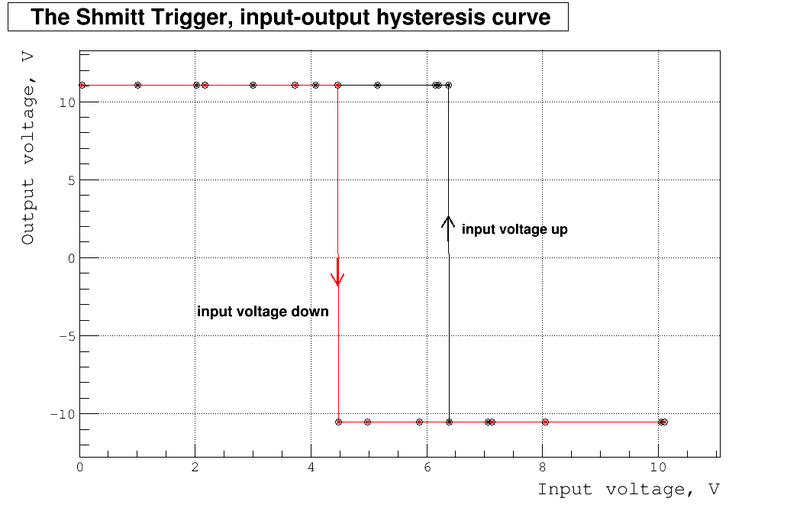
Graph as a function of . Is there a hysteresis loop?
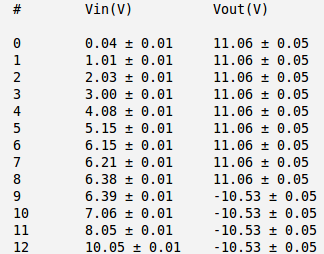
If the input voltage goes up my measured output voltages are:
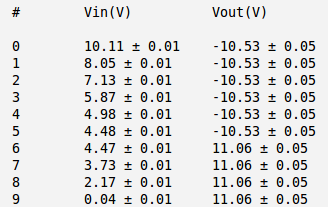
If the input voltage goes down my measured output voltages are:
In the plot below I overplay the output voltages vs. input voltages for both cases as input voltage goes up (black line) and down (red line):
Identify the input voltage threshold levels at which a will produce
Compare the threshold values to what is expected.
The theory does say (ch. 10.19 The Schmitt Trigger R. Simpson "Introductory electronics for scientists and engineers"):
1) if the output is high:
2) if the output is low:
where
and and approximately equal to supply voltage
The actual measured values of high and low output voltages (they do not really equal to ) are:
Substituting all quantities in the formulas above:
and doing math and propagating errors we end up with the following predicted threshold voltages:
1) If the output voltage is high the threshold voltage are:
1) If the output voltage is low the threshold voltage are:
Go Back to All Lab Reports Forest_Electronic_Instrumentation_and_Measurement


