Difference between revisions of "PePPO NaI PositronDetector 4 JLab"
| Line 156: | Line 156: | ||
The energy distributions measured do not appear to have the expected structure. There is a 1.3 MeV energy gamma from the Na-22 source which was expected but does not appear. Its intensity is 10% but it should start to show up on long runs. | The energy distributions measured do not appear to have the expected structure. There is a 1.3 MeV energy gamma from the Na-22 source which was expected but does not appear. Its intensity is 10% but it should start to show up on long runs. | ||
| − | + | Doing a Linear fit using the two points | |
| − | + | 1.25 MeV ,3207 Channels | |
| − | + | 0.511 MeV , 1839 Channles | |
| − | |||
==Gain== | ==Gain== | ||
Revision as of 23:14, 24 March 2011
Detector setup for a NaI positron detector for PePPO
NaI detector
The PMT is powered by a HV supply which should have a DC ripple less than 200 mV peak-to-peak at 3kV/3mA. A DC ripple will change the gain of the PMT and cause the energy resolution to deteriorate.
The Linearity of the detector system is another way to reduce the energy resolution. The measured PMT output should be linear with the input signal when the gain is constant. This linearity can be measured using 2 radiation sources.
Input HV: +1085 V
Input Current: 2.362 mA
Running CODA: Running CODA
Measurements Using V792 QDC
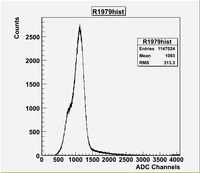
Run 1979
Start Time : March 23:12:30:26
End Time: March 23: 13:10:47
Elapsed time: 2421 seconds
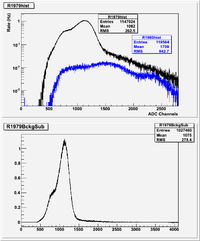
Run 1980
Remove Na-22 source from top of NaI crystal.
Start Time : March 23:13:11:23
End Time: March 23: 15:56:40
Elapsed Time:6317 seconds
Let's lower the gain of the Phillips 777 amplifier so the 511 peak is around channel 500. This way the 1 MeV photons may come on scale.
Run 1982
Overnight Cosmic Run
Start Time : March 23: 16:01:47
End Time: March 24: 09:41:31
Elapsed Time:63558 seconds
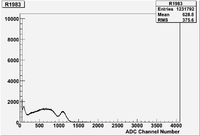
Run 1983
Start a run using Co-60
Start Time : March 24: 09:46:25
End Time: March 24: 10:14:24
Elapsed Time: 1679 seconds
The 1.x MeV gammas appear near channel 1200.
I'll do a long Na-22 run and think about upping the amplifier gain again to put the Co-60 peak around channel 3000.
The Co-60 source trigger rate is about 750 Hz and the Na-22 trigger rate was about 450 Hz.
Run 1984
Start a run using Na-22
Start Time : March 24: 10:16:49
End Time: March 24: 11:02:38
Elapsed Time: seconds
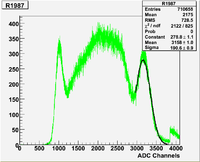
Run 1987
Increase gain of Phillips 777 amplifier which
I am using on the PMT output,  We may want to adjust
the dynode gain/discriminator to fill in the lower
energy part of the spectrum.
Start a run using Na-22
Start Time : March 24: 11:34:35
End Time: March 24: 1 Elapsed Time: seconds
I was expecting to see a photon of energy 1.17 and one with 1.33 MeV in the above specturm. Assuming that my ability to resolve the two peaks is due to noise I will assume both are in the peak at channel . Since the intensity of the above two lines are almost the same I will do a simple average.
- MeV
The above measurement indicates that a 1.25 MeV photon appears at channel in the current apparatus.
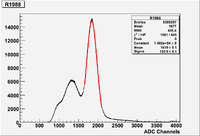
Run 1988
Start a run using Na-22
Start Time : March 24: 11:34:35 End Time: March 24: 16:21:31
Elapsed Time: seconds
The above measurement indicates that a 0.511 MeV photon appears at channel in the current apparatus.
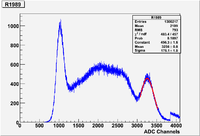
Run 1989
Start a run using Co-60
Start Time : March 24: 16:23:30
End Time: March 24: 16:57:00
Elapsed Time: seconds
The above measurement indicates that a 1.25 MeV photon appears at channel previously it was at in the current apparatus.
The 98 channel difference is beyond the fit statistic.
Taking the average of the two give 3207 Channels.
Energy Calibration using run 1987-1989
The energy distributions measured do not appear to have the expected structure. There is a 1.3 MeV energy gamma from the Na-22 source which was expected but does not appear. Its intensity is 10% but it should start to show up on long runs.
Doing a Linear fit using the two points
1.25 MeV ,3207 Channels
0.511 MeV , 1839 Channles
Gain
Linearity
Readout
F250
JLab's F250 flash ADC will be used to measure the NaI output
Na-22 source
North American Scientific Model CAL2600
Activity = 9.803 \muCi on 5/1/05
Serial Number 64236
Na-22 beta decays giving off a 215 keV KE beta and a 1.275 MeV photon.
http://atom.kaeri.re.kr/cgi-bin/decay?Na-22%20EC
Co-60 source
North American Scientific Model CAL2600
Activity = 9.641 \muCi on 5/1/05
Serial Number 64120
Co-60: decays to Ni giving 2 dominant gamma lines at 1.173237( 4) and
1.332501( 5) MeV. The Average Beta energy is 95 keV.
Co-60DecayChain.png
