Difference between revisions of "LB Thesis Theory Section"
| Line 46: | Line 46: | ||
==Predicted Activities and Production Rate Theory== | ==Predicted Activities and Production Rate Theory== | ||
| + | When performing photon activation analysis, it is important to estimate how many activated nuclei will be produced. An equation for the production rate can be written as the number of nucleons activated subtracted by the number of nucleons that decay away during the irradiation process. | ||
| + | |||
| + | <math>\frac{dN(t)}{dt} = N \sigma \phi - \lambda N(t)</math> | ||
| + | |||
| + | which gives a solution of | ||
| + | |||
| + | <math> N(t) = \frac{N \sigma \phi}{\lambda}\left ( 1 - e^{-\lambda t} \right )</math> | ||
[[LB PAA Nickel Investigation]] | [[LB PAA Nickel Investigation]] | ||
Revision as of 17:27, 6 March 2018
PAA Theory
General PAA Method
Photon activation analysis (PAA) is a method used to determine the isotopic composition of a sample based on the characteristic photon energies emitted by gamma decays of radioactive isotopes that have been activated by bremsstrahlung photons.. The sample is activated using a Linear Accelerator (LINAC) to accelerate electrons towards an aluminum/tungsten radiator and produce Bremsstrahlung radiation from those electrons that slow down within the radiator. Some of those Bremsstrahlung photons are of sufficient energy to free a nucleon(s) from the target nuclei in the sample of interest. We can estimate the energy required to knock out a neutron from Se-82 with a simple formula (in natural units):
So the energy of the accelerator used must be greater than 9.3 MeV. Another piece of information that is utilized when deciding which beam energy to use is the cross section for the desired reaction****
(here we didn't really use the cross section to determine the energy of the beam since we were not funded. We only really used the cross section to predict the activities of the radioactive isotopes, but even still the data would need to be extrapolated to try and get a more accurate prediction)
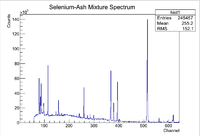
After the nucleons have been liberated from the nucleus, the nucleus becomes unstable and starts to undergo nuclear decay. The nuclear decay can emit photons that have energies characteristic to each isotope enabling the construction of a compositional fingerprint once the detected photon emission rates are also shown to have the half life of the assumed isotope. Typically High Purity Germanium Detectors are used to count the photons and measure the photon energy for the sample of interest. A typical photon energy distribution from an activated sample as measured by the HpGe detector is shown below
Note that there will be many different isotopic gamma decay lines present in the spectrum, but there are several methods to ensure that information about the isotope of interest can be found. The first step to proving that a specific isotope is present within a sample is to first look at the energy lines. Since each isotope has characteristic gamma decay lines, if the isotope is present, then those lines should be apparent in the spectrum (assuming the branching ratio is high enough that the lines don't get washed out in the background). Consider some isotope of interest that has 3 large characteristic decay lines. If all of those 3 lines are present in the spectrum, then that would be a good indicator that the isotope of interest might possibly be in the sample. Unfortunately more information is needed due to the fact that there are so many isotopes that 3 separate isotopes (or some other combination) could produce spectral lines close to the energy lines of the isotope of interest, which would produce a false positive. To strengthen the argument, multiple measurements can be made using the same sample to see how the rate of the signal decays over time. By finding how the rate of the signal of interest decays with time, one can apply the standard radioactive decay equation to find the half life of the isotope.
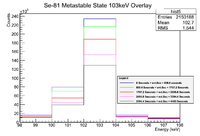
An example of a decaying energy line can be seen below
It can be seen above that the same energy line will become less apparent as time goes on due to the decay. By measuring the activity at several points in time, a plot of the measured activity as a function of time can be created. By fitting this function (whether linearly or exponentially), the fit parameters will give the initial activity and the decay constant. If the energy lines are present and the half life agrees with the isotope of interest, then the argument strengthens. There is one more step that can be taken to ensure the isotope of interest is present in the sample. Looking at the branching ratios for the different energy lines can provide a stronger argument. Consider some isotope of interest A that has two decay lines with branching ratios of 80% and 40%. By looking at the efficiency corrected rate seen by the detector for these lines, the ratio between the activities measured should be around 2, meaning that the first decay happens roughly twice as often as the second decay. Using all three of these pieces the experimenter can provide a strong argument for the isotope of interest being present in the sample.
This method of compositional analysis has many applications such as verifying a counterfeit product, and finding concentrations of contaminants in a sample.
Neutron Knockout of Selenium
Talk bout the 3 neutron knockouts of interest (81,75,79) and provide the half lives for each isotope. Also here include the cross section plots.
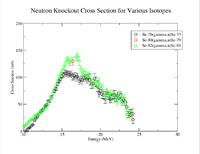
There are 3 reactions of interest and their neutron knockout cross sections are shown below:
This reaction must be taken into consideration because Se-79 has a half life of years, which makes it difficult to deal with as it is mixed waste.
This is the reaction that will me most studied in this experiment. It has only 1 line of interest, which is at 103.01 keV with a branching ratio of 12.8%. The half life of the metastable state of Se-81 is 57.28 +/- 0.02 minutes. The reason that this reaction is so important is because it is the limiting factor to determine isotopic ratios of interest. With such a short half life and a highly active matrix after being removed from the beam, it must be determined if this reaction can be seen first. The other isotopes of interest have much longer half lives, which allows the matrix to decay and become less active before measuring. Unfortunately here not much can be done about the active matrix, so the measurement of this isotope is key for future investigations to continue.
Predicted Activities and Production Rate Theory
When performing photon activation analysis, it is important to estimate how many activated nuclei will be produced. An equation for the production rate can be written as the number of nucleons activated subtracted by the number of nucleons that decay away during the irradiation process.
which gives a solution of
Minimum Detectable Activity Calculations
Reference: LB MDA/Se Mass Calculations
Calibration Methods
When using the HpGe detector, the energy isn't directly given due to the fact that the energy deposited by the photon into the crystal is converted into an ADC channel number. The energy calibration is quite simple. By using calibrated sources with known activities and energy lines, one can place the calibrated source in front of the HpGe detector and find which channel number corresponds to the energy line of interest. This would be a single data point in your calibration. To ensure that the calibration is of a high quality, take several sources with several different energy lines that span the channel range of the detector and compare the channel number to the energy. Once this information has been found, simply make a file with the energy the line was supposed to be, the channel number, and the standard deviation from a Gaussian fit and plot the points. Once the points are plotted a linear fit can be done to find exactly how the energy lines deviate from the raw channel number.


