|
0<t<300 |
750<t<1050 |
1508<t<1808 |
2260<t<2560 |
3030<t<3330 |
3820<t<4120 |
4580<t<4880 |
5325<t<5625 |
6085<t<6385 |
6835<t<7135 |
7585<t<7930
|
| Thin Window Histogram |
 |
 |
 |
 |
 |
 |
 |
 |
 |
 |

|
| Expanded Window Histogram |
 |
 |
 |
 |
 |
 |
 |
 |
 |
 |

|
| Signal in Thin Window |
[math] 6.662 \times 10^4 [/math] |
[math] 5.074 \times 10^4 [/math] |
[math] 3.909 \times 10^4[/math] |
[math]3.220 \times 10^4 [/math] |
[math] 2.718 \times 10^4[/math] |
[math]2.18 \times 10^4 [/math] |
[math] 1.855 \times 10^4[/math] |
[math]1.578 \times 10^4 [/math] |
[math] 1.228 \times 10^4[/math] |
[math] 1.16 \times 10^4[/math] |
[math] 1.241 \times 10^4[/math]
|
| Signal in Expanded Window |
[math] 1.132 \times 10^5 [/math] |
[math] 8.025 \times 10^4[/math] |
[math]5.866 \times 10^4 [/math] |
[math] 4.532 \times 10^4[/math] |
[math]3.735 \times 10^4[/math] |
[math] 2.868 \times 10^4[/math] |
[math]2.424 \times 10^4[/math] |
[math] 2.102 \times 10^4[/math] |
[math] 1.592 \times 10^4[/math] |
[math] 1.488 \times 10^4[/math] |
[math]1.662 \times 10^4 [/math]
|
| [math] S_{Expanded} - S_{Thin} [/math] |
[math] 4.6580 \times 10^4 [/math] |
[math] 2.9510 \times 10^4 [/math] |
[math] || \lt math\gt 1.9570 \times 10^4 [/math] |
[math] 1.3120 \times 10^4 [/math] |
[math] 1.0170 \times 10^4 [/math] |
[math] 6.880 \times 10^3 [/math] |
[math] 5.690 \times 10^3 [/math] |
[math] 5.240 \times 10^3 [/math] |
[math] 3.640 \times 10^3 [/math] |
[math]3.280 \times 10^3 [/math] |
[math] 4.210 \times 10^3 [/math]
|
| Integrated Background |
[math] 4.47 \times 10^4 \pm 1.221 \times 10^2 [/math] |
[math] 2.7680 \times 10^4 \pm 9.632 \times 10^2 [/math] |
[math] 1.8620 \times 10^4 \pm 7.94 \times 10^2 [/math] |
[math] 1.2656 \times 10^4 \pm 6.62 \times 10^2[/math] |
[math] 9.542 \times 10^3 \pm 5.84 \times 10^2 [/math] |
[math] 6.508 \times 10^3 \pm 5.04 \times 10^2 [/math] |
[math]5.470 \times 10^3 \pm 4.54 \times 10^2 [/math] |
[math] 4.512 \times 10^3 \pm 4.34 \times 10^2 [/math] |
[math] 3.308 \times 10^3 \pm 0.368 \times 10^3 [/math] |
[math] 3.148 \times 10^3 \pm 0.348 \times 10^3 [/math] |
[math] 3.896 \times 10^3 \pm 0.388 \times 10^3 [/math]
|
| Signal - Background |
[math] 2.1920 \times 10^4 \pm 4.6580 \times 10^4[/math] |
[math] 2.3060 \times 10^4 \pm 2.9510 \times 10^4 [/math] |
[math] 2.0470 \times 10^4 \pm 1.9570 \times 10^4 [/math] |
[math] 1.9544 \times 10^4 \pm 1.3120 \times 10^4 [/math] |
[math]1.7638 \times 10^4 \pm 1.0170 \times 10^4 [/math] |
[math] 1.5292 \times 10^4 \pm 0.6880 \times 10^4 [/math] |
[math] 1.3080 \times 10^4 \pm 0.5690 \times 10^4 [/math] |
[math] 1.0540 \times 10^4 \pm 0.5240 \times 10^3 [/math] |
[math] 8.972 \times 10^3 \pm 3.640 \times 10^3 [/math] |
[math]8.452 \times 10^3 \pm 3.280 \times 10^3 [/math] |
[math]8.514 \times 10^3 \pm 4.210 \times 10^3 [/math]
|
| Runtime (s) |
300 |
300 |
300 |
300 |
300 |
300 |
300 |
300 |
300 |
300 |
300
|
| Rate (Hz) |
73.03 +/- 155.27 |
76.87 +/- 98.37 |
68.23 +/- 65.23 |
65.15 +/- 43.73 |
58.79 +/- 33.9 |
50.97 +/- 22.9 |
43.6 +/- 18.97 |
35.13 +/- 17.47 |
29.91 +/- 12.13 |
28.17 +/- 10.93 |
21.28 +/- 10.53
|
| Integral Decay Correction (Hz) |
75.30 +/- 160.02 |
79.22 +/- 101.37 |
70.31 +/- 67.22 |
67.14 +/- 45.07 |
60.59 +/- 34.93 |
52.53 +/- 23.60 |
44.93 +/- 19.55 |
36.20 +/- 18.00 |
30.82 +/- 12.50 |
29.03 +/- 11.26 |
21.93 +/- 10.85
|
| Dead Time (%) |
6.59 +/- 0.43 |
5.95 +/- 0.42 |
2.53 +/- 0.31 |
1.92 +/- 0.26 |
1.33 +/- 0.23 |
0.84 +/- 0.16 |
0.65 +/- 0.15 |
0.65 +/- 0.15 |
0.51 +/- 18 |
0.51 +/- 0.18 |
0.51 +/- 0.18
|
| Dead Time Corrected Signal (Hz) |
80.61 +/- 171.31 |
84.23 +/- 107.78 |
72.14 +/ 68.97 |
68.45 +/- 45.95 |
61.41 +/- 35.40 |
52.97 +/- 23.80 |
45.22 +/- 19.68 |
36.44 +/- 18.12 |
30.98 +/- 12.56 |
29.18 +/- 11.32 |
22.04 +/- 10.91
|
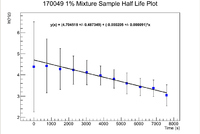
| .Dat File Entry For HL Plot |
4.39 +/- 2.13 |
4.43 +/- 1.28 |
4.28 +/- 0.96 |
4.23 +/- 0.67 |
4.12 +/- 0.58 |
3.97 +/- 0.45 |
3.81 +/- 0.44 |
3.60 +/- 0.50 |
3.43 +/- 0.41 |
3.37 +/- 0.39 |
3.09 +/- 0.50
|


