Difference between revisions of "Linear Fits"
Jump to navigation
Jump to search
| Line 13: | Line 13: | ||
I should note that the low dose calibration factor from the OSL reader is 9.496494 and 0.6806084 for the high dose. These values are close to the slopes of their respective linear fits. | I should note that the low dose calibration factor from the OSL reader is 9.496494 and 0.6806084 for the high dose. These values are close to the slopes of their respective linear fits. | ||
| − | <math> \frac{PMT Counts}{(Calibration\ factor) (Sensitivity)} = Dose\ (mRad) </math> | + | <math> \frac{PMT Counts}{(Calibration\ factor)\ (Sensitivity)} = Dose\ (mRad) </math> |
[[File:Low_Dose_OSL_Cal.png|400px|thumb|left|<math> {\chi}^2 = 0.31801</math>, <math> \text{# of Degrees of Freedom} = 2</math> ]] | [[File:Low_Dose_OSL_Cal.png|400px|thumb|left|<math> {\chi}^2 = 0.31801</math>, <math> \text{# of Degrees of Freedom} = 2</math> ]] | ||
Revision as of 21:27, 3 November 2017
Initial Fits
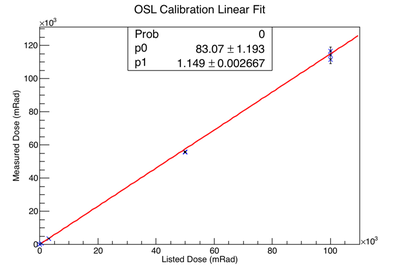
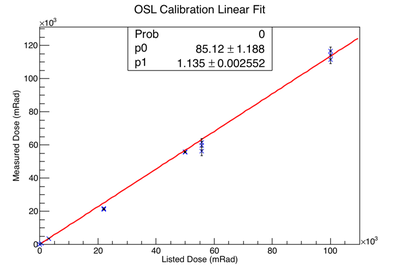
These fits are listed dose (from Landauer) vs measured dose (from OSL reader).
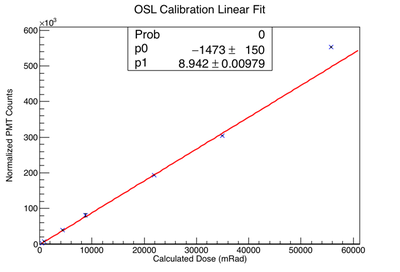
Calculated Dose vs PMT Counts
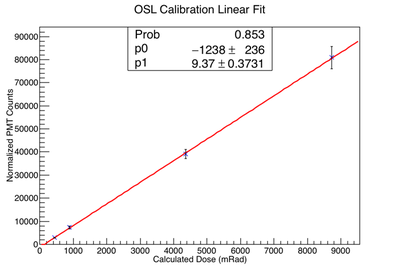
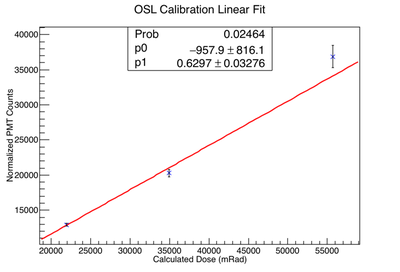
These fits were created using OSLs I irradiated using the 20Ci Source. I calculated the dose the OSLs should have on them using the dose calculations on the previous page. The PMT counts came straight from the OSL reader.
Number of degrees of freedom is data points - fit parameters
I should note that the low dose calibration factor from the OSL reader is 9.496494 and 0.6806084 for the high dose. These values are close to the slopes of their respective linear fits.
