Difference between revisions of "LB Feb2017 Se Investigations"
| Line 37: | Line 37: | ||
Now plot the activity as a function of time to get the half life. The window in root was [98:108] on the energy axis. Looking at the counts, dividing by the total run time, and taking the natural log of the activity is how the linear fit is created. | Now plot the activity as a function of time to get the half life. The window in root was [98:108] on the energy axis. Looking at the counts, dividing by the total run time, and taking the natural log of the activity is how the linear fit is created. | ||
| + | |||
| + | |||
| + | |||
| + | ==50% Se Mixture== | ||
[[PAA_Selenium]] | [[PAA_Selenium]] | ||
Revision as of 18:20, 24 April 2017
Neutron knockout on Se-82
While looking to see if certain lines are indeed selenium within the spectrum, it is worth noting that there are 2 states for Se-81. There is a metastable state with a 57 minute half life and a gamma emission of 103 keV. First I will attempt to show that this metastable state can indeed be seen in the spectrum.
Pure Selenium Sample
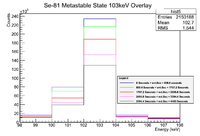
Below is an overlay of 5 plots with different cuts in time.
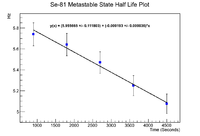
The half life was calculated using the program /data/IAC/Se/Feb2017Run/LB_WeightedFit.C
Using the slope, the half life can be found to be 58.9 +/- 11 minutes
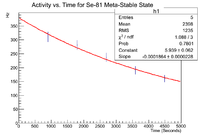
Below is a plot of the data when it is exponentiated
Since the constant term is inside of the exponent, we must exponentiate the constant to get the (efficiency uncorrected) Activity at t=0.
So the uncorrected activity at t=0 is 379.56 +\- 25.04 Hz. Using the Ba-133 87 keV efficiency at 3.9 cm away from the face of detector B, which is 0.017, the corrected activity can be found to be
22327.06 +\- 1472.94 Hz which converts to 603.43 +\- 39.81 nCi
The sample was measured 55 minutes after the beam was shut off, which brings the activity to
1.14 +\- 0.07 uCi
10% Se Mixture
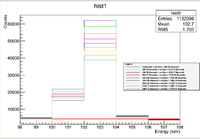
Below is an overlay of the spectra to see the decay over time of the line of interest
Now plot the activity as a function of time to get the half life. The window in root was [98:108] on the energy axis. Looking at the counts, dividing by the total run time, and taking the natural log of the activity is how the linear fit is created.


