Difference between revisions of "Run6980 Y88"
| (11 intermediate revisions by the same user not shown) | |||
| Line 53: | Line 53: | ||
ntuple->Draw("ADC7*0.595486-52.2669 >>r6978(2200,0,4400)") | ntuple->Draw("ADC7*0.595486-52.2669 >>r6978(2200,0,4400)") | ||
TH1F *r6978HpGeN=new TH1F("r6978HpGeN","r6978HpGeN",2200,0,4400) | TH1F *r6978HpGeN=new TH1F("r6978HpGeN","r6978HpGeN",2200,0,4400) | ||
| − | r6978HpGeN->Add( | + | r6978HpGeN->Add(r6978,0.003584229); |
| Line 73: | Line 73: | ||
| + | [[File:r6978_6980HpGeOverlay.png | 200 px]][[File:r6980TDCdiff.png | 200 px]] | ||
| + | The coincidence rate is a factor of 20 lower than the Singles rate | ||
| − | === 898 keV in HpGe | + | A gaussian fit to the above TDC spectrum yields a mean of 114 nsec and a Sigma of 143 nsec. |
| + | |||
| + | |||
| + | === 898 keV in HpGe with a cut around the 1840 keV line in NaI=== | ||
| + | |||
| + | |||
| + | ntuple->Draw("ADC7*0.595486-52.2669 >>r6978(2200,0,4400)") | ||
| + | TH1F *r6978HpGeN=new TH1F("r6978HpGeN","r6978HpGeN",2200,0,4400) | ||
| + | r6978HpGeN->Add(r6978,0.003584229); | ||
| + | |||
| + | |||
| + | ntuple->Draw("ADC7*0.595486-52.2669 >>r6980(2200,0,4400)","ADC3>1440 && ADC3 < 1560") | ||
| + | TH1F *r6980HpGeN=new TH1F("r6980HpGeN","r6980HpGeN",2200,0,4400) | ||
| + | r6980HpGeN->Add(r6980,0.000012405); | ||
| + | |||
| + | overlaying two plots | ||
| + | |||
| + | r6978HpGeN->Draw(); | ||
| + | Float_t rightmax = 1.1*r6980HpGeN->GetMaximum(); | ||
| + | Float_t scale = gPad->GetUymax()/rightmax; | ||
| + | r6980HpGeN->Scale(scale); | ||
| + | r6980HpGeN->Draw("same"); | ||
| + | TGaxis *axis = new TGaxis(gPad->GetUxmax(),gPad->GetUymin(),gPad->GetUxmax(), gPad->GetUymax(),0,rightmax,510,"+L"); | ||
| + | axis->SetLineColor(kRed); | ||
| + | axis->SetLabelColor(kRed); | ||
| + | axis->Draw(); | ||
[[File:r6980_1840NaICoin.png | 200 px]] | [[File:r6980_1840NaICoin.png | 200 px]] | ||
| + | === 1840 keV in HpGe with a cut around the NaI detectors 898 peak=== | ||
| + | ntuple->Draw("ADC7*0.595486-52.2669 >>r6978(2200,0,4400)") | ||
| + | TH1F *r6978HpGeN=new TH1F("r6978HpGeN","r6978HpGeN",2200,0,4400) | ||
| + | r6978HpGeN->Add(r6978,0.003584229); | ||
| + | |||
| + | |||
| + | ntuple->Draw("ADC7*0.595486-52.2669 >>r6980(2200,0,4400)","ADC3>780 && ADC3 < 810") | ||
| + | TH1F *r6980HpGeN=new TH1F("r6980HpGeN","r6980HpGeN",2200,0,4400) | ||
| + | r6980HpGeN->Add(r6980,0.000012405); | ||
| + | |||
| + | overlaying two plots | ||
| + | |||
| + | r6978HpGeN->Draw(); | ||
| + | Float_t rightmax = 1.1*r6980HpGeN->GetMaximum(); | ||
| + | Float_t scale = gPad->GetUymax()/rightmax; | ||
| + | r6980HpGeN->Scale(scale); | ||
| + | r6980HpGeN->Draw("same"); | ||
| + | TGaxis *axis = new TGaxis(gPad->GetUxmax(),gPad->GetUymin(),gPad->GetUxmax(), gPad->GetUymax(),0,rightmax,510,"+L"); | ||
| + | axis->SetLineColor(kRed); | ||
| + | axis->SetLabelColor(kRed); | ||
| + | axis->Draw(); | ||
| + | |||
| + | [[File:r6980_898NaICoin.png | 200 px]] | ||
| + | |||
| + | There appears to be a chance to detect two 898 keV photons in both detectors in coincidence? Probably one is an accidental. | ||
| + | |||
| + | |||
| + | Is the 1320 keV line real? | ||
| + | |||
| + | The 511 keV seems to always be there as well. Is it an accidental? | ||
[[PAA_11-11-13#Y-88_coincidence_lines]] | [[PAA_11-11-13#Y-88_coincidence_lines]] | ||
Latest revision as of 17:15, 11 February 2014
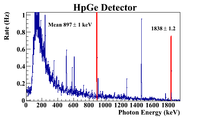
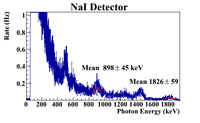
Photon Lines
| Energy (keV) | Relative Intensity |
| 850.6 | 0.065 |
| 898.042 | 93.7 |
| 1382.2 | 0.021 |
| 1836.063 | 99.2 |
| 2734.0 | 0.71 |
| 3219.7 | 0.0070 |
E(γ) Coincidence
  850.6	898.042, 1836.063, 2734.0
  850.6	898.042, 1836.063, 2734.0
  898.042	850.6, 850.6, 1836.063
  898.042	1836.063
 1382.2	1836.063
 1382.2	1836.063
 1836.063	850.6, 850.6, 898.042, 898.042, 1382.2, 1382.2
 2734.0	850.6, 850.6
Calibration
ntuple->Draw("ADC3*1.29679-127.215 >>(2200,0,4400)")
ntuple->Draw("ADC7*0.595486-52.2669 >>(2200,0,4400)")
Singles Run 6978
Coincidence Lines
| Run | Description | |
| 6978 | OR mode using Y-88 sample # 130113-004 , post amp at 20, rate is 695 Hz, CFD's still at 12 mV for NaI detector and 10 mV for HpGe , 4 min 39 sec | |
| 6980 | AND mode using Y-88 sample # 130113-004 , post amp at 20, rate is Hz, CFD's still at 12 mV for NaI detector and 10 mV for HpGe , min sec, 10 Hz pulser wasn't working for run 6975-6978, it is working for this run |
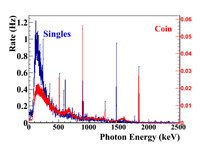
ntuple->Draw("ADC7*0.595486-52.2669 >>r6978(2200,0,4400)") TH1F *r6978HpGeN=new TH1F("r6978HpGeN","r6978HpGeN",2200,0,4400) r6978HpGeN->Add(r6978,0.003584229);
ntuple->Draw("ADC7*0.595486-52.2669 >>r6980(2200,0,4400)")
TH1F *r6980HpGeN=new TH1F("r6980HpGeN","r6980HpGeN",2200,0,4400)
r6980HpGeN->Add(r6980,0.000012405);
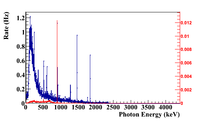
overlaying two plots
r6978HpGeN->Draw();
Float_t rightmax = 1.1*r6980HpGeN->GetMaximum();
Float_t scale = gPad->GetUymax()/rightmax;
r6980HpGeN->Scale(scale);
r6980HpGeN->Draw("same");
TGaxis *axis = new TGaxis(gPad->GetUxmax(),gPad->GetUymin(),gPad->GetUxmax(), gPad->GetUymax(),0,rightmax,510,"+L");
axis->SetLineColor(kRed);
axis->SetLabelColor(kRed);
axis->Draw();
The coincidence rate is a factor of 20 lower than the Singles rate
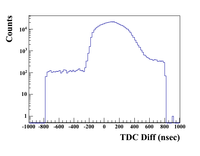
A gaussian fit to the above TDC spectrum yields a mean of 114 nsec and a Sigma of 143 nsec.
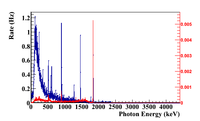
898 keV in HpGe with a cut around the 1840 keV line in NaI
ntuple->Draw("ADC7*0.595486-52.2669 >>r6978(2200,0,4400)") TH1F *r6978HpGeN=new TH1F("r6978HpGeN","r6978HpGeN",2200,0,4400) r6978HpGeN->Add(r6978,0.003584229);
ntuple->Draw("ADC7*0.595486-52.2669 >>r6980(2200,0,4400)","ADC3>1440 && ADC3 < 1560")
TH1F *r6980HpGeN=new TH1F("r6980HpGeN","r6980HpGeN",2200,0,4400)
r6980HpGeN->Add(r6980,0.000012405);
overlaying two plots
r6978HpGeN->Draw();
Float_t rightmax = 1.1*r6980HpGeN->GetMaximum();
Float_t scale = gPad->GetUymax()/rightmax;
r6980HpGeN->Scale(scale);
r6980HpGeN->Draw("same");
TGaxis *axis = new TGaxis(gPad->GetUxmax(),gPad->GetUymin(),gPad->GetUxmax(), gPad->GetUymax(),0,rightmax,510,"+L");
axis->SetLineColor(kRed);
axis->SetLabelColor(kRed);
axis->Draw();
1840 keV in HpGe with a cut around the NaI detectors 898 peak
ntuple->Draw("ADC7*0.595486-52.2669 >>r6978(2200,0,4400)") TH1F *r6978HpGeN=new TH1F("r6978HpGeN","r6978HpGeN",2200,0,4400) r6978HpGeN->Add(r6978,0.003584229);
ntuple->Draw("ADC7*0.595486-52.2669 >>r6980(2200,0,4400)","ADC3>780 && ADC3 < 810")
TH1F *r6980HpGeN=new TH1F("r6980HpGeN","r6980HpGeN",2200,0,4400)
r6980HpGeN->Add(r6980,0.000012405);
overlaying two plots
r6978HpGeN->Draw();
Float_t rightmax = 1.1*r6980HpGeN->GetMaximum();
Float_t scale = gPad->GetUymax()/rightmax;
r6980HpGeN->Scale(scale);
r6980HpGeN->Draw("same");
TGaxis *axis = new TGaxis(gPad->GetUxmax(),gPad->GetUymin(),gPad->GetUxmax(), gPad->GetUymax(),0,rightmax,510,"+L");
axis->SetLineColor(kRed);
axis->SetLabelColor(kRed);
axis->Draw();
There appears to be a chance to detect two 898 keV photons in both detectors in coincidence? Probably one is an accidental.
Is the 1320 keV line real?
The 511 keV seems to always be there as well. Is it an accidental?
