Difference between revisions of "PAA CoincidenceCounting"
(→Au) |
|||
| (231 intermediate revisions by the same user not shown) | |||
| Line 3: | Line 3: | ||
Canberra Model 9615 < 0.04% (integral) over 2usec | Canberra Model 9615 < 0.04% (integral) over 2usec | ||
| − | Canberra Model 9633 < 0.025% (integral) < 0.9% (differential) | + | Canberra Model 9633 < 0.025% (integral) < 0.9% (differential), +10V range into 1kOhm, 8192 channels (13 bit), 100 usec signal width => 100 pC/chan |
| − | CAEN V792 < 0.1% (integral) | + | CAEN V792 < 0.1% (integral), 200 fC/chan |
| + | |||
| + | CAEN digitizer VX1492, 14 bit, 10 Volt range | ||
| + | |||
| + | CAEN V1720: | ||
| Line 11: | Line 15: | ||
==First pict with ADC gate== | ==First pict with ADC gate== | ||
| + | |||
| + | ===Pics using Spec Amps only and Peak Sensing ADC=== | ||
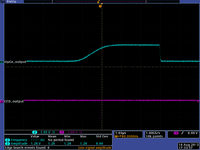
| + | Below is a picture of the spec amp ouput which is send to the Peak sensing ADC. | ||
| + | The pulse is over 5 usec long indicating that pile up will happen when the detected incident particle rate is 1/5usec = 200 kHz. Pile up can also happen at lower rates so keep the singles counting rate below 10 kHz by moving the source farther away or waiting a few half lives. | ||
| + | |||
| + | [[File:CPAA_PADCinput08142013.png | 200 px]] | ||
| + | ===Pics using noising inverting amps=== | ||
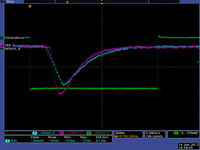
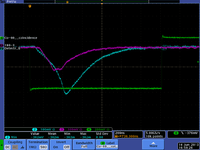
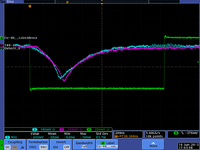
Two HpGe detectors were used to detect coincidence gammas from Co-60 on 6/14/2013. | Two HpGe detectors were used to detect coincidence gammas from Co-60 on 6/14/2013. | ||
| Line 18: | Line 29: | ||
[[File:A061413_CPAA_coin.png | 200 px]][[File:B061413_CPAA_coin.png | 200 px]][[File:C061413_CPAA_coin.png | 200 px]] | [[File:A061413_CPAA_coin.png | 200 px]][[File:B061413_CPAA_coin.png | 200 px]][[File:C061413_CPAA_coin.png | 200 px]] | ||
| − | |||
=First Singles Spectrum= | =First Singles Spectrum= | ||
| Line 48: | Line 58: | ||
[[File:Noise_B62613.png | 200 px]] | [[File:Noise_B62613.png | 200 px]] | ||
| + | =Singles Spectrum (2nd attempt)= | ||
| + | |||
| + | ==Using detector 180-3== | ||
| + | |||
| + | HV = -2800 Volts | ||
| + | |||
| + | Run 5446, Co-60 and Na-22 sources are in at the same time, attenuation is 18 db, 1 Mev photon peaks are around 3000 -> 3500 channels in ADC spectrum | ||
| + | |||
| + | Two Co-60 Lines | ||
| + | |||
| + | Mean 2.94555e+03 +/- 7.23197e-01 | ||
| + | Sigma 7.61455e+01 +/- 8.86697e-01 | ||
| + | |||
| + | Mean 3.63275e+03 +/- 8.39279e-01 | ||
| + | Sigma 7.45542e+01 +/- 1.04796e+00 | ||
| + | |||
| + | 1.2 meV na-22 line | ||
| + | |||
| + | Mean 3.37891e+03 +/- 1.07859e+00 | ||
| + | Sigma 6.26450e+01 +/- 1.73063e+00 | ||
| + | |||
| + | Run 5447, Na-22 source, attenuation is 18 db, 1 Mev photon peaks are around 3000 -> 3500 channels in ADC spectrum | ||
| + | Mean 3.38431e+03 +/- 1.29456e-01 | ||
| + | Sigma 1.12914e-01 +/- 2.59220e-02 | ||
| + | |||
| + | Run 5448, Na-22 source, attenuation is 14 db, 0.511 Mev photon peaks are around 1000 channels in ADC spectrum | ||
| + | |||
| + | Run 5449, Na-22 source, attenuation is 12 db, 0.511 Mev photon peaks are around 2500 channels in ADC spectrum | ||
| + | |||
| + | Mean 2.60181e+03 +/- 8.10190e-01 | ||
| + | Sigma 5.97964e+01 +/- 6.63405e-01 | ||
| + | |||
| + | |||
| + | Run 5450, Co-60 source, attenuation is 12 db, 1 Mev photon peaks are around 3000-> overflow channels in ADC spectrum | ||
| + | |||
| + | |||
| + | Run 5451, Co-60 source, attenuation is 13 db, 1 Mev photon peaks are around 2500 -> 3500 channels in ADC spectrum | ||
| + | |||
| + | Low energy 1.2 MeV peak | ||
| + | |||
| + | Mean 2.64173e+03 +/- 1.35816e+00 | ||
| + | Sigma 1.03518e+02 +/- 1.49690e+00 | ||
| + | |||
| + | High energy 1.3 MeV peak | ||
| + | Mean 3.33157e+03 +/- 1.36696e+00 | ||
| + | Sigma 1.01444e+02 +/- 1.15611e+00 | ||
| + | |||
| + | |||
| + | Run 5452, Na-22 source, attenuation is 13 db, 1 Mev photon peaks are around 2500 -> 3500 channels in ADC spectrum | ||
| + | |||
| + | Mean 3.02266e+03 +/- 1.53757e+00 | ||
| + | Sigma 5.26142e+01 +/- 1.61646e+00 | ||
| + | |||
| + | |||
| + | Run 5453, NO source, attenuation is 13 db, 1 Mev photon peaks are around 2500 -> 3500 channels in ADC spectrum, run started at 17:18:27 on July 23 ended on July 24 at 15:34:05 | ||
| + | |||
| + | |||
| + | Run 5484, Na-22 and Co-60 source, attenuation is 14 db, 1 Mev photon peaks are around 2600 -> 3600 channels in ADC spectrum, Na-22 and Co-60 peaks are separable unlike in detector B | ||
| + | |||
| + | Run 5484, Na-22 source, attenuation is 8 db, 0.5 Mev photon peaks are around 2000 channels in ADC spectrum | ||
| + | |||
| + | ==Using detector B== | ||
| + | |||
| + | HV = +4520 Volts | ||
| + | |||
| + | Run 5466, Na-22 source, attenuation is 17 db, 1 Mev photon peaks are around 2300 channels in ADC spectrum | ||
| + | |||
| + | |||
| + | Run 5470, Co-60 source, attenuation is 17 db, 1 Mev photon peaks are around 2300 channels in ADC spectrum | ||
| + | |||
| + | |||
| + | Run 5471 & 5472, Na-22 and Co-60 sources both in, attenuation is 17 db, 1 Mev photon peaks are around 2300 channels in ADC spectrum | ||
| + | |||
| + | |||
| + | Run 5474, Na-22 source, attenuation is 12 db, 0.5 Mev photon peaks are around 1000 channels in ADC spectrum | ||
| + | |||
| + | |||
| + | ;:The above runs used the same input lines that were used for detector 180-3, Now I put Detector B through its own signal lines and the attenuation needed changes | ||
| + | |||
| + | Run 5477, Na-22 source, attenuation is 9 db, 1 Mev photon peaks are around 3000 channels in ADC spectrum | ||
| + | |||
| + | |||
| + | Run 5478, Co-60 source, attenuation is 9 db, 1 Mev photon peaks are around 3000 channels in ADC spectrum | ||
| + | |||
| + | Run 5480, Na-22 source, attenuation is 3 db, 0.5 Mev photon peaks are around 1500 channels in ADC spectrum | ||
| + | |||
| + | =Singles SPectrum 3rd attempt (Peak sensing ADC)= | ||
| + | |||
| + | |||
| + | Using the CAEN 785 peak sensing ADC I was able to increase the dynamic range and take positive going pulses. | ||
| + | |||
| + | Below are the first two spectra with sources and almost no discrimination | ||
| + | |||
| + | |||
| + | ==Detector 180-3== | ||
| + | |||
| + | {| border="1" |cellpadding="20" cellspacing="0 | ||
| + | |- | ||
| + | | Run Number || Description | ||
| + | |- | ||
| + | | 5632|| Na-22 1 uCi source | ||
| + | |- | ||
| + | | 5633 || Co-60 1 uCi Source [[File:r5632-5633_spect.png | 50 px]] | ||
| + | |- | ||
| + | | 5634 || Co-60 1 uCi Source, set threshold on Ortec Const Fraction Timing Disc model 2035A to 20 mV | ||
| + | |- | ||
| + | | 5635 || Co-60 1 uCi Source, set threshold on Ortec Const Fraction Timing Disc model 2035A to 10 mV | ||
| + | |- | ||
| + | | 5636 || Na-22 1 uCi Source, set threshold on Ortec Const Fraction Timing Disc model 2035A to 10 mV [[File:r5635-5636_spect.png | 50 px]] | ||
| + | |- | ||
| + | |} | ||
| + | |||
| + | |||
| + | Calibration Fit | ||
| + | |||
| + | Spectrum of 60Co, peaks at 1.17 and 1.33 MeV | ||
| + | |||
| + | Co60: http://ie.lbl.gov/toi/nuclide.asp?iZA=270060 | ||
| + | |||
| + | Two peaks at 1173.2374 keV and 1332.5015 keV | ||
| + | |||
| + | Na22 Spectrum: 1274.532 keV | ||
| + | |||
| + | Na22: http://ie.lbl.gov/toi/nuclide.asp?iZA=110022 | ||
| + | |||
| + | Na22 emits: 0.510998928(11) MeV | ||
| + | |||
| + | {| border="1" |cellpadding="20" cellspacing="0 | ||
| + | |- | ||
| + | | Run Number || Source || Energy (keV) || Fit || | ||
| + | |- | ||
| + | | 5636|| Na-22 || 510.998928 || 1215 || [[File:r5636_511.png | 50 px]] | ||
| + | |- | ||
| + | | 5635 || Co-60 || 1173.2374 || 2709 || [[File:r5635_1173.png | 50 px]] | ||
| + | |- | ||
| + | | 5636 || Na-22 || 1274.532 ||2937 || [[File:r5636_1275.png | 50 px]] | ||
| + | |- | ||
| + | | 5635 || Co-60 || 1332.5015 || 3068|| [[File:r5635_1333.png | 50 px]] | ||
| + | |- | ||
| + | |} | ||
| + | |||
| + | |||
| + | Fit: | ||
| + | |||
| + | :slope = 2.26 +/- 0.003 | ||
| + | :intercept= 62.45 +/- 2.59 | ||
| + | |||
| + | ;Looks like I have 3 keV resolution or less on detector 180-3 | ||
| + | |||
| + | {| border="1" |cellpadding="20" cellspacing="0 | ||
| + | |- | ||
| + | | Run Number || Source || Energy (keV) || Fit || | ||
| + | |- | ||
| + | | 5636|| Na-22 || 510.998928 || 1215 || [[File:r5636Cal_511.png | 50 px]] | ||
| + | |- | ||
| + | | 5635 || Co-60 || 1173.2374 || 2709 || [[File:r5635Cal_1173.png | 50 px]] | ||
| + | |- | ||
| + | | 5636 || Na-22 || 1274.532 ||2937 || [[File:r5636Cal_1275.png | 50 px]] | ||
| + | |- | ||
| + | | 5635 || Co-60 || 1332.5015 || 3068|| [[File:r5635Cal_1333.png | 50 px]] | ||
| + | |- | ||
| + | |} | ||
| + | |||
| + | = Coincidence Tests= | ||
| + | |||
| + | Detector B is in ADC Ch9, TDC18 | ||
| + | |||
| + | |||
| + | Detector 180-2 is in ADC CH5, TDC16 | ||
| + | |||
| + | |||
| + | {| border="1" |cellpadding="20" cellspacing="0 | ||
| + | |- | ||
| + | | Run Number || Description | ||
| + | |- | ||
| + | | 5644 || Na-22 1 uCi Source, set threshold on Ortec Const Fraction Timing Disc model 2035A to 10 mV | ||
| + | |- | ||
| + | | 5645 || Co-60 1 uCi Source, set threshold on Ortec Const Fraction Timing Disc model 2035A to 10 mV | ||
| + | |- | ||
| + | | '''5667''' || '''First Coincidence run''', a coincidence is required in the logic unit, the coincidence window is about 1usec wide (probably a lot of accidentals), source is Co-60 1 uCi, [[File:CPAA_App_080913.png | 50 px]], I have increased the CFD lower threshold to remove, via hardware, photon energies below 800 keV(Detector 180-3 CFD lower threshold was 200 and detector B was 150, the rate was about 6 Hz, run time was 14 minutes 22 seconds | ||
| + | |- | ||
| + | | 5668 || Now the logic unit is switched to OR mode, everything else is the same as run 5667, the rate was about 1 kHz, run time was 14 minutes 25 seconds | ||
| + | |- | ||
| + | | 5669 || Now the logic unit is switched to OR mode, and the CFD lower threshold is reduce to about 100 keV (10 on the CFD lower threshold pot) , everything else is the same as run 5667, the rate was about 3 kHz, run time was 10 minutes, The ROC crashed probably due to the 3 kHz rate. | ||
| + | |- | ||
| + | | 5670 || Now the logic unit is switched to AND mode, and the CFD lower threshold is reduce to about 100 keV (10 on the CFD lower threshold pot) , everything else is the same as run 5667, the rate was about 100 Hz, run time was 13 minutes 56 seconds | ||
| + | |- | ||
| + | | 5671 || same as run 5670 but now there is a 100 uCi Co-60 source, the rate was about 10 Hz, run time was 1 minutes, I think there is a lot of pile up so ignore this run | ||
| + | |- | ||
| + | | 5672 || same as run 5670 but now there is NO source, the rate was about 2 Hz, run time was 20 hours 6 minutes, The coincidence window of 1 usec seems to be way to wide. | ||
| + | |- | ||
| + | | 5673 || same as run 5667 but now the coincidence window is reduced from 1 usec to 10 ns, the rate was about 9 Hz, run time was 11 minutes, 32 seconds. | ||
| + | |- | ||
| + | | 5674 || same as run 5667 but now the Logic unit is in OR mode and the CFD output pulse width is 5 ns using a leading edge discriminator, the rate was about 3 kHz, run time was 1 minutes, 27 seconds. | ||
| + | |- | ||
| + | | 5675 || same as run 5673 but now the CFD output pulse width is 200 ns using a leading edge discriminator, the rate was about 70 Hz, run time was 8 minutes, 25 seconds. | ||
| + | |- | ||
| + | | 5676 || same as run 5674 but now the source is 100 nCi instead of 1 uCi, the CFD output pulse width is 2 ns using a leading edge discriminator, the rate was about 700 Hz, run time was minutes, seconds. | ||
| + | |- | ||
| + | | 5685 || same as run 5676 but the logic module is in AND mode, the CFD output pulse width is 100 ns using a leading edge discriminator, the rate was about 10 Hz, run time was 14 minutes, 1 seconds. | ||
| + | |- | ||
| + | | 5686 || same as run 5676 but the logic module is in OR mode, the CFD output pulse width is 100 ns using a leading edge discriminator, run time was 4 minutes, seconds. Something wrong with the readout, I see 4 peaks for Co-60 when there were only 2 in other runs (Maybe deadtime is too high and I am getting pile up?) | ||
| + | |- | ||
| + | | 5687 || same as run 5685 but source is Na-22 1 uCi, the CFD output pulse width is 100 ns using a leading edge discriminator, the rate was about Hz, run time was 4 minutes, seconds. | ||
| + | |- | ||
| + | | 5688 || same as run 5687 but increase low energy discrimination from 10 to 15, the CFD output pulse width is 100 ns using a leading edge discriminator, the rate was about Hz, run time was minutes, seconds. | ||
| + | |- | ||
| + | | 5689 || same as run 5687 but increase low energy discrimination from 15 to 30, the CFD output pulse width is 100 ns using a leading edge discriminator, the rate was about Hz, run time was minutes, seconds. | ||
| + | |- | ||
| + | | 5691 || same as run 5689 but source is now 1 uCi Co-60, the rate was about 2680 Hz, run time was minutes, seconds. | ||
| + | |- | ||
| + | | 5692 || same as run 5691 but Logic unit is in AND mode now, the rate was about 50 Hz, run time was 5 minutes, 54seconds. refill Det B with LN2 | ||
| + | |- | ||
| + | | 5693 || same as run 5692 , the rate was about 50 Hz, run time was 3hours 14 minutes, 56 seconds. first run after filling Det B with LN2 | ||
| + | |- | ||
| + | | 5694 || same as run 5692 but now the time window is < 2 ns, the rate was about 0.2 Hz, run time was 17 hours 41 minutes, 46 seconds. This run suggests a 12 nsec delay is needed for TDC16 (Detector 180-2). I will use the CFD for Detector 180-2 to delay the signal by 12 nsec. | ||
| + | |- | ||
| + | |} | ||
| + | |||
| + | 5679, Copper Irradiated for 1 hour at 40 Mev, 1 kW | ||
| + | |||
| + | |||
| + | ;Calibration using Run 5689 and 5691 | ||
| + | : | ||
| + | |||
| + | {| border="1" |cellpadding="20" cellspacing="0 | ||
| + | |- | ||
| + | | Detector || Ntuple Channel || slope (kev/chan) || y-int (chan) | ||
| + | |- | ||
| + | | B || ADC9 || 1.6624 +/- 0.00344072 || 39.8968 +/- 3.58784 | ||
| + | |- | ||
| + | | 180-2 || ADC5 || 2.11785 +/- 0.00169804 ||62.5234 +/- 1.77065 | ||
| + | |- | ||
| + | |} | ||
| + | |||
| + | [[CPAA_r5691-5693]] | ||
| + | |||
| + | ;The Canbera Constant Fracting TIming SCA Model 2035A has an unadjustable output width of 600 ns | ||
| + | |||
| + | ;Apparatus change | ||
| + | : move detectors farther away from sample to reduce DAQ rate for 1 uCi source | ||
| + | :detectors are about 7" away from the source | ||
| + | |||
| + | {| border="1" |cellpadding="20" cellspacing="0 | ||
| + | |- | ||
| + | | Run Number || Description | ||
| + | |- | ||
| + | | 5700 || 1uCi Co-60 source serial # 129739, CFD width is 2 nsec, logic unit in OR mode, 2800 Volts on Detector 180-3, 4500 volts on Detector B, rate is about 650 Hz, runtime was 6 min 18 seconds | ||
| + | |- | ||
| + | | 5701 || same as run 5700 but NO source, rate is about 300 Hz, runtime was min seconds | ||
| + | |- | ||
| + | | 5702 || same as run 5700 but NO source and Coincidence is required, rate is about 0 Hz, runtime was 21 hours 54 min 29 seconds, 149 events, TDC window width was 2ns | ||
| + | |- | ||
| + | |} | ||
| + | |||
| + | =Proposed Apparatus= | ||
| + | |||
| + | |||
| + | We propose to acquire two 14 bit digitizers (flash ADCs), a muli-hit time-to-digital converter, and the associated NIM electronics needed to supplement our current VME based data acquisition system. The availability of precision analog digitizers and pipeline time to digital converters allows the construction of a data acquisition system to record the pulse shape and time information that will allow the reconstruction of individual coincidence events. The most common method used to record photon spectroscopy information does so by accumulating events thereby loosing any temporal information. We propose a coincidence counting system which records the wave form of each coincidence event along with a time stamp. The system will allow a post data taking analysis that can increase the coincidence time constraint beyond the original requirement and ascertain the degree of confidence in identifying the decay under consideration. | ||
| + | |||
| + | =Isotopes for CPAA= | ||
| + | |||
| + | ==Au== | ||
| + | |||
| + | $50 flame tests can measure concentrations down to 100 PPM | ||
| + | |||
| + | ===Photon based exitation=== | ||
| + | |||
| + | A photon excites Au-196 natural gold to the | ||
| + | |||
| + | |||
| + | ===neutron knockout=== | ||
| + | Knock a neutron out of natural gold such that an excited state of Au-196 remains that will undergo electron capture to Pt-196 with a half life of 6 days or 2% of the time it can be left in a meta stable state with two possible half lifes of 8 seconds or 9 hours. | ||
| + | |||
| + | <math>{197 \atop\; }Au (\gamma,n){196 \atop \; }Au</math> | ||
| + | |||
| + | Neutron Separation Energy= Energy needed to liberate a neutron from the Nucleus | ||
| + | :=<math>S_n = B({197 \atop 79} Au_{118})-B({{196} \atop 79} Au_{117})</math> | ||
| + | :<math>\left [79(1.007825 u) + 118 (1.008665 u) - 196.97 u\right ] \frac{931.5 MeV}{u} -\left [79(1.007825 u) + 117 (1.008665 u) - 195.967 u\right ] \frac{931.5 MeV}{u}</math> | ||
| + | :<math>=\left [(1.008665 u) - 196.9665516 u+ 195.9665513 u\right ] \frac{931.5 MeV}{u} = 5.3 MeV</math> | ||
| + | |||
| + | |||
| + | ====Au-196 Meta state==== | ||
| + | The 8 sec metastable state of Au-196 decays through the emission of only one 84.66 keV photon. | ||
| + | |||
| + | The 9.6 hour metastable state has high intensity gamma lines at 147.81 keV and 188.27 keV. The 147.81 and the 188.27 are in coincidence. | ||
| + | |||
| + | ====Pt-196 decay EC decay==== | ||
| + | |||
| + | |||
| + | |||
| + | <math>{196 \atop \; }Au \rightarrow {196 \atop \; }Pt^* </math> with a half life of 6 days. | ||
| + | |||
| + | The Pt-196 has a 355.73 dominant (100% relative intensity) gamma line that goes to the 256.2 state giving off a 97.3 keV photon | ||
| + | |||
| + | ===proton knockout=== | ||
| + | |||
| + | |||
| + | <math>{197 \atop\; }Au-79 (\gamma,p){196 \atop \; }Pt-78</math> | ||
| + | |||
| + | =Filling Ln2 = | ||
| + | |||
| + | |||
| + | |||
| + | {| border="1" |cellpadding="20" cellspacing="0 | ||
| + | |- | ||
| + | | Date || Detector || | ||
| + | |- | ||
| + | | 8/7/13 || B || I filled Detector B for 20 minutes with the valve open 1/2 turn and the detector completely warm. | ||
| + | |- | ||
| + | | 8/8/13 || B || Detector B was still cold after 26 hours, I filled it at 1/2 turn flow rate for 15 minutes | ||
| + | |- | ||
| + | |} | ||
| + | |||
| + | |||
| + | =Configuring setup for Gold= | ||
| + | We need to measure photon energies ranging from 80 to 200 keV. There is a lot of background at the low energies so we should try to install shielding and increase the Ortec amplification to the Co-60 lines so they are at the upper limit of the ADC. | ||
| + | |||
| + | ;Increased amplification and decrease CFD lower threshold so the PADC range covered photon energies between 100 and 1300 keV. | ||
| + | |||
| + | |||
| + | |||
| + | ==Calibration== | ||
| + | |||
| + | ;Calibration using Co-60 and Na-22 in Run 5707 | ||
| + | : | ||
| + | |||
| + | {| border="1" |cellpadding="20" cellspacing="0 | ||
| + | |- | ||
| + | | Detector || Ntuple Channel || slope (kev/chan) || y-int (chan) | ||
| + | |- | ||
| + | | B || ADC9 || 2.62335 +/- 0.00292256 || 33.551 +/- 3.04752 | ||
| + | |- | ||
| + | | 180-2 || ADC5 || 2.82207 +/- 0 || 62.1537 +/- 0 | ||
| + | |- | ||
| + | |} | ||
| + | |||
| + | Calibration runs | ||
| + | |||
| + | |||
| + | {| border="1" |cellpadding="20" cellspacing="0 | ||
| + | |- | ||
| + | | Source || Energies (keV, in order of decreasing intensity) | ||
| + | |- | ||
| + | | Mn-54 || 834.848 | ||
| + | |- | ||
| + | | Cd-109|| 88.0336 | ||
| + | |- | ||
| + | | Eu-152|| 121.7817,1408.006, 1112.069, 1085.869, 244.6975 | ||
| + | |- | ||
| + | | Ba-133|| 356.0134, 80.9971, 302.8510, 276.3997 | ||
| + | |- | ||
| + | | Co-57|| 122.06065, 136.47356, | ||
| + | |- | ||
| + | | Cs-137|| 661.657 | ||
| + | |- | ||
| + | | Co-60|| 1332.501, 1173.237 | ||
| + | |- | ||
| + | | Na-22|| 1274.53 | ||
| + | |} | ||
| + | |||
| + | |||
| + | {| border="1" |cellpadding="20" cellspacing="0 | ||
| + | |- | ||
| + | | Run # || Source(s) | ||
| + | |- | ||
| + | | 5708 || Na-22, Co-60, CS-137, Co-57, Ba-133, Eu-152, Cd-109, Mn-54 | ||
| + | |- | ||
| + | | 5709|| Cd-109, Mn-54, The 834 line from Mn-54 is clear but no the 88 keV line from Cd-109 | ||
| + | |- | ||
| + | | 5710|| Ba-133, has a nice strong line at 81 keV | ||
| + | |- | ||
| + | | 5711|| Co-57, The 122 line is clear in Det B but not detector 180-2, I dont see the 136 line in either detector | ||
| + | |- | ||
| + | | 5712|| Eu-152, very clear line at 122 keV | ||
| + | |- | ||
| + | | 5713|| Eu-152,Ba-133, & Co-57 | ||
| + | |- | ||
| + | |} | ||
| + | |||
| + | ;Calibration using Co-60, Na-22 , Ba-133, Co-60 | ||
| + | : | ||
| + | |||
| + | {| border="1" |cellpadding="20" cellspacing="0 | ||
| + | |- | ||
| + | | Detector || Ntuple Channel || slope (kev/chan) || y-int (chan) | ||
| + | |- | ||
| + | | B || ADC9 || 2.61747 +/- 0.00179257|| 39.8 +/- 1.19887 | ||
| + | |- | ||
| + | | 180-2 || ADC5 || 2.82182 +/- 0 || 62.3096 | ||
| + | |- | ||
| + | |} | ||
| + | |||
| + | |||
| + | ;I would use Ba-133, EU-152, & Co-57 to calibrate for the 147 & 188 keV lines in Gold. | ||
| + | |||
| + | |||
| + | ;Det B has better resolution than 180-2 at lower energies | ||
| + | |||
| + | ==Coincidence== | ||
| + | |||
| + | Eu-152 has concidence lines for | ||
| + | |||
| + | 117 & 109 | ||
| + | |||
| + | 120 & 109 | ||
| + | |||
| + | |||
| + | Ba-133 has coincidence lines for 361 & 83 | ||
| + | ===Coincidence lines for Ba-133=== | ||
| + | |||
| + | #276 && 306 keV lines http://www.nndc.bnl.gov/nsr/nsrlink.jsp?1995JU02 | ||
| + | #Ba-132 83 && 360 http://www.nndc.bnl.gov/nsr/nsrlink.jsp?1996KU01 http://www.nndc.bnl.gov/nsr/nsrlink.jsp?2002GA01 | ||
| + | #Ba-132 383 && 515 http://www.nndc.bnl.gov/nsr/nsrlink.jsp?1975GI11 | ||
| + | |||
| + | === Coincidence lines for Eu-152=== | ||
| + | #Eu-151 244 & 344 keV http://www.nndc.bnl.gov/nsr/nsrlink.jsp?1977DR04 | ||
| + | |||
| + | |||
| + | {| border="1" |cellpadding="20" cellspacing="0 | ||
| + | |- | ||
| + | | Run || Description|| | ||
| + | |- | ||
| + | | 5715 || Coincidences for Ba-133 & Eu-152 10 uCi sources The CFD widths were 10 nsec making the coincidence window 20 nsec. running time 13 hrs , 10 min, 30 sec. Rate was 4 Hz | ||
| + | |- | ||
| + | | 5716 || Coincidences for Ba-133 10 uCi source. The CFD widths were 10 nsec making the coincidence window 20 nsec. running time 7 hrs , 33 min, 14sec. Rate was 1 Hz | ||
| + | |- | ||
| + | | 5718 || Logic Unit in '''OR''' mode for Ba-133 10 uCi source. The CFD widths were 10 nsec making the coincidence window 20 nsec. running time 2 min, 5 sec. Rate was 4 kHz [[File:r5716-5718_Ba-133Coinc.png | 200 px]] [[r5718-5716_Ba133Analysis]] | ||
| + | |- | ||
| + | | 5719 || Logic Unit in '''OR''' mode for Eu-152 10 uCi source. The CFD widths were 10 nsec making the coincidence window 20 nsec. running time 3min, 54 sec. Rate was 5 kHz | ||
| + | |- | ||
| + | | 5720 || Logic Unit in '''AND''' mode for Eu-152 10 uCi source. The CFD widths were 10 nsec making the coincidence window 20 nsec. running time 22 hrs, 31 min, 19 sec. Rate was 2.3 Hz | ||
| + | |- | ||
| + | |} | ||
| + | |||
| + | =Au+sand in Crucibles= | ||
| + | |||
| + | ==Pre-Irradiation Measurements== | ||
| + | {| border="1" |cellpadding="20" cellspacing="0 | ||
| + | |- | ||
| + | | Run || Description|| | ||
| + | |- | ||
| + | | 5721 || Logic Unit in '''OR''' mode for Au+Sand sample #5 (Target ID 130028). The CFD widths were 10 nsec making the coincidence window 20 nsec. running time 37 min, 59 sec. Rate was 544 Hz | ||
| + | |- | ||
| + | | 5722 || Logic Unit in '''AND''' mode for Au+Sand sample #5 (Target ID 130028). The CFD widths were 10 nsec making the coincidence window 20 nsec. running time 16 hours 44 min, 43 sec. Rate was 0.01 Hz, Det B (ADC9) warmed up and tripped during the night, the detetor's dewar will not last more than 30 hours, fill it every 24 hours. | ||
| + | |- | ||
| + | | 5725 || Logic Unit in '''AND''' mode for Sand+crucible blank sample (Target ID 130033). The CFD widths were 10 nsec making the coincidence window 20 nsec. running time 16 hours 13 min, 30 sec. Rate was 0.1 Hz | ||
| + | |- | ||
| + | | 5726 || Logic Unit in '''OR''' mode for Sand+crucible blank sample (Target ID 130033). The CFD widths were 10 nsec making the coincidence window 20 nsec. running time 30 min, 47 sec. Rate was 563 Hz | ||
| + | |- | ||
| + | | 5727 || Logic Unit in '''OR''' mode for Au+Sand sample #5 (Target ID 130028). The CFD widths were 10 nsec making the coincidence window 20 nsec. running time min, sec. Rate was Hz | ||
| + | |- | ||
| + | | 5728 || Logic Unit in '''AND''' mode for Au+Sand sample #5 (Target ID 130028). The CFD widths were 10 nsec making the coincidence window 20 nsec. running time 19 hours, 52 min, 41 sec. Rate was 0.09 Hz | ||
| + | |- | ||
| + | | 5729 || Logic Unit in '''AND''' mode No SAMPLE. The CFD widths were 10 nsec making the coincidence window 20 nsec. running time 1 hours, 41 min, 5 sec. Rate was 0.07 Hz | ||
| + | |- | ||
| + | | 5730 || Logic Unit in '''AND''' mode No SAMPLE. The CFD widths were 10 nsec making the coincidence window 20 nsec. running time hours, min, sec. Rate was 0.07 Hz | ||
| + | |- | ||
| + | |} | ||
| + | |||
| + | |||
| + | I see a coincidence line at 1274 +/- 4 keV and 511 +/- 1 keV 70 days after irradiating the Gold+Sand and the blank sample. | ||
| + | |||
| + | |||
| + | <math>{22\atop 11 }Na \rightarrow {22 \atop 10 }Ne^* + \beta + \nu_e \rightarrow {22 \atop 10 }Ne + \gamma (1275 keV)</math> | ||
| + | |||
| + | The excited state of Ne-22 lasts only 3.6 ps before emitting the 1275 gamma so you can see the 1275 in coincidence with the 511. Since the Ne-22 is in an excited state the photon direction is not correlated with the positron emission. Na-22 has a 2.6 year half life. | ||
| + | |||
| + | |||
| + | ;I notice the photon energy observed in the coincidence measurement is 4 keV lower than the singles. | ||
| + | |||
| + | ;In the Ba-133 runs #5716 and #5718 I see the 355 line shift down by 1 keV in the coincidence measurements. | ||
| + | |||
| + | ;The 511 peak shifts down by 1keV in the coincidence measurements of run 5722 compares to the singles run # 5721 | ||
| + | |||
| + | ;:It seems my energy measurement accuracy is +/- 2 keV at best. | ||
| + | |||
| + | |||
| + | ;Will the Na-22 line be useful for normalizing? | ||
| + | |||
| + | |||
| + | ==8/16/13 Au irradiation== | ||
| + | |||
| + | I had to choose between a low irradiation dose and being able to measure the spectrum 3 hours after irradiation, or a very high dose and measuring the spectrum after 55 hours (~6, 9 hour half lives). | ||
| + | |||
| + | A chose to first measure after the low irradiation dose. We waited 45 minutes after the 1 hour irradiation before entering the hall to retrieve the samples. | ||
| + | |||
| + | |||
| + | Irradiated Gold using Jack. | ||
| + | |||
| + | 120 Hz, 42 MeV, 50 uA, 8 microsecond pulse width. | ||
| + | |||
| + | Gold+Sand+Crucible samples were irradiated for 1 hour. | ||
| + | |||
| + | Samples were located outside the hot cell at the rear near the mirror. The were about 6" away from beam center. | ||
| + | |||
| + | Removed from cell at 3:14 | ||
| + | |||
| + | Sample Target ID numbers were changed | ||
| + | |||
| + | Gold + Sand + crucible = Sample # 5 = Target ID #130028 =130097 | ||
| + | |||
| + | Sand + Crucible = Blank = Target ID #130033 =130096 | ||
| + | |||
| + | Samples stored in source room bin A-48 | ||
| + | |||
| + | |||
| + | {| border="1" |cellpadding="20" cellspacing="0 | ||
| + | |- | ||
| + | | Run || Description|| | ||
| + | |- | ||
| + | | 5731 || Logic Unit in '''OR''' mode for Au+Sand+crucible blank sample (Target ID 130097). The CFD widths were 10 nsec making the coincidence window 20 nsec. running time 37 min, 44 sec. Rate was 660 Hz ( 100 Hz more than before Irrdiation), I see lines at 853 & 1370 keV that were not in background run 5721, 511 keV photon events have a higher rate if you compare the relative 511 rates between run 5731 and run 5721. | ||
| + | |- | ||
| + | | 5732 || Logic Unit in '''OR''' mode for Sand+crucible blank sample (Target ID 130096). The CFD widths were 10 nsec making the coincidence window 20 nsec. running time min, sec. Rate was 619 Hz ( 100 Hz more than before Irrdiation),The 853 and 1370 lines also appear in the blank sample (Aluminum in the crucible?) | ||
| + | |- | ||
| + | | 5734 || Logic Unit in '''AND''' mode for Au+Sand+crucible blank sample (Target ID 130097). The Discriminator widths were changed from 10 ns to 400 nsec making the coincidence window 800 nsec(The CFD width to the TDC is 20 nsec and not adjustable). running time 25 hours 17 min, 57 sec. Rate was 1.4 Hz | ||
| + | |- | ||
| + | |} | ||
| + | |||
| + | |||
| + | Run 5734 shows two lines at 586 & 612 keV | ||
| + | |||
| + | |||
| + | |||
| + | ntuple->Draw("(ADC5-62.1537)/2.82207 >>(4096,0,4096)"); | ||
| + | |||
| + | ntuple->Draw("(ADC9-39.8)/2.61747 >>(4096,0,4096)","abs(TDC16-TDC18)<400") | ||
| + | |||
| + | |||
| + | ==8/22/13 Activation == | ||
| + | |||
| + | [[PAA_8-22-13]] | ||
| + | |||
| + | |||
| + | [[PAA_11-11-13]] | ||
| + | |||
| + | =Na-22 Coincidence?= | ||
| + | |||
| + | {| border="1" |cellpadding="20" cellspacing="0 | ||
| + | |- | ||
| + | | Run || Description|| | ||
| + | |- | ||
| + | | 5697 || Coincidences for Na-22 source serial #129742 were observed, a 511 and a 1271(4?) were observed in coincidence. This confirms the Na-22 signal seen in the Sand+Gold samples. The 1271 peak is shiftwed from the 1274 peak shown in run 5698. The CFD widths were 2 nsec making the coincidence window 4 nsec. running time 3hrs , 6 min, 30 sec. Rate was 0.3 Hz | ||
| + | |- | ||
| + | | 5698 || singles for Na-22 source serial # were measured. rate was 2 kHz | ||
| + | |- | ||
| + | |} | ||
| + | |||
| + | =NaI & HpGe Coinc= | ||
| + | |||
| + | ==Setup== | ||
| + | |||
| + | [[CAA_NaI_HpGe_CoinSetup]] | ||
| + | |||
| + | ==Runs== | ||
| + | |||
| + | [[10312013_TestRun]] | ||
[[TF_CPAA_Log]][[TF_CPAA_Patents]][[PAA_Research]] | [[TF_CPAA_Log]][[TF_CPAA_Patents]][[PAA_Research]] | ||
Latest revision as of 17:35, 7 January 2014
ADC non-linearity
Canberra Model 9615 < 0.04% (integral) over 2usec
Canberra Model 9633 < 0.025% (integral) < 0.9% (differential), +10V range into 1kOhm, 8192 channels (13 bit), 100 usec signal width => 100 pC/chan
CAEN V792 < 0.1% (integral), 200 fC/chan
CAEN digitizer VX1492, 14 bit, 10 Volt range
CAEN V1720:
Coinc Scope pictures
First pict with ADC gate
Pics using Spec Amps only and Peak Sensing ADC
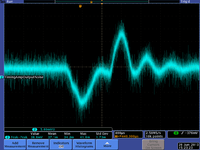
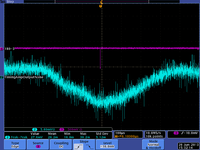
Below is a picture of the spec amp ouput which is send to the Peak sensing ADC. The pulse is over 5 usec long indicating that pile up will happen when the detected incident particle rate is 1/5usec = 200 kHz. Pile up can also happen at lower rates so keep the singles counting rate below 10 kHz by moving the source farther away or waiting a few half lives.
Pics using noising inverting amps
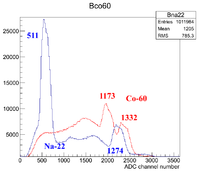
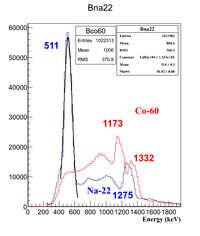
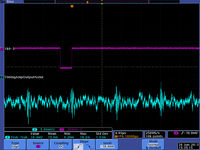
Two HpGe detectors were used to detect coincidence gammas from Co-60 on 6/14/2013.
Co-60 will beta decay to Ni-60 giving off two gammas in coincidence having energies of 1173 and 1332.5 keV. The scope pictures below record the pulses from the HpGe detector that are in coincidence. I would have expected the charge output by the HpGe detector to be similar for the two gammas, but there are some that have less than half the charge. The could be the beta particles from the decay reaching one of the detectors in coincidence with one of the gammas.
First Singles Spectrum
Detector B
Detector 180-3
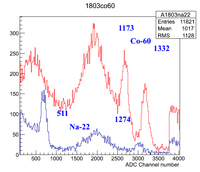
50 keV Energy resolution from an HpGe detector??
I think the inverting amp is too noisy:
The Signal is about 400 mV and the above noise is 37 mV peak-to-peak and it is syncronized with my integrate gate
The voltage variations of the timing amp output in the region of the integrate gate are about +/- 10 mV
Singles Spectrum (2nd attempt)
Using detector 180-3
HV = -2800 Volts
Run 5446, Co-60 and Na-22 sources are in at the same time, attenuation is 18 db, 1 Mev photon peaks are around 3000 -> 3500 channels in ADC spectrum
Two Co-60 Lines
Mean 2.94555e+03 +/- 7.23197e-01 Sigma 7.61455e+01 +/- 8.86697e-01
Mean 3.63275e+03 +/- 8.39279e-01 Sigma 7.45542e+01 +/- 1.04796e+00
1.2 meV na-22 line
Mean 3.37891e+03 +/- 1.07859e+00 Sigma 6.26450e+01 +/- 1.73063e+00
Run 5447, Na-22 source, attenuation is 18 db, 1 Mev photon peaks are around 3000 -> 3500 channels in ADC spectrum Mean 3.38431e+03 +/- 1.29456e-01 Sigma 1.12914e-01 +/- 2.59220e-02
Run 5448, Na-22 source, attenuation is 14 db, 0.511 Mev photon peaks are around 1000 channels in ADC spectrum
Run 5449, Na-22 source, attenuation is 12 db, 0.511 Mev photon peaks are around 2500 channels in ADC spectrum
Mean 2.60181e+03 +/- 8.10190e-01 Sigma 5.97964e+01 +/- 6.63405e-01
Run 5450, Co-60 source, attenuation is 12 db, 1 Mev photon peaks are around 3000-> overflow channels in ADC spectrum
Run 5451, Co-60 source, attenuation is 13 db, 1 Mev photon peaks are around 2500 -> 3500 channels in ADC spectrum
Low energy 1.2 MeV peak
Mean 2.64173e+03 +/- 1.35816e+00 Sigma 1.03518e+02 +/- 1.49690e+00
High energy 1.3 MeV peak Mean 3.33157e+03 +/- 1.36696e+00 Sigma 1.01444e+02 +/- 1.15611e+00
Run 5452, Na-22 source, attenuation is 13 db, 1 Mev photon peaks are around 2500 -> 3500 channels in ADC spectrum
Mean 3.02266e+03 +/- 1.53757e+00 Sigma 5.26142e+01 +/- 1.61646e+00
Run 5453, NO source, attenuation is 13 db, 1 Mev photon peaks are around 2500 -> 3500 channels in ADC spectrum, run started at 17:18:27 on July 23 ended on July 24 at 15:34:05
Run 5484, Na-22 and Co-60 source, attenuation is 14 db, 1 Mev photon peaks are around 2600 -> 3600 channels in ADC spectrum, Na-22 and Co-60 peaks are separable unlike in detector B
Run 5484, Na-22 source, attenuation is 8 db, 0.5 Mev photon peaks are around 2000 channels in ADC spectrum
Using detector B
HV = +4520 Volts
Run 5466, Na-22 source, attenuation is 17 db, 1 Mev photon peaks are around 2300 channels in ADC spectrum
Run 5470, Co-60 source, attenuation is 17 db, 1 Mev photon peaks are around 2300 channels in ADC spectrum
Run 5471 & 5472, Na-22 and Co-60 sources both in, attenuation is 17 db, 1 Mev photon peaks are around 2300 channels in ADC spectrum
Run 5474, Na-22 source, attenuation is 12 db, 0.5 Mev photon peaks are around 1000 channels in ADC spectrum
- The above runs used the same input lines that were used for detector 180-3, Now I put Detector B through its own signal lines and the attenuation needed changes
Run 5477, Na-22 source, attenuation is 9 db, 1 Mev photon peaks are around 3000 channels in ADC spectrum
Run 5478, Co-60 source, attenuation is 9 db, 1 Mev photon peaks are around 3000 channels in ADC spectrum
Run 5480, Na-22 source, attenuation is 3 db, 0.5 Mev photon peaks are around 1500 channels in ADC spectrum
Singles SPectrum 3rd attempt (Peak sensing ADC)
Using the CAEN 785 peak sensing ADC I was able to increase the dynamic range and take positive going pulses.
Below are the first two spectra with sources and almost no discrimination
Detector 180-3
Calibration Fit
Spectrum of 60Co, peaks at 1.17 and 1.33 MeV
Co60: http://ie.lbl.gov/toi/nuclide.asp?iZA=270060
Two peaks at 1173.2374 keV and 1332.5015 keV
Na22 Spectrum: 1274.532 keV
Na22: http://ie.lbl.gov/toi/nuclide.asp?iZA=110022
Na22 emits: 0.510998928(11) MeV
| Run Number | Source | Energy (keV) | Fit | |
| 5636 | Na-22 | 510.998928 | 1215 | |
| 5635 | Co-60 | 1173.2374 | 2709 | |
| 5636 | Na-22 | 1274.532 | 2937 | |
| 5635 | Co-60 | 1332.5015 | 3068 |
Fit:
- slope = 2.26 +/- 0.003
- intercept= 62.45 +/- 2.59
- Looks like I have 3 keV resolution or less on detector 180-3
| Run Number | Source | Energy (keV) | Fit | |
| 5636 | Na-22 | 510.998928 | 1215 | |
| 5635 | Co-60 | 1173.2374 | 2709 | |
| 5636 | Na-22 | 1274.532 | 2937 | |
| 5635 | Co-60 | 1332.5015 | 3068 |
Coincidence Tests
Detector B is in ADC Ch9, TDC18
Detector 180-2 is in ADC CH5, TDC16
5679, Copper Irradiated for 1 hour at 40 Mev, 1 kW
- Calibration using Run 5689 and 5691
| Detector | Ntuple Channel | slope (kev/chan) | y-int (chan) |
| B | ADC9 | 1.6624 +/- 0.00344072 | 39.8968 +/- 3.58784 |
| 180-2 | ADC5 | 2.11785 +/- 0.00169804 | 62.5234 +/- 1.77065 |
- The Canbera Constant Fracting TIming SCA Model 2035A has an unadjustable output width of 600 ns
- Apparatus change
- move detectors farther away from sample to reduce DAQ rate for 1 uCi source
- detectors are about 7" away from the source
| Run Number | Description |
| 5700 | 1uCi Co-60 source serial # 129739, CFD width is 2 nsec, logic unit in OR mode, 2800 Volts on Detector 180-3, 4500 volts on Detector B, rate is about 650 Hz, runtime was 6 min 18 seconds |
| 5701 | same as run 5700 but NO source, rate is about 300 Hz, runtime was min seconds |
| 5702 | same as run 5700 but NO source and Coincidence is required, rate is about 0 Hz, runtime was 21 hours 54 min 29 seconds, 149 events, TDC window width was 2ns |
Proposed Apparatus
We propose to acquire two 14 bit digitizers (flash ADCs), a muli-hit time-to-digital converter, and the associated NIM electronics needed to supplement our current VME based data acquisition system. The availability of precision analog digitizers and pipeline time to digital converters allows the construction of a data acquisition system to record the pulse shape and time information that will allow the reconstruction of individual coincidence events. The most common method used to record photon spectroscopy information does so by accumulating events thereby loosing any temporal information. We propose a coincidence counting system which records the wave form of each coincidence event along with a time stamp. The system will allow a post data taking analysis that can increase the coincidence time constraint beyond the original requirement and ascertain the degree of confidence in identifying the decay under consideration.
Isotopes for CPAA
Au
$50 flame tests can measure concentrations down to 100 PPM
Photon based exitation
A photon excites Au-196 natural gold to the
neutron knockout
Knock a neutron out of natural gold such that an excited state of Au-196 remains that will undergo electron capture to Pt-196 with a half life of 6 days or 2% of the time it can be left in a meta stable state with two possible half lifes of 8 seconds or 9 hours.
Neutron Separation Energy= Energy needed to liberate a neutron from the Nucleus
- =
Au-196 Meta state
The 8 sec metastable state of Au-196 decays through the emission of only one 84.66 keV photon.
The 9.6 hour metastable state has high intensity gamma lines at 147.81 keV and 188.27 keV. The 147.81 and the 188.27 are in coincidence.
Pt-196 decay EC decay
with a half life of 6 days.
The Pt-196 has a 355.73 dominant (100% relative intensity) gamma line that goes to the 256.2 state giving off a 97.3 keV photon
proton knockout
Filling Ln2
| Date | Detector | |
| 8/7/13 | B | I filled Detector B for 20 minutes with the valve open 1/2 turn and the detector completely warm. |
| 8/8/13 | B | Detector B was still cold after 26 hours, I filled it at 1/2 turn flow rate for 15 minutes |
Configuring setup for Gold
We need to measure photon energies ranging from 80 to 200 keV. There is a lot of background at the low energies so we should try to install shielding and increase the Ortec amplification to the Co-60 lines so they are at the upper limit of the ADC.
- Increased amplification and decrease CFD lower threshold so the PADC range covered photon energies between 100 and 1300 keV.
Calibration
- Calibration using Co-60 and Na-22 in Run 5707
| Detector | Ntuple Channel | slope (kev/chan) | y-int (chan) |
| B | ADC9 | 2.62335 +/- 0.00292256 | 33.551 +/- 3.04752 |
| 180-2 | ADC5 | 2.82207 +/- 0 | 62.1537 +/- 0 |
Calibration runs
| Source | Energies (keV, in order of decreasing intensity) |
| Mn-54 | 834.848 |
| Cd-109 | 88.0336 |
| Eu-152 | 121.7817,1408.006, 1112.069, 1085.869, 244.6975 |
| Ba-133 | 356.0134, 80.9971, 302.8510, 276.3997 |
| Co-57 | 122.06065, 136.47356, |
| Cs-137 | 661.657 |
| Co-60 | 1332.501, 1173.237 |
| Na-22 | 1274.53 |
| Run # | Source(s) |
| 5708 | Na-22, Co-60, CS-137, Co-57, Ba-133, Eu-152, Cd-109, Mn-54 |
| 5709 | Cd-109, Mn-54, The 834 line from Mn-54 is clear but no the 88 keV line from Cd-109 |
| 5710 | Ba-133, has a nice strong line at 81 keV |
| 5711 | Co-57, The 122 line is clear in Det B but not detector 180-2, I dont see the 136 line in either detector |
| 5712 | Eu-152, very clear line at 122 keV |
| 5713 | Eu-152,Ba-133, & Co-57 |
- Calibration using Co-60, Na-22 , Ba-133, Co-60
| Detector | Ntuple Channel | slope (kev/chan) | y-int (chan) |
| B | ADC9 | 2.61747 +/- 0.00179257 | 39.8 +/- 1.19887 |
| 180-2 | ADC5 | 2.82182 +/- 0 | 62.3096 |
- I would use Ba-133, EU-152, & Co-57 to calibrate for the 147 & 188 keV lines in Gold.
- Det B has better resolution than 180-2 at lower energies
Coincidence
Eu-152 has concidence lines for
117 & 109
120 & 109
Ba-133 has coincidence lines for 361 & 83
Coincidence lines for Ba-133
- 276 && 306 keV lines http://www.nndc.bnl.gov/nsr/nsrlink.jsp?1995JU02
- Ba-132 83 && 360 http://www.nndc.bnl.gov/nsr/nsrlink.jsp?1996KU01 http://www.nndc.bnl.gov/nsr/nsrlink.jsp?2002GA01
- Ba-132 383 && 515 http://www.nndc.bnl.gov/nsr/nsrlink.jsp?1975GI11
Coincidence lines for Eu-152
- Eu-151 244 & 344 keV http://www.nndc.bnl.gov/nsr/nsrlink.jsp?1977DR04
| Run | Description | |
| 5715 | Coincidences for Ba-133 & Eu-152 10 uCi sources The CFD widths were 10 nsec making the coincidence window 20 nsec. running time 13 hrs , 10 min, 30 sec. Rate was 4 Hz | |
| 5716 | Coincidences for Ba-133 10 uCi source. The CFD widths were 10 nsec making the coincidence window 20 nsec. running time 7 hrs , 33 min, 14sec. Rate was 1 Hz | |
| 5718 | Logic Unit in OR mode for Ba-133 10 uCi source. The CFD widths were 10 nsec making the coincidence window 20 nsec. running time 2 min, 5 sec. Rate was 4 kHz 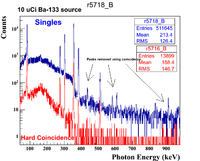 r5718-5716_Ba133Analysis r5718-5716_Ba133Analysis
| |
| 5719 | Logic Unit in OR mode for Eu-152 10 uCi source. The CFD widths were 10 nsec making the coincidence window 20 nsec. running time 3min, 54 sec. Rate was 5 kHz | |
| 5720 | Logic Unit in AND mode for Eu-152 10 uCi source. The CFD widths were 10 nsec making the coincidence window 20 nsec. running time 22 hrs, 31 min, 19 sec. Rate was 2.3 Hz |
Au+sand in Crucibles
Pre-Irradiation Measurements
| Run | Description | |
| 5721 | Logic Unit in OR mode for Au+Sand sample #5 (Target ID 130028). The CFD widths were 10 nsec making the coincidence window 20 nsec. running time 37 min, 59 sec. Rate was 544 Hz | |
| 5722 | Logic Unit in AND mode for Au+Sand sample #5 (Target ID 130028). The CFD widths were 10 nsec making the coincidence window 20 nsec. running time 16 hours 44 min, 43 sec. Rate was 0.01 Hz, Det B (ADC9) warmed up and tripped during the night, the detetor's dewar will not last more than 30 hours, fill it every 24 hours. | |
| 5725 | Logic Unit in AND mode for Sand+crucible blank sample (Target ID 130033). The CFD widths were 10 nsec making the coincidence window 20 nsec. running time 16 hours 13 min, 30 sec. Rate was 0.1 Hz | |
| 5726 | Logic Unit in OR mode for Sand+crucible blank sample (Target ID 130033). The CFD widths were 10 nsec making the coincidence window 20 nsec. running time 30 min, 47 sec. Rate was 563 Hz | |
| 5727 | Logic Unit in OR mode for Au+Sand sample #5 (Target ID 130028). The CFD widths were 10 nsec making the coincidence window 20 nsec. running time min, sec. Rate was Hz | |
| 5728 | Logic Unit in AND mode for Au+Sand sample #5 (Target ID 130028). The CFD widths were 10 nsec making the coincidence window 20 nsec. running time 19 hours, 52 min, 41 sec. Rate was 0.09 Hz | |
| 5729 | Logic Unit in AND mode No SAMPLE. The CFD widths were 10 nsec making the coincidence window 20 nsec. running time 1 hours, 41 min, 5 sec. Rate was 0.07 Hz | |
| 5730 | Logic Unit in AND mode No SAMPLE. The CFD widths were 10 nsec making the coincidence window 20 nsec. running time hours, min, sec. Rate was 0.07 Hz |
I see a coincidence line at 1274 +/- 4 keV and 511 +/- 1 keV 70 days after irradiating the Gold+Sand and the blank sample.
The excited state of Ne-22 lasts only 3.6 ps before emitting the 1275 gamma so you can see the 1275 in coincidence with the 511. Since the Ne-22 is in an excited state the photon direction is not correlated with the positron emission. Na-22 has a 2.6 year half life.
- I notice the photon energy observed in the coincidence measurement is 4 keV lower than the singles.
- In the Ba-133 runs #5716 and #5718 I see the 355 line shift down by 1 keV in the coincidence measurements.
- The 511 peak shifts down by 1keV in the coincidence measurements of run 5722 compares to the singles run # 5721
- It seems my energy measurement accuracy is +/- 2 keV at best.
- Will the Na-22 line be useful for normalizing?
8/16/13 Au irradiation
I had to choose between a low irradiation dose and being able to measure the spectrum 3 hours after irradiation, or a very high dose and measuring the spectrum after 55 hours (~6, 9 hour half lives).
A chose to first measure after the low irradiation dose. We waited 45 minutes after the 1 hour irradiation before entering the hall to retrieve the samples.
Irradiated Gold using Jack.
120 Hz, 42 MeV, 50 uA, 8 microsecond pulse width.
Gold+Sand+Crucible samples were irradiated for 1 hour.
Samples were located outside the hot cell at the rear near the mirror. The were about 6" away from beam center.
Removed from cell at 3:14
Sample Target ID numbers were changed
Gold + Sand + crucible = Sample # 5 = Target ID #130028 =130097
Sand + Crucible = Blank = Target ID #130033 =130096
Samples stored in source room bin A-48
| Run | Description | |
| 5731 | Logic Unit in OR mode for Au+Sand+crucible blank sample (Target ID 130097). The CFD widths were 10 nsec making the coincidence window 20 nsec. running time 37 min, 44 sec. Rate was 660 Hz ( 100 Hz more than before Irrdiation), I see lines at 853 & 1370 keV that were not in background run 5721, 511 keV photon events have a higher rate if you compare the relative 511 rates between run 5731 and run 5721. | |
| 5732 | Logic Unit in OR mode for Sand+crucible blank sample (Target ID 130096). The CFD widths were 10 nsec making the coincidence window 20 nsec. running time min, sec. Rate was 619 Hz ( 100 Hz more than before Irrdiation),The 853 and 1370 lines also appear in the blank sample (Aluminum in the crucible?) | |
| 5734 | Logic Unit in AND mode for Au+Sand+crucible blank sample (Target ID 130097). The Discriminator widths were changed from 10 ns to 400 nsec making the coincidence window 800 nsec(The CFD width to the TDC is 20 nsec and not adjustable). running time 25 hours 17 min, 57 sec. Rate was 1.4 Hz |
Run 5734 shows two lines at 586 & 612 keV
ntuple->Draw("(ADC5-62.1537)/2.82207 >>(4096,0,4096)");
ntuple->Draw("(ADC9-39.8)/2.61747 >>(4096,0,4096)","abs(TDC16-TDC18)<400")
8/22/13 Activation
Na-22 Coincidence?
| Run | Description | |
| 5697 | Coincidences for Na-22 source serial #129742 were observed, a 511 and a 1271(4?) were observed in coincidence. This confirms the Na-22 signal seen in the Sand+Gold samples. The 1271 peak is shiftwed from the 1274 peak shown in run 5698. The CFD widths were 2 nsec making the coincidence window 4 nsec. running time 3hrs , 6 min, 30 sec. Rate was 0.3 Hz | |
| 5698 | singles for Na-22 source serial # were measured. rate was 2 kHz |
