Difference between revisions of "SIDIS CLASNOTE 2013"
| (52 intermediate revisions by 2 users not shown) | |||
| Line 1: | Line 1: | ||
| − | |||
sample TeX file for CLAS note | sample TeX file for CLAS note | ||
| Line 20: | Line 19: | ||
==The CLAS Data Selection== | ==The CLAS Data Selection== | ||
| − | The data files from the EG1b experiment chosen for this analysis are listed in Table 1.1. | + | The data files from the EG1b experiment chosen for this analysis are listed in Table 1.1. The experiment probed polarized NH3 and ND3 targets using longitudinally polarized electrons accelerated to three difference energies; 2.2 GeV, 4.2 GeV and 5.7 GeV. This work analyzed the data collected using a 4.2 GeV electron as this energy provided the most statistics. The restrictions applied to the reconstructed events are described in the sections below. |
{| border="1" style="text-align: center;" align="center" | {| border="1" style="text-align: center;" align="center" | ||
|- | |- | ||
| Line 57: | Line 56: | ||
==Particle Identification== | ==Particle Identification== | ||
| − | Additional tests were performed on the electron and a pion candidates reconstructed by the standard CLAS software package. Electrons are identified by matching the charged particle hits in the Cherenkov counter, electromagnetic calorimeter, and the time of flight system. | + | Additional tests were performed on the electron and a pion candidates reconstructed by the standard CLAS software package RECSIS. Electrons are identified by matching the charged particle hits in the Cherenkov counter (CC), electromagnetic calorimeter (EC), and the time of flight system (ToF). The geometrical and timing constraints described in reference [3] were applied to improve electron identification. Additional constraints are applied on the energy deposited by the particle into the calorimeter and the number of photoelectrons produced in the Cherenkov counter. Charged pions are identified by matching the hits in the drift chamber (DC) and ToF counter along with a requirement that the number of photons observed in the CC be less than two for the pions. |
| − | |||
| − | |||
==Electron Identification== | ==Electron Identification== | ||
| − | |||
| − | |||
| − | |||
| − | |||
| − | |||
| − | |||
| − | |||
| − | |||
| − | |||
| − | |||
| − | |||
| − | |||
| − | |||
| − | |||
| − | |||
| − | |||
| − | |||
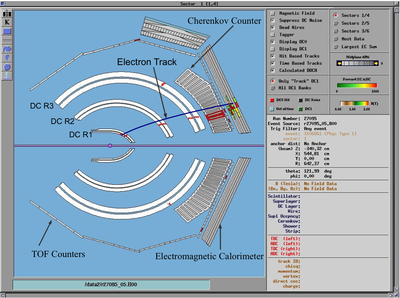
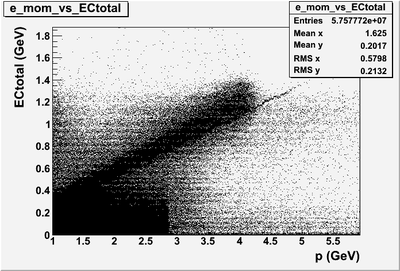
| − | The CLAS trigger system required a particle to deposit energy in the electromagnetic calorimeter and illuminate the Cherenkov counter within a 150 ns time window (Figure 1.1). Unfortunately, this trigger suffers from a back- ground of high energy negative pions that may be misidentified as electrons. The pion contamination of the electron sample is reduced using cuts on the energy deposited in the electromagnetic calorimeter and the momentum | + | The CLAS trigger system required a particle to deposit energy in the electromagnetic calorimeter and illuminate the Cherenkov counter within a 150 ns time window (Figure 1.1). Unfortunately, this trigger suffers from a back- ground of high energy negative pions that may be misidentified as electrons. The pion contamination of the electron sample is reduced using cuts on the energy deposited in the electromagnetic calorimeter and the momentum measured by reconstructing the particles track in the known magnetic field. The total energy deposited by electron in the EC is proportional to their kinetic energy, whereas the energy deposited by pions is relatively independent of their momentum since the pions entering the EC are minimum ionizing particles(Figure 1.2). Geometrical and time matching cuts between the Cherenkov counter hit and the measured track in the drift chamber were developed to suppress the pion background further. |
| Line 92: | Line 72: | ||
===EC CUTS=== | ===EC CUTS=== | ||
| − | The CLAS electromagnetic calorimeter was used to reduce the | + | The CLAS electromagnetic calorimeter was used to reduce the misidentification of negatively charged pions as electron candidates. The electromagnetic calorimeter contains thirteen layers of lead-scintillator sandwiches composed of 2 mm thick lead and 10 mm thick scintillator sections. Each set of thirteen layers is subdivided into five inner and eight outer layers that are named the inner and outer calorimeter respectively. |
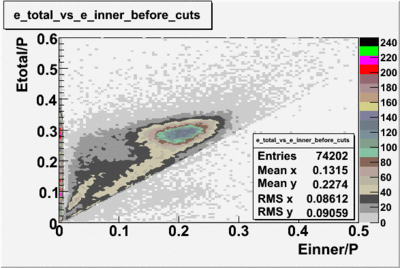
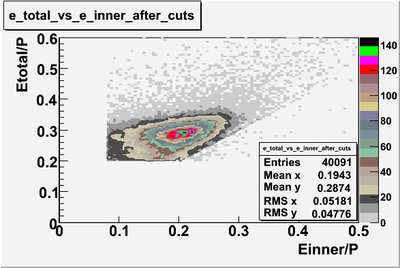
| − | Electrons | + | Electrons interacting with the calorimeter produce electromagnetic showers that release energy into the calorimeter. The deposited energy is proportional to the momentum of the electrons. Figure 1.3 shows the correlation of |
| + | the inner and outer calorimeter electron candidate’s energy measured by the calorimeter and divided by the particles momentum reconstructed by the drift chamber. As shown in Figure 1.3, there is an island near E/p = 0.2, which contains most of the electron candidates as well as some regions below 0.2 which will be argued to be negative pions misidentified as electrons. | ||
| + | Pions entering the calorimeter are typically minimum ionizing particles, loosing little of their incident energy in the calorimeter at a rate of 2 <math>MeV cm^2/g</math>. Electrons, on the other hand, deposit a larger fraction of their momentum into the calorimeter. As a result, the energy deposited into the electromagnetic calorimeter is different for electrons and pions. Pions loose about 0.08 GeV of energy traversing the calorimeter independent their momentum thereby producing a constant signal in the calorimeter around 0.08 GeV. In order to reduce misidentified pions from the electron sample, the following cut | ||
| − | + | {| border="0" style="background:transparent;" align="center" | |
| − | + | |- | |
| − | + | | | |
| + | [[File:ECTOTvsP.png|400px|thumb|'''Figure 1.2''' Reconstructed electron momentum versus the electron energy deposited in the calorimeter (ECtotal).]] | ||
| + | |}<br> | ||
ECinner > 0.08 × p, (1.1) where p represents a particle’s momentum and ECinner the energy deposited | ECinner > 0.08 × p, (1.1) where p represents a particle’s momentum and ECinner the energy deposited | ||
| Line 106: | Line 90: | ||
and results in the following cut for the energy deposition into the outer layer of the calorimeter: | and results in the following cut for the energy deposition into the outer layer of the calorimeter: | ||
ECtot > 0.2 × p. (1.3) | ECtot > 0.2 × p. (1.3) | ||
| − | Cherenkov Counter Cut | + | |
| − | The Cherenkov counter has been used to further reduce the negatively charged pion background in the reconstructed electron sample. When the | + | ===Cherenkov Counter Cut=== |
| + | |||
| + | The Cherenkov counter has been used to further reduce the negatively charged pion background in the reconstructed electron sample. When the velocity of a charged particle is greater than the local phase velocity of light or when it enters a medium with different optical properties, the charged particle can emit photons. Cherenkov light is emitted at the critical angle<math> \theta_c</math> representing the angle of Cherenkov radiation relative to the particle’s direction. It can be | ||
has been applied: | has been applied: | ||
 |  | ||
| − | (a) Before cuts. | + | {| border="0" style="background:transparent;" align="center" |
| − | + | |- | |
| − | Fig. 1.3: ECinner/p versus ECtot/p before and after EC cuts (ECtot > 0.2p and ECinner > 0.08p). After applying EC cuts about 46% of the events have been removed from the electron sample. | + | | |
| + | [[File:E_total_vs_e_inner1_before_cuts_file_dst27070.png|400px|thumb|(a) Before cuts.]] | ||
| + | |}<br> | ||
| + | |||
| + | {| border="0" style="background:transparent;" align="center" | ||
| + | |- | ||
| + | | | ||
| + | [[File:E_total_vs_e_inner1_after_cuts_file_dst27070.png|400px|thumb|(b) After cuts.]] | ||
| + | |}<br> | ||
| + | |||
| + | '''Fig. 1.3''': ECinner/p versus ECtot/p before and after EC cuts (ECtot > 0.2p and ECinner > 0.08p). After applying EC cuts about 46% of the events have been removed from the electron sample. | ||
shown that the cosine of the Cherenkov radiation angle is inversely proportional to the velocity of the charged particle | shown that the cosine of the Cherenkov radiation angle is inversely proportional to the velocity of the charged particle | ||
cosθc = 1 , (1.4) nβ | cosθc = 1 , (1.4) nβ | ||
| Line 122: | Line 118: | ||
threshold velocity βthr = 1 , below which no radiation is emitted. This process n | threshold velocity βthr = 1 , below which no radiation is emitted. This process n | ||
may be used to distinguish between the highly relativistic electrons and the less relativistic pions based on the number of photons produced in the Cherenkov detector. The number of photons produced per unit path length of a particle with charge Ze and per unit energy interval of the photons is proportional to the sine of the Cherenkov angle [2] | may be used to distinguish between the highly relativistic electrons and the less relativistic pions based on the number of photons produced in the Cherenkov detector. The number of photons produced per unit path length of a particle with charge Ze and per unit energy interval of the photons is proportional to the sine of the Cherenkov angle [2] | ||
| − | |||
| − | |||
| − | |||
| − | |||
| − | |||
| − | |||
| − | |||
| − | |||
| − | |||
| + | {| border="0" style="background:transparent;" align="center" | ||
| + | |- | ||
| + | |<math>\frac{d^2 N}{dEdx}=\frac{\alpha z^2}{\hbar c}sin ^2 \theta_c=\frac{\alpha z^2}{\hbar c}[1-\frac{1}{\beta^2 n^2 (E)}]</math> | ||
| + | |}<br> | ||
| + | {| border="0" style="background:transparent;" align="center" | ||
| + | |- | ||
| + | |<math>\frac{d^2 N}{d\lambda dx} = \frac{2 \pi \alpha z^2}{\lambda^2}[1-\frac{1}{\beta^2 n^2 (\lambda)}]</math> | ||
| + | |}<br> | ||
| + | {| border="0" style="background:transparent;" align="center" | ||
| + | |- | ||
| + | |<math>\beta=\frac{v}{c}=\frac{pc}{\sqrt{(pc)^2 + (mc^2)^2}}.</math> | ||
| + | |}<br> | ||
| + | Taylor expanding Eq. 3.6 and keeping only the first two terms we get following<br> | ||
| + | {| border="0" style="background:transparent;" align="center" | ||
| + | |- | ||
| + | |<math>\frac{d^2 N}{dEdx}=\frac{\alpha z^2}{\hbar c}sin ^2 \theta_c=\frac{\alpha z^2}{\hbar c}[\beta^2 n^2 (E) - 1]</math> | ||
| + | |}<br> | ||
| + | |||
| + | |||
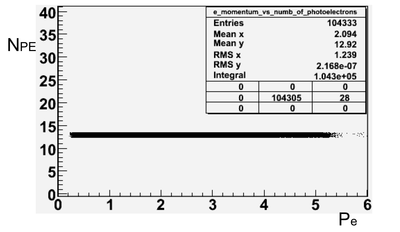
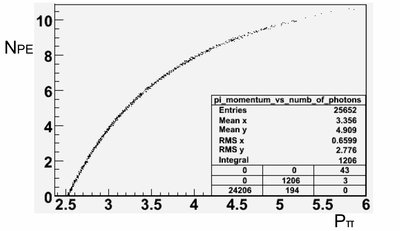
| + | The gas used in the CLAS Cerenkov counter is perfluorobutane C4F10 with an index of refraction equal to 1.00153. Approximately thirteen photoelec- trons are produced by electrons traversing the Cherenkov detector. On the | ||
other hand, calculations show that the number of photons produced by the negatively charged pions in the Cherenkov detector is approximately two. The theoretical results of the number of photons produced by the electrons and pions when passing through the Cherenkov counter are shown on Figure 1.4. | other hand, calculations show that the number of photons produced by the negatively charged pions in the Cherenkov detector is approximately two. The theoretical results of the number of photons produced by the electrons and pions when passing through the Cherenkov counter are shown on Figure 1.4. | ||
| − | |||
| − | |||
| − | |||
| − | |||
| − | |||
| − | Fig. 1.5: The number of photoelectrons without cuts. | + | {| border="0" style="background:transparent;" align="center" |
| − | Fig. 1.6: The total energy deposited into the Calorimeter versus the Number of Photoelectrons. | + | |- |
| − | Geometric and Timing cuts | + | | |
| + | [[File:E_momentum_vs_numb_of_photoelectrons_27095_theory.png|400px|thumb|(a) For electrons.]] | ||
| + | |}<br> | ||
| + | |||
| + | {| border="0" style="background:transparent;" align="center" | ||
| + | |- | ||
| + | | | ||
| + | [[File:Pi_momentum_vs_numb_of_photons_27095_theory.png|400px|thumb|(a) For pions.]] | ||
| + | |}<br> | ||
| + | |||
| + | '''Fig. 1.4''': Theoretical Calculation of the Number of Photoelectrons for electrons and pions.<br> | ||
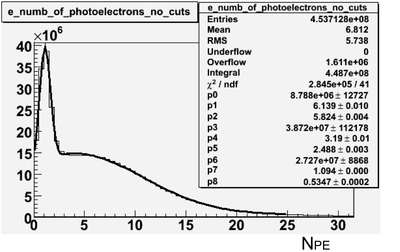
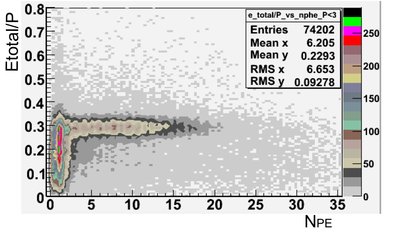
| + | The distribution of the number of photoelectrons measured in the Cherenkov detector and the energy deposition dependence on number of photoelectrons are shown on Figure 1.5 and Figure 1.6. Pions, misidentified as electrons appear on Figure 1.5 at nphe<2.5. | ||
| + | |||
| + | {| border="0" style="background:transparent;" align="center" | ||
| + | |- | ||
| + | | | ||
| + | [[File:Electrons_nphe_without_cuts_all_data_with_fits.png|400px|thumb|'''Fig. 1.5''': The number of photoelectrons without cuts.]] | ||
| + | |}<br> | ||
| + | |||
| + | {| border="0" style="background:transparent;" align="center" | ||
| + | |- | ||
| + | | | ||
| + | [[File:E_total_vs_nphe_momentum_cut_file_dst27070.png|400px|thumb|'''Fig. 1.6''': The total energy deposited into the Calorimeter versus the Number of Photoelectrons.]] | ||
| + | |}<br> | ||
| + | |||
| + | ===Geometric and Timing cuts=== | ||
| + | |||
Negative pions may be produced when the lepton scatters at a polar angle close to zero and is not observed by the detector. In order to reduce the electron sample contamination by those pions, geometrical cuts on the location of the particle at the entrance to the Cherenkov detector and time matching cuts have been developed by Osipenko [3]. For each CLAS Cherenkov detector segment the following cut has been applied | Negative pions may be produced when the lepton scatters at a polar angle close to zero and is not observed by the detector. In order to reduce the electron sample contamination by those pions, geometrical cuts on the location of the particle at the entrance to the Cherenkov detector and time matching cuts have been developed by Osipenko [3]. For each CLAS Cherenkov detector segment the following cut has been applied | ||
| − | | | + | |
| − | where | + | {| border="0" style="background:transparent;" align="center" |
| + | |- | ||
| + | |<math>|\theta_{p} - {\theta_{p}}^{center} - {\theta_{p}}^{offset}| < 3 \sigma_{p}</math> | ||
| + | |}, (1.9) | ||
| + | |||
| + | where <math>\theta_{p}</math> represents the measured polar angle with respect to a projectile plane for each electron event and <math>\sigma_{p}</math> the width of the polar angle <math>\theta_{p}</math>. The Cherenkov counter’s projective plane is an imaginary plane behind the Cherenkov detector where Cherenkov radiation would have arrived if it had moved the same distance from the emission point to the PMT, without reflections in the mirror system. <math>{\theta_{p}}^{center}</math> is the polar angle from the CLAS detector center to the image of Cherenkov counter segment center and <math>{\theta_{p}}^{offset}</math> is the shift in the segment center position. In addition to geometrical cuts, timing cuts have been applied to match the time between a Cherenkov counter hit and the time of flight system.<br> | ||
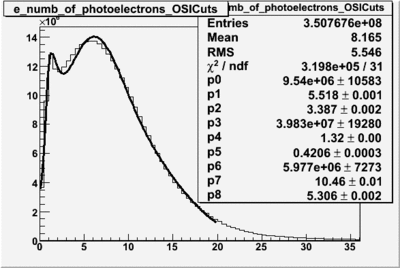
The pion contamination in an electron sample was estimated by fitting the photoelectron distribution using two Gaussian distributions convoluted with a Landau distribution [4]: | The pion contamination in an electron sample was estimated by fitting the photoelectron distribution using two Gaussian distributions convoluted with a Landau distribution [4]: | ||
| − | + | ||
| − | + | {| border="0" style="background:transparent;" align="center" | |
| − | + | |- | |
| + | |<math>N_{PE}= p_0 e^{-0.5 \left (\frac{x-p_1}{p_2} \right )^2} + p4\frac{1}{1-\left(\frac{x-p5}{p6}\right )} + p_6 e^{-0.5 \left (\frac{x-p_7}{p_8} \right )^2}.</math> | ||
| + | |}<br> | ||
| + | (1.10) | ||
| + | |||
The fits in Figure 1.7.(a) suggest that the pion contamination in the electron sample is 9.63% ± 0.01% before applying the OSI cuts and after the OSI cuts the contamination is about 4.029% ± 0.003% (Figure 1.7.(b)). | The fits in Figure 1.7.(a) suggest that the pion contamination in the electron sample is 9.63% ± 0.01% before applying the OSI cuts and after the OSI cuts the contamination is about 4.029% ± 0.003% (Figure 1.7.(b)). | ||
| − | (a) Before Cuts. | + | {| border="0" style="background:transparent;" align="center" |
| − | + | |- | |
| − | Fig. 1.7: The number of photoelectrons before and after geometrical and time matching cuts. | + | | |
| + | [[File:Electrons_nphe_without_cuts_all_data_with_fits.png|400px|thumb|(a) Before Cuts.]] | ||
| + | |}<br> | ||
| + | |||
| + | {| border="0" style="background:transparent;" align="center" | ||
| + | |- | ||
| + | | | ||
| + | [[File:Electrons_nphe_with_OSIcuts_all_data_with_fits.png|400px|thumb|(b) After OSI Cuts.]] | ||
| + | |}<br> | ||
| + | |||
| + | '''Fig. 1.7''': The number of photoelectrons before and after geometrical and time matching cuts. | ||
==Pion Identification== | ==Pion Identification== | ||
| Line 163: | Line 210: | ||
vertex to the ToF counters. The mass of the charged particle can be identified by combining the particle’s β with the particle momentum obtained from the track measured by the drift chamber in the known magnetic field. The particle mass in a magnetic field is given as | vertex to the ToF counters. The mass of the charged particle can be identified by combining the particle’s β with the particle momentum obtained from the track measured by the drift chamber in the known magnetic field. The particle mass in a magnetic field is given as | ||
| − | + | ||
| − | p = | + | {| border="0" style="background:transparent;" align="center" |
| − | m=p ( | + | |- |
| − | + | |<math>p=\frac{m\beta}{\sqrt{1-\beta^{2}}}</math> | |
| + | |} | ||
| + | |||
| + | {| border="0" style="background:transparent;" align="center" | ||
| + | |- | ||
| + | |<math>m=p\sqrt{(\beta^{2} - 1)}</math> | ||
| + | |} | ||
| + | |||
| + | {| border="0" style="background:transparent;" align="center" | ||
| + | |- | ||
| + | |<math>\beta=\frac{L_{path}}{t_{flight}}</math> | ||
| + | |}, | ||
| + | |||
(1.11) | (1.11) | ||
(1.12) (1.13) | (1.12) (1.13) | ||
| − | |||
| − | |||
| − | |||
| − | Fig. 1.8: The charged particle momentum versus | + | where m is the mass of the charged particle, <math>\beta</math> its velocity, p particle momentum, Lpath the path length from the vertex to scintillators and tflight the time of flight from the interaction vertex to the ToF system.<br> |
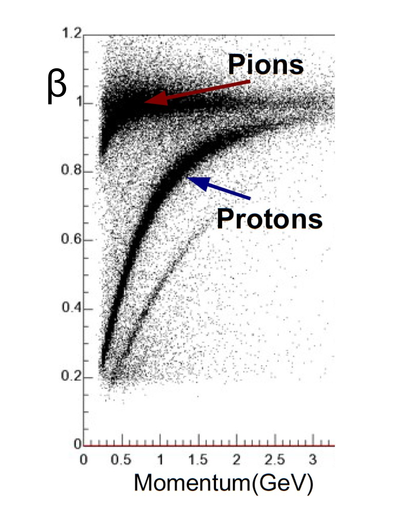
| − | + | Using the above information (particle momentum from the drift cham- bers and the timing information from the ToF system), the mass squared of the charged particle was calculated and is shown on Figure 1.9. The pion mass band is distributed around zero. To isolate charged pions from the rest of the particles, a <math>3\sigma</math> cut on the momentum versus <math>\beta</math> distribution has been applied [5].<br> | |
| + | In addition to the charged particle velocity (<math>\beta</math>), the fiducial volume cuts have been applied for the charged pion identification. For the EG1b experiment, pions were detected from <math>8^{\circ}</math> to <math>180^{\circ}</math> [5]. The pion identification code has been developed by Joshua Pierce [6].<br> | ||
| + | |||
| + | {| border="0" style="background:transparent;" align="center" | ||
| + | |- | ||
| + | | | ||
| + | [[File:betavsmomentum.png|400px]] | ||
| + | |}<br> | ||
| + | '''Fig. 1.8''': The charged particle momentum versus <math>\beta</math> distribution. The pion and proton bands are clearly separated. | ||
=Event Reconstruction Efficiency= | =Event Reconstruction Efficiency= | ||
| − | The goal of this work is to measure the semi-inclusive asymmetry when an electron and a pion are detected in the final state. For this analysis, pions of opposite charge will be observed using the same scintillator paddles by flipping | + | The goal of this work is to measure the semi-inclusive asymmetry when an electron and a pion are detected in the final state. For this analysis, pions of opposite charge will be observed using the same scintillator paddles by flipping the CLAS torus magnetic field direction. Although pions will be detected by the same detector elements, electrons will intersect different detector elements. As a result, the electron reconstruction efficiency was evaluated in terms of the electron rate observed in two different scintillator paddles detecting the same electron kinematics. |
| − | + | ==Inclusive Electron Event Reconstruction Efficiency== | |
| − | |||
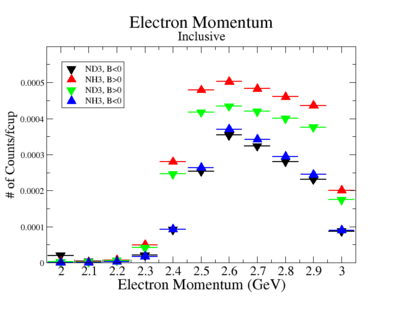
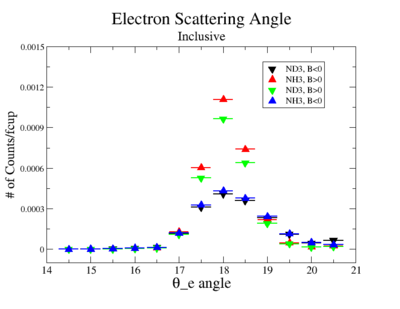
| + | The electron reconstruction efficiency for individual scintillator detec- tors using the 4.2 GeV EG1b data set is investigated below. Only the electron is detected in the final state (inclusive case). The pion contamination in the electron sample was removed by applying the cuts described above. The electron paddle numbers 10 (B<0) and 5 (B>0) were chosen respectively, because they contained the most electron events in a first pass semi-inclusive pion analysis of the data set. The electron kinematics (momentum, scattering angle and invariant mass) for these scintillators is shown on Figure 1.10. | ||
| + | Ratios of the inclusive electron rate, normalized using the gated Faraday cup and detected in scintillator paddles # 5 and # 10, were measured. Two ratios are constructed to quantify the CLAS detector’s ability to reconstruct electrons in scintillator paddle #5 using a positive Torus polarity and scintillator #10 using the negative Torus polarity. | ||
| − | == | + | {| border="0" style="background:transparent;" align="center" |
| − | The | + | |- |
| + | |<math>\frac{ND_{3}, B>0, Paddle Number^{e^{-}}=5}{ND_{3}, B<0, Paddle Number^{e^{-}}=10}=1.57 \pm 0.16</math> | ||
| + | |} | ||
| + | |||
| + | {| border="0" style="background:transparent;" align="center" | ||
| + | |- | ||
| + | |<math>\frac{NH_{3}, B>0, Paddle Number^{e^{-}}=5}{NH_{3}, B<0, Paddle Number^{e^{-}}=10}=1.76 \pm 0.17.</math> | ||
| + | |} | ||
| + | |||
| + | The above ratios are statistically the same. The semi-inclusive analysis to be performed in this work will be taking ratios using an <math>ND_3</math> and <math>NH_3</math> target. Below is the observed ratio comparing the inclusive electrons observed by scintillator #5 for a positive torus polarity and an <math>ND_3</math> target to the electrons observed by scintillator #10 when the torus polarity is negative and the target is <math>NH_3</math>. | ||
| + | |||
| + | {| border="0" style="background:transparent;" align="center" | ||
| + | |- | ||
| + | |<math>\frac{ND_{3}, B>0, Paddle Number^{e^{-}}=5}{NH_{3}, B<0, Paddle Number^{e^{-}}=10}=1.55 \pm 0.15.</math> | ||
| + | |} | ||
| + | |||
| + | {| border="0" style="background:transparent;" align="center" | ||
| + | |- | ||
| + | | | ||
| + | [[File:EmomInclusiveoverlay4-2GeVfcup.png|400px|thumb|(a)]] | ||
| + | |}<br> | ||
| + | |||
| + | {| border="0" style="background:transparent;" align="center" | ||
| + | |- | ||
| + | | | ||
| + | [[File:EthetaInclusiveoverlay4-2GeVfcup.png|400px|thumb|(b)]] | ||
| + | |}<br> | ||
| + | |||
| + | {| border="0" style="background:transparent;" align="center" | ||
| + | |- | ||
| + | | | ||
| + | [[File:WInclusiveoverlay4-2GeVfcup.png|400px|thumb|(c)]] | ||
| + | |}<br> | ||
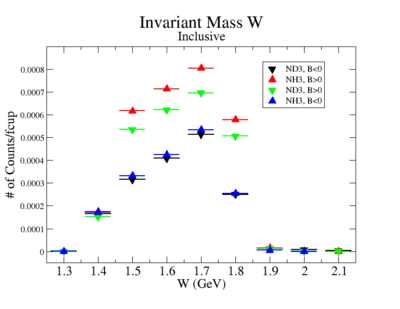
| − | + | '''Fig. 1.10''': Electron Kinematics. (a) Electron Momentum, (b) Electron Scattering Angle <math>\theta</math> and (c) W Invariant mass((<math>NH_3</math>, B>0), (<math>NH_3</math>, B<0), (<math>ND_3</math>, B>0) and (<math>ND_3</math>, B<0)). | |
| − | |||
| − | |||
| − | |||
| − | |||
| − | |||
| − | |||
| − | + | The above ratios, which have been observed to be ammonia target independent, indicate a difference in an electron detector efficiency when the torus polarity is flipped. An electron detection efficiency "correction coefficient" is defined in terms of the above ratio and measured to be <math>\frac{ND_{3}, B>0, Paddle Number^{e^{-}}=5}{NH_{3}, B<0, Paddle Number^{e^{-}}=10}=0.645</math> and <math>\frac{ND_{3}, B<0, Paddle Number^{e^{-}}=10}{NH_{3}, B>0, Paddle Number^{e^{-}}=5}=1.82</math>. The impact of these corrections on the data is illustrated in the next section. | |
| − | |||
| − | |||
| − | |||
| − | |||
| − | 0.645 and | ||
| − | |||
==Exclusive and Semi-Inclusive Event Reconstruction Efficiencies== | ==Exclusive and Semi-Inclusive Event Reconstruction Efficiencies== | ||
| − | |||
| − | |||
| − | |||
| − | |||
| − | |||
| − | |||
| − | |||
| − | |||
| − | |||
| − | |||
| − | |||
| − | |||
| − | |||
| − | |||
| − | |||
| − | |||
| − | |||
| − | |||
| − | |||
| − | |||
| + | The measured single pion electroproduction rate was compared to the MAID 2007 unitary model \cite{MAID2007}, that has been developed using the world data of pion photo and electro-production, to determine the impact of using the above electron reconstruction efficiency "correction coefficient". The MAID 2007 model has predictions of the total cross section for the following two cases that are relevant to our work: | ||
| + | |||
| + | {| border="0" style="background:transparent;" align="center" | ||
| + | |- | ||
| + | |<math>\gamma^{*} + proton (NH_{3}) \rightarrow \pi^{+} + neutron</math> | ||
| + | |} | ||
| + | |||
| + | {| border="0" style="background:transparent;" align="center" | ||
| + | |- | ||
| + | |<math>\gamma^{*} + neutron (ND_{3}) \rightarrow \pi^{-} + proton.</math> | ||
| + | |} | ||
| + | |||
| + | Using MAID 2007, the total cross section was calculated for the following invariant mass and four momentum transfer squared values: 1.7 GeV < W<1.8 GeV and <math>Q^{2}</math>=1.1 GeV<math>^{2}</math> \cite{MAID2007}. The exclusive total cross section for such reactions may be expressed as | ||
| + | |||
| + | {| border="0" style="background:transparent;" align="center" | ||
| + | |- | ||
| + | |<math>\sigma = \sigma_{T} + \epsilon \sigma_{L} + \sqrt{2\epsilon(1 + \epsilon)}\sigma_{LT} \cos{\phi_{\pi}}^{CM} | ||
| + | + \epsilon \sigma{TT} \cos2{\phi_{\pi}}^{CM} +</math> | ||
| + | |} | ||
| + | |||
| + | {| border="0" style="background:transparent;" align="center" | ||
| + | |- | ||
| + | |<math>+ h \sqrt{2\epsilon (1-\epsilon)}\sigma_{LT^{\prime}}\sin{\phi_{\pi}}^{CM},</math> | ||
| + | |} | ||
| + | |||
| + | where <math>{\phi_{\pi}}^{CM}</math> is the pion azimuthal angle in the CM frame, <math>\epsilon = (1 + 2(1 + \frac{\nu^{2}}{Q^{2}})\tan^{2}\frac{\theta_{e}}{2})^{-1}</math> is the virtual photon polarization, <math>\nu=E_{i} - E_{f}</math> the energy difference of the initial and final state electron, <math>Q^{2} = 4 E_{i} E_{f} \sin^{2}\frac{\theta_{e}}{2}</math> the four momentum transfer squared, <math>\theta_{e}</math> the electron scattering angle and <math>h</math> the electron helicity. | ||
| + | |||
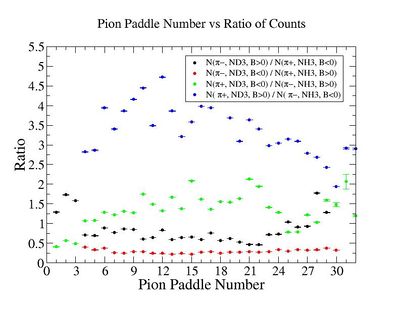
| + | The ratio of the pions detected for the opposite torus particles in the scintillator paddles, located between the Cherenkov counter and electromagnetic calorimeter, is shown in Figure~\ref{fig:PionPaddleNumbervsRatio}. Ratios were measured for four different cases. The intrinsic assumption is that, for the inbending case, positive pions and for the outbending case negative pions have the same trajectories when they have the same kinematics. In addition, negatively charged pions in the inbending field and positively charged pions in the outbending fields are detected by the same detector elements. | ||
| + | |||
| + | {| border="0" style="background:transparent;" align="center" | ||
| + | |- | ||
| + | | | ||
| + | [[File:Paddenumbvsratio.jpg|400px]] | ||
| + | |}<br> | ||
| + | |||
| + | '''Fig. 1.11''': Pion paddle number versus the Semi-Inclusive ratio. | ||
| + | |||
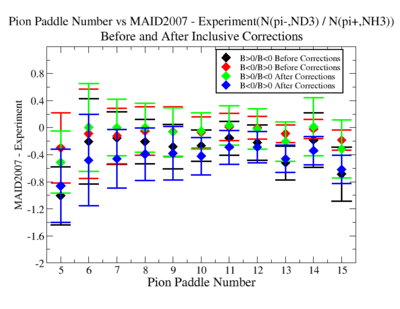
| + | After applying corrections determined by the inclusive events, the ratios were compared to the results from MAID2007. The difference of the measured and MAID2007 model ratios for each pion paddle number is shown in Figure~\ref{fig:MAID2007Experiment}. One can argue, using Figure~\ref{fig:MAID2007Experiment}, that the "inclusive corrections" do not impact single pion production rates for the exclusive cases. | ||
| + | |||
| + | {| border="0" style="background:transparent;" align="center" | ||
| + | |- | ||
| + | | | ||
| + | [[File:Maid2007minusexperiment.png|400px]] | ||
| + | |}<br> | ||
| + | |||
| + | '''Fig. 1.12''': Pion Paddle Number versus MAID2007 - Experiment(N (<math>\pi^{-}</math>, ND<math>_{3}</math>) / N(<math>\pi^{+}</math>, NH<math>_{3}</math>)). The Black and red data represent B>0/B<0 and B<0/B>0 cases respectively before corrections. The green and blue points represent the ratios for B>0/B<0 and B<0/B>0 after inclusive corrections. | ||
=Asymmetries= | =Asymmetries= | ||
| Line 231: | Line 342: | ||
==Beam Charge Asymmetry== | ==Beam Charge Asymmetry== | ||
The helicity of the electron beam was flipped at a rate of 1 Hz. The helicity is prepared at the source such that helicity pairs are produced pseudo randomly. | The helicity of the electron beam was flipped at a rate of 1 Hz. The helicity is prepared at the source such that helicity pairs are produced pseudo randomly. | ||
| − | Fig. 1.13: The Helicity State: A one bit signal from the beam injector gives the helicity information | + | |
| + | {| border="0" style="background:transparent;" align="center" | ||
| + | |- | ||
| + | | | ||
| + | [[File:Helicity_state.png|400px]] | ||
| + | |}<br> | ||
| + | |||
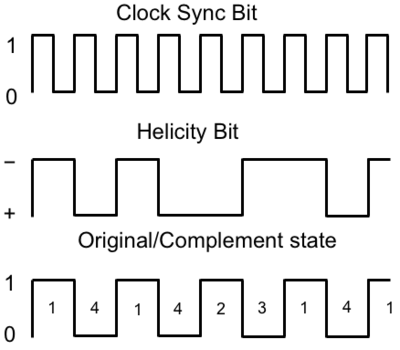
| + | '''Fig. 1.13''': The Helicity State: A one bit signal from the beam injector gives the helicity information. A sync bit with a 2 Hz frequency is generated to indicate the start of a helicity state. | ||
| + | |||
If the first electron bunch is pseudo randomly chosen to be positive (negative) then it is labeled as the original helicity state and denoted in software by a 2 (1). The next helicity state is prepared to be a complement to the first state and labeled in the software as either a 4, if the original helicity state was a 1 (negative), or 3 if the original helicity state was a 2 (positive). The helicity selection process is then repeated. | If the first electron bunch is pseudo randomly chosen to be positive (negative) then it is labeled as the original helicity state and denoted in software by a 2 (1). The next helicity state is prepared to be a complement to the first state and labeled in the software as either a 4, if the original helicity state was a 1 (negative), or 3 if the original helicity state was a 2 (positive). The helicity selection process is then repeated. | ||
| − | Figure 1.13 illustrates the signals used to label the helicity states. The | + | |
| − | + | Figure 1.13 illustrates the signals used to label the helicity states. The clock pulse (SYNC) is used to indicate that a change in the pockel cell used to define the helicity state may have occurred. The helicity bit identifies the helicity state that was set. The original/complement pulse identifies if the state is an original or complement helicity state. All three bits are recorded in the raw data file for each event and then converted to the labels 1, 2, 3, 4 during DST file production once the particles have been reconstructed. | |
| − | + | ||
| − | |||
| − | clock pulse (SYNC) is used to indicate that a change in the pockel cell used to define the helicity state may have occurred. The helicity bit identifies the helicity state that was set. The original/complement pulse identifies if the state is an original or complement helicity state. All three bits are recorded in the raw data file for each event and then converted to the labels 1, 2, 3, 4 during DST file production once the particles have been reconstructed. | ||
Two scalers were used to record several ancillary detectors, such as a Faraday cup and several PMTs mounted on the beam line, according to their helicity label. One of the scalers was gated by the DAQ live time in order to record beam conditions when the DAQ was able to take data and not busy recording data. The second scaler remained ungated. Both scalers recorded the SYNC and Helicity signals from the injector along with the counts ob- served from ancillary detectors during the SYNC interval. The Faraday cup signal recorded by the gated helicity scaler is used to normalize the events reconstructed during the same helicity interval. | Two scalers were used to record several ancillary detectors, such as a Faraday cup and several PMTs mounted on the beam line, according to their helicity label. One of the scalers was gated by the DAQ live time in order to record beam conditions when the DAQ was able to take data and not busy recording data. The second scaler remained ungated. Both scalers recorded the SYNC and Helicity signals from the injector along with the counts ob- served from ancillary detectors during the SYNC interval. The Faraday cup signal recorded by the gated helicity scaler is used to normalize the events reconstructed during the same helicity interval. | ||
| + | |||
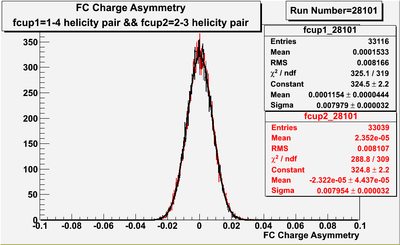
The beam charge asymmetry is defined in Eq. 1.21 and measured using the gated helicity scaler. For each run number, a gaussian fit was used to fit the beam charge asymmetry distributions as in Figure 1.14. The beam charge asymmetry is defined as | The beam charge asymmetry is defined in Eq. 1.21 and measured using the gated helicity scaler. For each run number, a gaussian fit was used to fit the beam charge asymmetry distributions as in Figure 1.14. The beam charge asymmetry is defined as | ||
| − | |||
| − | |||
| − | |||
| − | |||
| − | |||
| − | |||
| − | |||
| − | |||
| − | |||
| − | |||
| − | |||
| − | |||
| − | |||
| − | |||
| − | |||
| − | |||
| − | |||
| − | |||
| − | |||
| − | |||
| − | |||
| − | |||
| − | |||
| − | |||
| − | |||
| − | |||
| − | |||
| − | |||
| − | |||
| − | |||
| − | |||
| − | |||
| − | |||
| − | |||
| − | |||
| − | |||
| + | {| border="0" style="background:transparent;" align="center" | ||
| + | |- | ||
| + | |<math>A_{14} = \frac{ \Sigma FC_{i}^{hel1}-\Sigma FC_{i}^{hel4}}{\Sigma FC_{i}^{hel1}+\Sigma FC_{i}^{hel4}},</math> | ||
| + | |} | ||
| + | |||
| + | {| border="0" style="background:transparent;" align="center" | ||
| + | |- | ||
| + | |<math>A_{23} = \frac{ \Sigma FC_{i}^{hel2}-\Sigma FC_{i}^{hel3}}{\Sigma FC_{i}^{hel2}+\Sigma FC_{i}^{hel3}},</math> | ||
| + | |} | ||
| + | |||
| + | (1.20) | ||
| + | |||
| + | where <math>FC^{hel1,hel2}</math> (<math>FC^{hel4,hel3}</math>) represents the Faraday cup counts observed for the original helicity 1 and 2 states (the complement helicity 3 and 4 states). | ||
| + | |||
| + | {| border="0" style="background:transparent;" align="center" | ||
| + | |- | ||
| + | | | ||
| + | [[File:FC_ChargeAsymmetry_282101RunNumber_14_23HelPairs_03_12_12.png|400px]] | ||
| + | |}<br> | ||
| + | |||
| + | Fig. 1.14: Beam charge asymmetry for run #28101 using the gated Faraday cup counts for two helicity pairs (1-4 and 2-3 helicity pairs). <math>A_{1−4} = (11.5 \pm 4.4) \times 10^{−5}</math> and <math>A_{2−3} = (−2.3 \pm 4.4) \times 10^{−5}.</math> | ||
| + | |||
| + | EG1b data sets, with the same half wave plate, target type, target polarization, and beam torus have been combined. The beam charge asymmetries have been calculated for the each run group and are listed in Table 1.2. | ||
| + | |||
| + | {| border="1" style="text-align: center;" align="center" | ||
| + | |- | ||
| + | |Run Group || Half wave plate(HWP) || <math>A_{1-4} \times 10^{-4}</math> || <math>A_{2-3} \times 10^{-4}</math> | ||
| + | |- | ||
| + | | 28100 - 28105 || +1 || <math>5.88 \pm 34.40</math> || <math>4.03 \pm 34.36</math> | ||
| + | |- | ||
| + | | 28106 - 28115 || -1 || <math>7.53 \pm 22.30</math> || <math>8.28 \pm 22.30</math> | ||
| + | |- | ||
| + | | 28145 - 28240 || +1 || <math>31.70 \pm 7.99</math> || <math>30.40 \pm 7.99</math> | ||
| + | |- | ||
| + | | 28242 - 28284 || -1 || <math>49.6 \pm 10.8</math> || <math>47.9 \pm 10.8</math> | ||
| + | |- | ||
| + | | 28286 - 28324 || +1 || <math>36.3 \pm 11.6</math> || <math>37.0 \pm 11.5</math> | ||
| + | |- | ||
| + | | 28325 - 28447 || -1 || <math>21.1 \pm 13.4</math> || <math>22.2 \pm 13.4</math> | ||
| + | |- | ||
| + | | 28449 - 28479 || +1 || <math>-11.6 \pm 16.5</math> || <math>-21.6 \pm 16.5</math> | ||
| + | |} | ||
| + | |||
| + | '''Table 1.2''': Run Group versus Beam Charge Asymmetry. | ||
==Electron Asymmetry== | ==Electron Asymmetry== | ||
| − | A measurement of the electron cross section helicity difference needs to account for a possible helicity dependence of the incident electron flux (charge | + | |
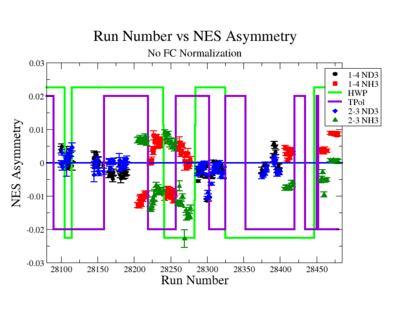
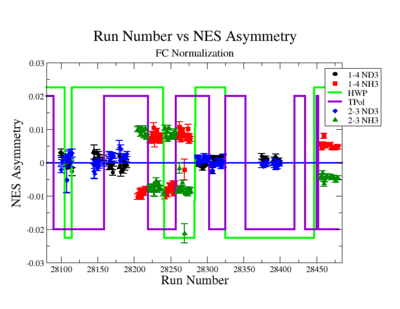
| − | + | A measurement of the electron cross section helicity difference needs to account for a possible helicity dependence of the incident electron flux (charge asymmetry). Figure~\ref{fig:RunvsEAsym} shows the reconstructed electron rate asymmetry, before it is normalized by the gated Faraday Cup, as a function of the run number for the 4.2 GeV data set. The reconstructed electron asymmetry can be defined following way: | |
| − | + | ||
| − | + | {| border="0" style="background:transparent;" align="center" | |
| − | + | |- | |
| − | + | |<math>A_{NES}^{+-} = \frac{\Sigma NES^{+} - \Sigma NES^{-}}{\Sigma NES^{+} + \Sigma NES^{-}}= \frac{\Sigma NES^{hel2} - \Sigma NES^{hel3}}{\Sigma NES^{hel2} + \Sigma NES^{hel3}} \equiv (2-3),</math> | |
| − | + | |} | |
| − | + | ||
| − | + | or | |
| − | Systematic effects on the asymmetry measurement may be investigated by separating the data into two groups based on which helicity state is set first. The first group (black data points) represents the electron asymmetry observed when the first (original) helicity state is negative and its complement state is positive (helicity state #1 | + | |
| − | + | {| border="0" style="background:transparent;" align="center" | |
| − | + | |- | |
| − | + | |<math>A_{NES}^{-+} = \frac{\Sigma NES^{-} - \Sigma NES^{+}}{\Sigma NES^{-} + \Sigma NES^{+}}= \frac{\Sigma NES^{hel1} - \Sigma NES^{hel4}}{\Sigma NES^{hel1} + \Sigma NES^{hel4}} \equiv (1-4),</math> | |
| − | + | |} | |
| − | + | ||
| − | + | where <math>NES^{+}</math> (<math>NES^{-}</math>) represents number of electron scattered for the positive (negative) beam helicity state. | |
| − | + | ||
| − | + | {| border="0" style="background:transparent;" align="center" | |
| − | + | |- | |
| − | Fig. 1.16: W versus ( | + | | |
| − | The un-normalized reconstructed electron asymmetry has been | + | [[File:NES_Asymmetry_Before_FCNormalization.png|400px]] |
| − | + | |}<br> | |
| − | + | ||
| − | and | + | '''Fig. 1.15''': Run Number versus Electron Asymmetry before FC normalization. The black and red points represent reconstructed electron asymmetry for the helicity 1-4 pair for <math>ND_{3}</math> and <math>NH_{3}</math> target respectively. The blue and green points represent the helicity pair 2-3 for <math>ND_{3}</math> and <math>NH_{3}</math> respectively. The green line shows the sign of the half wave plate (HWP) and the purple line is the sign of the target polarization (TPol). |
| − | + | ||
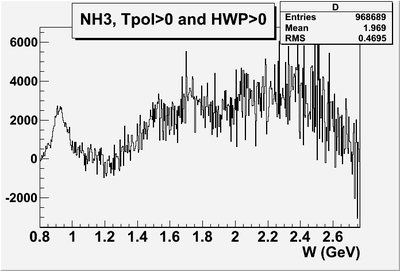
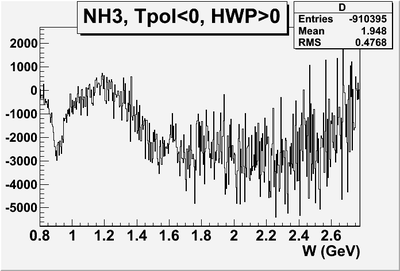
| − | + | Systematic effects on the asymmetry measurement may be investigated by separating the data into two groups based on which helicity state is set first. The first group (black data points) represents the electron asymmetry observed when the first (original) helicity state is negative and its complement state is positive (helicity state #1 - state #4). The second group (red data points) represents the asymmetry observed when the first state is positive and the complement state is negative (helicity state #2 - #3). Both groups were divided into two subgroups based the target type used. The diamond points on the histogram represent the data for the <math>NH_{3}</math> target and the squares for the <math>ND_{3}</math> target. Two lines on the histogram are used to identify the sign of the half wave plate (HWP) and the target polarization (TPol). The relative spin orientation can be changed by either inserting a half wave plate (HWP) or by populating a different target polarization state with a different RF frequency. One would expect the asymmetry to change sign if either the HWP is inserted or the target polarization is rotated 180 degrees. As one can see for Figure~\ref{fig:RunvsEAsym} and Figure~\ref{fig:WvsNESAsym}, the electron asymmetry changes sign if the HWP or the target polarization is reversed. | |
| − | + | ||
| + | {| border="0" style="background:transparent;" align="center" | ||
| + | |- | ||
| + | | | ||
| + | [[File:28205.png|400px|thumb|NH3, Tpol>0 and HWP>0.]] | ||
| + | |}<br> | ||
| + | |||
| + | {| border="0" style="background:transparent;" align="center" | ||
| + | |- | ||
| + | | | ||
| + | [[File:28222.png|400px|thumb|NH3, Tpol<0 and HWP>0.]] | ||
| + | |}<br> | ||
| + | |||
| + | '''Fig. 1.16''': W versus <math>(NES^{hel4} - NES^{hel1})</math> and <math>(NES^{hel2} - NES^{hel3})</math>. The electron asymmetry changes sign when the target polarization is reversed. | ||
| + | |||
| + | The un-normalized reconstructed electron asymmetry has been calculated as: | ||
| + | |||
| + | {| border="0" style="background:transparent;" align="center" | ||
| + | |- | ||
| + | |<math>A_{NES}^{-+} = \frac{\Sigma NES^{hel1} - \Sigma NES^{hel4}}{\Sigma NES^{hel1} + NES^{hel4}},</math> | ||
| + | |} | ||
| + | |||
| + | {| border="0" style="background:transparent;" align="center" | ||
| + | |- | ||
| + | |<math>A_{NES}^{+-} = \frac{\Sigma NES^{hel2} - \Sigma NES^{hel3}}{\Sigma NES^{hel2} + NES^{hel3}},</math> | ||
| + | |} | ||
| + | |||
| + | and the Faraday cup normalized asymmetry as: | ||
| + | |||
| + | {| border="0" style="background:transparent;" align="center" | ||
| + | |- | ||
| + | |<math>A_{NES}^{+-} = \frac{\frac{\Sigma NES^{hel2}}{\Sigma FC^{hel2}} - \frac{\Sigma NES^{hel3}}{\Sigma FC^{hel3}}}{\frac{\Sigma NES^{hel2}}{\Sigma FC^{hel2}} + \frac{\Sigma NES^{hel3}}{\Sigma FC^{hel3}}}.</math> | ||
| + | |} | ||
| + | |||
(1.23) | (1.23) | ||
(1.24) | (1.24) | ||
| − | |||
| − | |||
| − | |||
| + | {| border="0" style="background:transparent;" align="center" | ||
| + | |- | ||
| + | | | ||
| + | [[File:NES_Asymmetry_After_FCNormalization.png|400px]] | ||
| + | |}<br> | ||
| + | |||
| + | '''Fig. 1.17''': Run number versus electron asymmetry after applying FC normalization. The black and red points represent the reconstructed electron asymmetry for the helicity 1-4 pair for <math>ND_{3}</math> and <math>NH_{3}</math> target respectively. The blue and green points are the helicity pair 2-3 for <math>ND_{3}</math> and <math>NH_{3}</math> respectively. The green line shows the sign of the half wave plate (HWP) and the purple line is the sign of the target polarization (TPol). | ||
==Semi-Inclusive Asymmetries== | ==Semi-Inclusive Asymmetries== | ||
| − | + | ||
| − | + | %The ratio of the combined semi-inclusive deep inelastic asymmetries (<math>A_{hel13-hel42}</math>) from the Table. 4.3 , for two different torus settings have been corrected for the electron reconstruction efficiency. The Fig. 4.7 represents asymmetry ratios before and after electron reconstruction efficiency. The ratios have been calculated for each target and charged pion type. SIDIS asymmetries are statistically the same. The results suggest electron reconstruction efficiency do not make significant change on the asymmetries. | |
| − | + | ||
| − | + | The asymmetries from semi-inclusive pion electroproduction using proton or deuteron targets can be written in terms of the difference of the yield when the electron spin is parallel and antiparallel to the spin of the nucleon. There are four combinations of semi-inclusive asymmetries: <math>A_{NH_{3}}^{\pi^{+}}</math>, <math>A_{NH_{3}}^{\pi^{-}}</math>, <math>A_{ND_{3}}^{\pi^{+}}</math> and <math>A_{ ND_{3}}^{\pi^{-}}</math> | |
| − | + | ||
| − | + | {| border="0" style="background:transparent;" align="center" | |
| − | + | |- | |
| − | + | |<math>A_{NH_{3}}^{\pi^{+}} \equiv \frac{\Sigma N_{NH_{3},\pi^{+}}^{\uparrow \uparrow} - \Sigma N_{NH_{3}, \pi^{+}}^{\uparrow \downarrow}}{\Sigma N_{NH_{3},\pi^{+}}^{\uparrow \uparrow} + \Sigma N_{NH_{3}, \pi^{+}}^{\uparrow \downarrow}}</math> | |
| − | + | |} | |
| − | + | ||
| − | + | {| border="0" style="background:transparent;" align="center" | |
| − | + | |- | |
| − | + | |<math>A_{NH_{3}}^{\pi^{-}} \equiv \frac{\Sigma N_{NH_{3},\pi^{-}}^{\uparrow \uparrow} - \Sigma N_{NH_{3}, \pi^{-}}^{\uparrow \downarrow}}{\Sigma N_{NH_{3},\pi^{-}}^{\uparrow \uparrow} + \Sigma N_{NH_{3}, \pi^{-}}^{\uparrow \downarrow}}</math> | |
| − | + | |} | |
| − | + | ||
| − | + | {| border="0" style="background:transparent;" align="center" | |
| − | group | + | |- |
| − | Fig. 1.18: Invariant Mass versus | + | |<math>A_{ND_{3}}^{\pi^{+}} \equiv \frac{\Sigma N_{ND_{3},\pi^{+}}^{\uparrow \uparrow} - \Sigma N_{ND_{3}, \pi^{+}}^{\uparrow \downarrow}}{\Sigma N_{ND_{3},\pi^{+}}^{\uparrow \uparrow} + \Sigma N_{ND_{3}, \pi^{+}}^{\uparrow \downarrow}}</math> |
| − | The ratio of the combined semi-inclusive deep inelastic asymmetries (Araw) from Table 1.3, for two different torus settings have been corrected for the electron reconstruction efficiency. The Figure 1.20 represents the raw asymmetry ratios before and after electron reconstruction efficiency corrections. The ratios have been calculated for each target and charged pion type. The SIDIS asymmetries before and after the correction are statistically the same. The result indicates that the electron reconstruction efficiency does not change | + | |} |
| − | + | ||
| − | + | {| border="0" style="background:transparent;" align="center" | |
| − | + | |- | |
| − | + | |<math>A_{ND_{3}}^{\pi^{-}} \equiv \frac{\Sigma N_{ND_{3},\pi^{-}}^{\uparrow \uparrow} - \Sigma N_{ND_{3}, \pi^{-}}^{\uparrow \downarrow}}{\Sigma N_{ND_{3},\pi^{-}}^{\uparrow \uparrow} + \Sigma N_{ND_{3}, \pi^{-}}^{\uparrow \downarrow}},</math> | |
| − | + | |} | |
| − | + | ||
| − | + | where <math>N_{NH_{3},\pi^{+},\pi^{-}}^{\uparrow \downarrow}</math>(<math>N_{NH_{3},\pi^{+},\pi^{-}}^{\uparrow \uparrow}</math>) and <math>N_{ND_{3},\pi^{+},\pi^{-}}^{\uparrow \downarrow}</math>(<math>N_{ND_{3},\pi^{+},\pi^{-}}^{\uparrow \uparrow}</math>) represent the number of <math>\pi^{+}</math> and <math>\pi^{-}</math> hadrons detected in the final state with the scattered electron when the spin of the initial electron beam was antiparallel (parallel) to the spin of the proton and neutron respectively. | |
| − | + | ||
| − | + | The kinematic coverage for the events used in the measured asymmetries are shown on Figure~\ref{fig:InvariantMassvsQ2} and Figure~\ref{fig:MissingMassM_X}. The semi-inclusive asymmetries are listed in Table~\ref{tab:RunvsSIDISAsym}. The first group <math>A_{hel1-hel4}</math> represents the asymmetry measured when the first original electron spin (hel1) is antiparallel to the target nucleon spin and its complement state (hel4) is parallel, whereas the second group <math>A_{hel2-hel3}</math> represents measuring the SIDIS asymmetry when the first helicity state is parallel (hel2) and its complement state (hel3) is antiparallel to the spin of the nucleon. For the final measurement, the two groups are combined into one <math>A_{hel42-hel13}</math> set, in order to increase statistics. Instead of looking at original and complement electron helicity states, they have been combined into the positive (hel42) and negative (hel13) helicity states, which are parallel and antiparallel to the spin of the target nucleon respectively. | |
| − | + | ||
| − | + | ||
| − | + | ||
| − | + | '''Fig. 1.18''': Invariant Mass versus <math>Q^2</math>. | |
| − | + | ||
| − | + | ||
| − | + | '''Fig. 1.19''': Missing Mass. The line represents a cute used to remove events with <math>M_X</math> < 1.6 GeV from the semi-inclusive analysis. | |
| − | + | ||
| − | + | The ratio of the combined semi-inclusive deep inelastic asymmetries (Araw) from Table 1.3, for two different torus settings have been corrected for the electron reconstruction efficiency. The Figure 1.20 represents the raw asymmetry ratios before and after electron reconstruction efficiency corrections. The ratios have been calculated for each target and charged pion type. The SIDIS asymmetries before and after the correction are statistically the same. The result indicates that the electron reconstruction efficiency does not change the asymmetries. | |
| − | + | ||
| − | + | {| border="1" style="text-align: center;" align="center" | |
| − | + | |- | |
| − | The data have been combined for each target type and asymmetries measured for two | + | | Target type, Beam Torus || <math>A_{hel1-hel4} \times 10^{-4}</math> || <math>A_{hel2-hel3} \times 10^{-4}</math> || <math>A^{raw} \times 10^{-4}</math> |
| − | + | |- | |
| − | + | | <math>NH_{3}</math>, B>0, <math>\pi^{+}</math> || <math>-139.84 \pm 81.52</math> || <math>143.15 \pm 81.78</math> || <math>136.2 \pm 57.74 </math> | |
| − | Fig. 1.20: The ratio of the SIDIS asymmetries for two torus field settings Araw(B>0) versus target and the charged pion type. The black squares | + | |- |
| − | + | | <math>NH_{3}</math>, B<0, <math>\pi^{+}</math> || <math>-223.76 \pm 117.10</math> || <math>247.65 \pm 116.59</math> || <math>237.69 \pm 82.65</math> | |
| − | + | |- | |
| + | | <math>ND_{3}</math>, B>0, <math>\pi^{-}</math> || <math>-6.37 \pm 188.73</math> || <math>-98.11 \pm 188.03</math> || <math> 9.21 \pm 127.22</math> | ||
| + | |- | ||
| + | | <math>ND_{3}</math>, B<0, <math>\pi^{-}</math> || <math>-63.73 \pm 105.14</math> || <math>-30.34 \pm 6085.54</math> || <math>12.37 \pm 71.10</math> | ||
| + | |- | ||
| + | | <math>NH_{3}</math>, B>0, <math>\pi^{-}</math> || <math>-155.45 \pm 128.21</math> || <math>-72.55 \pm 128.92</math> || <math> 35.11 \pm 90.91</math> | ||
| + | |- | ||
| + | | <math>NH_{3}</math>, B<0, <math>\pi^{-}</math> || <math>9.60 \pm 119.31</math> || <math>72.94 \pm 119.36</math> || <math>32.39 \pm 84.38</math> | ||
| + | |- | ||
| + | | <math>ND_{3}</math>, B>0, <math>\pi^{+}</math> || <math>-76.59 \pm 126.60</math> || <math>110.28 \pm 126.13</math> || <math>92.25 \pm 85.38</math> | ||
| + | |- | ||
| + | | ND_{3}$, B<0, $\pi^{+}$ & $-29.22 \pm 107.53$ & $123.98 \pm 106.86$ & $92.25 \pm 85.38$ | ||
| + | |} | ||
| + | |||
| + | '''Table 1.3''': SIDIS Asymmetry for Each Type Target material and Beam Torus. | ||
| + | |||
| + | The data have been combined for each target type and asymmetries measured for two <math>x_B</math> values (Table 1.4). The SIDIS asymmetries were calcu- lated for the following kinematic range: electron scattering angle 17.5<<math>\theta_e</math><18.5, electron momentum 2.55 GeV< <math>P_e</math><2.75 GeV, invariant mass 1.6 GeV<W<1.8 GeV and momentum transfer squared 0.9 <math>GeV^2</math><<math>Q^2</math><1.3 <math>GeV^2</math>. | ||
| + | |||
| + | Fig. 1.20: The ratio of the SIDIS asymmetries for two torus field settings Araw(B>0) versus target and the charged pion type. The black squares represent the data before electron reconstruction efficiency and the red data - after | ||
electron reconstruction efficiency has been applied. | electron reconstruction efficiency has been applied. | ||
| + | |||
SIDIS Asymmetry | SIDIS Asymmetry | ||
xB = 0.3 | xB = 0.3 | ||
| Line 377: | Line 559: | ||
(85.17 ± 82.97) × 10−4 | (85.17 ± 82.97) × 10−4 | ||
Table 1.4: SIDIS Asymmetries for xB = 0.3 and xB = 0.4. | Table 1.4: SIDIS Asymmetries for xB = 0.3 and xB = 0.4. | ||
| + | |||
In addition to xB, the data have been subdivided according to the frac- | In addition to xB, the data have been subdivided according to the frac- | ||
| − | tion energy of the observed final state pion(z). Aπ+,raw asymmetries for two z NH3 | + | tion energy of the observed final state pion <math>(z)</math>. Aπ+,raw asymmetries for two z NH3 |
are shown in Table 1.5. | are shown in Table 1.5. | ||
31 | 31 | ||
| Line 390: | Line 573: | ||
(125.62 ± 81.92) × 10−4 (165.81 ± 86.76) × 10−4 (140.32 ± 158.98) × 10−4 (238.34 ± 156.79) × 10−4 | (125.62 ± 81.92) × 10−4 (165.81 ± 86.76) × 10−4 (140.32 ± 158.98) × 10−4 (238.34 ± 156.79) × 10−4 | ||
Table 1.5: Aπ+,raw SIDIS Asymmetry. NH3 | Table 1.5: Aπ+,raw SIDIS Asymmetry. NH3 | ||
| − | |||
==Dilution Factor== | ==Dilution Factor== | ||
To account for the contributions of polarized nucleons from the nitrogen nuclei in the ammonia target and the cooling material of the target (Helium) cell to the semi-inclusive rates, the measured raw double spin asymmetries have to be divided by a dilution factor. The dilution factor accounts for the fraction of events coming from the desired polarized target nucleon. The dilution factors are calculated by combining the data from runs using different target types. During the EG1b experiment, several runs were taken with Carbon C12 and an empty target cell (He). All the runs in this work used liquid Helium as the coolant during the experiment. The Carbon and empty target runs were used to estimate the dilution of the data by the noise attributed to the interaction of the incident electron beam with the Nitrogen or Helium nucleons present in the target cell [8]. | To account for the contributions of polarized nucleons from the nitrogen nuclei in the ammonia target and the cooling material of the target (Helium) cell to the semi-inclusive rates, the measured raw double spin asymmetries have to be divided by a dilution factor. The dilution factor accounts for the fraction of events coming from the desired polarized target nucleon. The dilution factors are calculated by combining the data from runs using different target types. During the EG1b experiment, several runs were taken with Carbon C12 and an empty target cell (He). All the runs in this work used liquid Helium as the coolant during the experiment. The Carbon and empty target runs were used to estimate the dilution of the data by the noise attributed to the interaction of the incident electron beam with the Nitrogen or Helium nucleons present in the target cell [8]. | ||
| + | |||
| + | |||
In order to calculate the dilution factor, we need to define the number of counts with beam helicity negative and positive for ammonia (NA), Carbon (NC) and empty target (NMT) runs. All are weighted by the corresponding gated Faraday cup counts [9]. Normalized rates for Carbon and empty target types are defined as | In order to calculate the dilution factor, we need to define the number of counts with beam helicity negative and positive for ammonia (NA), Carbon (NC) and empty target (NMT) runs. All are weighted by the corresponding gated Faraday cup counts [9]. Normalized rates for Carbon and empty target types are defined as | ||
N+ +N− | N+ +N− | ||
| Line 401: | Line 585: | ||
 |  | ||
and | and | ||
| − | + | ||
1NA+ NA− | 1NA+ NA− | ||
nA=2(FC+ +FC−), (1.30) | nA=2(FC+ +FC−), (1.30) | ||
where nC is the rate from a Carbon target, nMT is from an empty target and nA is from one of the NH3 or ND3 ammonia targets. | where nC is the rate from a Carbon target, nMT is from an empty target and nA is from one of the NH3 or ND3 ammonia targets. | ||
| + | |||
The counts for all four targets (empty, Carbon and ammonia) can be expressed as the sum of counts from the entrance and exit window foils (ρF, lF, σF), liquid Helium coolant (ρHe, lHe, σHe), Carbon(ρC, lC, σC), Nitrogen (ρN, lN, σN), Hydrogen (Deuterium) (ρH(D), lH(D), σH(D)). | The counts for all four targets (empty, Carbon and ammonia) can be expressed as the sum of counts from the entrance and exit window foils (ρF, lF, σF), liquid Helium coolant (ρHe, lHe, σHe), Carbon(ρC, lC, σC), Nitrogen (ρN, lN, σN), Hydrogen (Deuterium) (ρH(D), lH(D), σH(D)). | ||
and | and | ||
| Line 413: | Line 598: | ||
ρClCσC H(D) | ρClCσC H(D) | ||
(1.33) | (1.33) | ||
| + | |||
Using above system of equations, we define two new spectra to account for the Carbon target and the difference in the amount of Helium in ammonia targets vice versus the Carbon target. For a target cell with length L and | Using above system of equations, we define two new spectra to account for the Carbon target and the difference in the amount of Helium in ammonia targets vice versus the Carbon target. For a target cell with length L and | ||
| − | |||
| − | |||
the Carbon target with length lC, the Carbon and LHe contributions can be written following way: | the Carbon target with length lC, the Carbon and LHe contributions can be written following way: | ||
and | and | ||
| Line 423: | Line 607: | ||
(1.35) | (1.35) | ||
where n′12C is the rate from the Carbon nucleus only and n′He is the rate from liquid Helium only. The length and densities are listed in Table 1.6. | where n′12C is the rate from the Carbon nucleus only and n′He is the rate from liquid Helium only. The length and densities are listed in Table 1.6. | ||
| + | |||
We need to establish how the rate from the Carbon target is related to the rate from the N15 in NH3 and ND3. The cross section for N15 can be written in terms of the cross sections on C12 target material (σ12C) and on a bound neutron in N15 (σn′ ). | We need to establish how the rate from the Carbon target is related to the rate from the N15 in NH3 and ND3. The cross section for N15 can be written in terms of the cross sections on C12 target material (σ12C) and on a bound neutron in N15 (σn′ ). | ||
σ15N ≈7σ12C+σn′ =7+ σn′ σ12C. (1.36) 6 6 σ12C | σ15N ≈7σ12C+σn′ =7+ σn′ σ12C. (1.36) 6 6 σ12C | ||
| + | |||
It is assumed that when the scattering occurs on protons inside the target material, the ratio of σn′ = 0 and when the reaction happens on neutrons | It is assumed that when the scattering occurs on protons inside the target material, the ratio of σn′ = 0 and when the reaction happens on neutrons | ||
σ12C | σ12C | ||
inside the target, the value of the ratio is σn′ = 1, because there are six | inside the target, the value of the ratio is σn′ = 1, because there are six | ||
σ12C 6 | σ12C 6 | ||
| + | |||
Using the above quantities, the background represented by the number | Using the above quantities, the background represented by the number | ||
bound neutrons in C12 [9]. | bound neutrons in C12 [9]. | ||
of counts due to the non-hydrogen and non-deuterium parts of the ammonia | of counts due to the non-hydrogen and non-deuterium parts of the ammonia | ||
| − | |||
| − | |||
target can be expressed as | target can be expressed as | ||
nB = ρAlA7+ σn′ +fn′12C+(L−lA)n′4He | nB = ρAlA7+ σn′ +fn′12C+(L−lA)n′4He | ||
| Line 492: | Line 677: | ||
0.122 - 0.182 | 0.122 - 0.182 | ||
Table 1.8: Dilution Factor compared with other results [8] [10]. | Table 1.8: Dilution Factor compared with other results [8] [10]. | ||
| − | |||
| − | |||
=Results= | =Results= | ||
| Line 499: | Line 682: | ||
The final results are presented in this chapter. They have been obtained by analyzing the data collected in 2000 - 2001 at Thomas Jefferson National Laboratory using a longitudinally polarized electron beam on a longitudinally polarized Hydrogen (15NH3) and Deuterium (15ND3) targets. The incident electron’s energy was 4.2 GeV. The CEBAF Large Acceptance Spectrometer (CLAS) was used for particle detection. The measurements were made for the kinematic region where xB ≥ 0.3 and momentum transfer squared Q2=1.1 ± 0.2 GeV2. The SIDIS asymmetries were measured at four different values of xB and are presented on Figure 2.1. | The final results are presented in this chapter. They have been obtained by analyzing the data collected in 2000 - 2001 at Thomas Jefferson National Laboratory using a longitudinally polarized electron beam on a longitudinally polarized Hydrogen (15NH3) and Deuterium (15ND3) targets. The incident electron’s energy was 4.2 GeV. The CEBAF Large Acceptance Spectrometer (CLAS) was used for particle detection. The measurements were made for the kinematic region where xB ≥ 0.3 and momentum transfer squared Q2=1.1 ± 0.2 GeV2. The SIDIS asymmetries were measured at four different values of xB and are presented on Figure 2.1. | ||
==Systematic Errors== | ==Systematic Errors== | ||
| − | The results presented in the previous sections include only statistical uncertainties. However, the experimental setup and the cuts used for particle identification and background | + | The results presented in the previous sections include only statistical uncertainties. However, the experimental setup and the cuts used for particle identification and background reduction are sources of systematic errors. This section describes the methods used for estimating the systematic errors from each type of source. The systematic errors for the SIDIS asymmetries are shown |
37 | 37 | ||
CLAS-NOTE 2012 | CLAS-NOTE 2012 | ||
| Line 506: | Line 689: | ||
systematic errors in quadrature. | systematic errors in quadrature. | ||
1.40 × 10⁻² 3.50 × 10⁻² 1.87 × 10⁻² 0.64 × 10⁻² 4.26 × 10⁻² | 1.40 × 10⁻² 3.50 × 10⁻² 1.87 × 10⁻² 0.64 × 10⁻² 4.26 × 10⁻² | ||
| − | Table 2.1: | + | Table 2.1: Summary of the systematic errors for the Aπ+ NH3 |
38 | 38 | ||
Source | Source | ||
| Line 520: | Line 703: | ||
Fig. 2.2: xB versus Aπ+ SIDIS Asymmetry: (a) geometrical and timing cuts, NH3 | Fig. 2.2: xB versus Aπ+ SIDIS Asymmetry: (a) geometrical and timing cuts, NH3 | ||
(b) electromagnetic calorimeter cuts. | (b) electromagnetic calorimeter cuts. | ||
| + | |||
==Dilution factor== | ==Dilution factor== | ||
| − | Systematic effects related to the dilution factor were estimated following way: First, the SIDIS asymmetries were calculated for the standard values of the dilution factor. Then asymmetries were recalculated by changing the value of each parameter by the amount of its uncertainty. The difference between these two values is the systematic effect due to the dilution factor. The resulting shift is about 1.9% (Figure 2.3). | + | Systematic effects related to the dilution factor were estimated the following way: First, the SIDIS asymmetries were calculated for the standard values of the dilution factor. Then asymmetries were recalculated by changing the value of each parameter by the amount of its uncertainty. The difference between these two values is the systematic effect due to the dilution factor. The resulting shift is about 1.9% (Figure 2.3). |
| − | + | ||
| − | |||
2.2.1 Cut Dependence | 2.2.1 Cut Dependence | ||
 |  | ||
| − | + | ||
Fig. 2.3: xB versus Aπ+ SIDIS Asymmetry. NH3 | Fig. 2.3: xB versus Aπ+ SIDIS Asymmetry. NH3 | ||
2.2.3 Polarization | 2.2.3 Polarization | ||
Systematic effects due to the target and beam polarization were esti- mated following way: First, the SIDIS asymmetries were calculated for the standard values of the Pt×Pbpolarization. Then asymmetries were recalculated by changing the value of each parameter by the amount of its uncertainty. The difference between these two values is the systematic error associated with the target and beam polarization, which is approximately 0.6% (Figure 2.4). | Systematic effects due to the target and beam polarization were esti- mated following way: First, the SIDIS asymmetries were calculated for the standard values of the Pt×Pbpolarization. Then asymmetries were recalculated by changing the value of each parameter by the amount of its uncertainty. The difference between these two values is the systematic error associated with the target and beam polarization, which is approximately 0.6% (Figure 2.4). | ||
| − | + | ||
| − | |||
| − | |||
Fig. 2.4: xB versus Aπ+ SIDIS Asymmetry. NH3 | Fig. 2.4: xB versus Aπ+ SIDIS Asymmetry. NH3 | ||
| − | + | ||
| + | ==Semi-Inclusive Pion Asymmetries== | ||
| + | |||
The corrected measured semi-inclusive deep inelastic asymmetries Aπ+ , NH3 | The corrected measured semi-inclusive deep inelastic asymmetries Aπ+ , NH3 | ||
Aπ− , Aπ+ and Aπ− are shown below on Figure 2.5 and compared to NH3 ND3 ND3 | Aπ− , Aπ+ and Aπ− are shown below on Figure 2.5 and compared to NH3 ND3 ND3 | ||
| − | the asymmetries measured by the HERMES experiment | + | the asymmetries measured by the HERMES experiment. The SIDIS asymmetries for longitudinally polar- ized Hydrogen (15NH3) and Deuterium (15ND3) targets are listed in Table 2.2 for four values of xB. The asymmetries have been corrected for the target and beam polarization [11] and dilution factor from ref[12]. |
| − | + | ||
| − | |||
| − | |||
(a) (b) | (a) (b) | ||
(c) (d) | (c) (d) | ||
Fig. 2.5: xB versus SIDIS Asymmetry: (a) Aπ+ , (b) Aπ− (c) Aπ+ and π− NH3 NH3 ND3 | Fig. 2.5: xB versus SIDIS Asymmetry: (a) Aπ+ , (b) Aπ− (c) Aπ+ and π− NH3 NH3 ND3 | ||
(d) AND3. The solid black squares are measurements from ref[13] and the solid black diamonds represent SIDIS asymmetries measured using the data collected during the EG1b experiment. The error bar lines represent systematic uncertainty and the risers statistical uncertainty. | (d) AND3. The solid black squares are measurements from ref[13] and the solid black diamonds represent SIDIS asymmetries measured using the data collected during the EG1b experiment. The error bar lines represent systematic uncertainty and the risers statistical uncertainty. | ||
| − | + | ||
| − | |||
| − | |||
Aπ− ± stat. ± syst. NH3 | Aπ− ± stat. ± syst. NH3 | ||
Aπ+ ± stat. ± syst. NH3 | Aπ+ ± stat. ± syst. NH3 | ||
| Line 584: | Line 763: | ||
[1]M.Osipenko et. al., CLAS-NOTE-2003-001. | [1]M.Osipenko et. al., CLAS-NOTE-2003-001. | ||
| + | |||
[1] E. Christova and E. Leader, Semi-inclusive production-tests for independent fragmentation and for polarized quark densities. hep- ph/9907265 (1999). | [1] E. Christova and E. Leader, Semi-inclusive production-tests for independent fragmentation and for polarized quark densities. hep- ph/9907265 (1999). | ||
| + | |||
[2] K. Nakamure et. al., The Review of Particle Physics. Particle Data Group. J. Phys. G 37, 075021 (2010). | [2] K. Nakamure et. al., The Review of Particle Physics. Particle Data Group. J. Phys. G 37, 075021 (2010). | ||
| + | |||
[3] M. Osipenko, A. Vlassov and M. Taiuti, Matching between the electron candidate track and the Cherenkov counter hit. CLAS-NOTE 2004-020 (2004). | [3] M. Osipenko, A. Vlassov and M. Taiuti, Matching between the electron candidate track and the Cherenkov counter hit. CLAS-NOTE 2004-020 (2004). | ||
| + | |||
[4] C. Lanczos, SIAM Journal of Numerical Analysis, B1, 86 (1964). | [4] C. Lanczos, SIAM Journal of Numerical Analysis, B1, 86 (1964). | ||
| + | |||
[5] K. Park, V. D. Burkert and W. Kim (The CLAS Collaboration), Phys. | [5] K. Park, V. D. Burkert and W. Kim (The CLAS Collaboration), Phys. | ||
Rev. C77, 015208 (2008). | Rev. C77, 015208 (2008). | ||
| + | |||
[6] J. Pierce, Pion Identification code, | [6] J. Pierce, Pion Identification code, | ||
From EG1 Hall-B, WWW Document, (http://www.jlab.org/Hall-B/secure/eg1/EG2000/josh/pion.cc). | From EG1 Hall-B, WWW Document, (http://www.jlab.org/Hall-B/secure/eg1/EG2000/josh/pion.cc). | ||
| + | |||
[7] Unitary Isobar Model, MAID2007, WWW Document, (http://wwwkph.kph.uni-mainz.de/MAID//maid2007/maid2007.html). | [7] Unitary Isobar Model, MAID2007, WWW Document, (http://wwwkph.kph.uni-mainz.de/MAID//maid2007/maid2007.html). | ||
44 | 44 | ||
CLAS-NOTE 2012 | CLAS-NOTE 2012 | ||
| + | |||
[8] R. G. Fersch, Measurement of Inclusive Proton Double Spin Asym- metries and polarized Structure Functions. Doctoral dissertation. The College of William and Mary, Williamsburg, VA (2008). | [8] R. G. Fersch, Measurement of Inclusive Proton Double Spin Asym- metries and polarized Structure Functions. Doctoral dissertation. The College of William and Mary, Williamsburg, VA (2008). | ||
| + | |||
[9] S. E. Khun, Dilution Factor for Exclusive Channels. Old Dominion University, Norfolk, VA (2010). | [9] S. E. Khun, Dilution Factor for Exclusive Channels. Old Dominion University, Norfolk, VA (2010). | ||
| + | |||
[10] Y. A. Prok, Measurement of The Spin Structure Function g1(x, Q2) of the Proton in The Resonance Region. Doctoral dissertation. University of Virginia, Richmond, VA, 2004. | [10] Y. A. Prok, Measurement of The Spin Structure Function g1(x, Q2) of the Proton in The Resonance Region. Doctoral dissertation. University of Virginia, Richmond, VA, 2004. | ||
| + | |||
[11] K. V. Dharmawardane et. al., (The CLAS Collaboration), Phys. Lett. B641, 11 (2006). | [11] K. V. Dharmawardane et. al., (The CLAS Collaboration), Phys. Lett. B641, 11 (2006). | ||
| + | |||
[12] P. Bosted et. al., Interpolated model calculated dilution factors for EG1b directly from radiated cross-sections, WWW Document, (http://www.jlab.org/Hall-B/secure/eg1/EG2000/fersch/DILUTION/ dilutionmodel/) (2007). | [12] P. Bosted et. al., Interpolated model calculated dilution factors for EG1b directly from radiated cross-sections, WWW Document, (http://www.jlab.org/Hall-B/secure/eg1/EG2000/fersch/DILUTION/ dilutionmodel/) (2007). | ||
| + | |||
[13] A. Airapetian et. al., (The HERMES Collaboration), Phys. Rev. Lett. 92, 012005 (2004). | [13] A. Airapetian et. al., (The HERMES Collaboration), Phys. Rev. Lett. 92, 012005 (2004). | ||
[SIDIS_PionAsym_EG2000] | [SIDIS_PionAsym_EG2000] | ||
Latest revision as of 20:10, 3 June 2014
sample TeX file for CLAS note
Abstract
Semi-inclusive deep inelastic scattering (SIDIS) experiments may be used to identify the flavor of the quark that participates in the scattering process. Semi-inclusive scattering is defined as an electron scattering experiment in which the scattered electron and one hadron are detected in the final state. Experiments at Jefferson Lab have used longitudinally polarized electrons to probe longitudinally polarized hydrogen and deuterium targets and investigate the quark’s contribution to nucleon properties. This work reports on a measurement of SIDIS pion asymmetries using the CEBAF Large Acceptance Spectrometer (CLAS) at Thomas Jefferson National Accelerator Facility. The incident electron’s energy was 4.2 GeV and covered a kinematic region where the struck quark carries at least 30% of the nucleons total momentum (). The electrons scatter mostly from valence quarks in this kinematic region allowing measurements which are less sensitive to the ocean of quark-antiquark pairs that are also inside a nucleon.
Data Analysis
Semi-inclusive deep inelastic scattering (SIDIS) experiments using longitudinally polarized hydrogen and deuterium targets and a longitudinally polarized electron beam can be used to measure the fractional polarization of down quarks in the nucleon . Semi-inclusive scattering identifies an electron scattering experiment in which the scattered electron and one hadron are detected in the final state. This chapter describes the techniques used to analyze the data collected during the EG1b experiment and calculate semi-inclusive cross sections for the following reactions:
and
using NH3 and ND3 polarized targets respectively. The goal of this work is to measure charged pion asymmetries defined according to the incident electron helicity and the target polarization. This work focuses on a kinematic region where the struck quark carries at least 30% of the nucleons total momentum . The leptons scatter mostly from valence quarks in this kinematic region allowing contributions from sea quarks to be neglected. The above measurements are able to distinguish between the predictions made by the hyperfine perturbed quark constituent model (pQCM) and perturbative Quantum Chromodynamics (pQCD). As a result, the following study can be used to test the validity of the above models describing the structure of the nucleon.
The CLAS Data Selection
The data files from the EG1b experiment chosen for this analysis are listed in Table 1.1. The experiment probed polarized NH3 and ND3 targets using longitudinally polarized electrons accelerated to three difference energies; 2.2 GeV, 4.2 GeV and 5.7 GeV. This work analyzed the data collected using a 4.2 GeV electron as this energy provided the most statistics. The restrictions applied to the reconstructed events are described in the sections below.
| Run Set | Target Type | Torus Current(A) | Target Polarization | HWP |
| 28100 - 28102 | ND3 | +2250 | -0.18 | +1 |
| 28106 - 28115 | ND3 | +2250 | -0.18 | -1 |
| 28145 - 28158 | ND3 | +2250 | -0.20 | +1 |
| 28166 - 28190 | ND3 | +2250 | +0.30 | +1 |
| 28205 - 28217 | NH3 | +2250 | +0.75 | +1 |
| 28222 - 28236 | NH3 | +2250 | -0.68 | +1 |
| 28242 - 28256 | NH3 | +2250 | -0.70 | -1 |
| 28260 - 28275 | NH3 | +2250 | +0.69 | -1 |
| 28287 - 28302 | ND3 | -2250 | +0.28 | +1 |
| 28306 - 28322 | ND3 | -2250 | -0.12 | +1 |
| 28375 - 28399 | ND3 | -2250 | +0.25 | -1 |
| 28407 - 28417 | NH3 | -2250 | +0.73 | -1 |
| 28456 - 28479 | NH3 | -2250 | -0.69 | +1 |
| Table 1.1. EG1b Runs analyzed for this work. |
Particle Identification
Additional tests were performed on the electron and a pion candidates reconstructed by the standard CLAS software package RECSIS. Electrons are identified by matching the charged particle hits in the Cherenkov counter (CC), electromagnetic calorimeter (EC), and the time of flight system (ToF). The geometrical and timing constraints described in reference [3] were applied to improve electron identification. Additional constraints are applied on the energy deposited by the particle into the calorimeter and the number of photoelectrons produced in the Cherenkov counter. Charged pions are identified by matching the hits in the drift chamber (DC) and ToF counter along with a requirement that the number of photons observed in the CC be less than two for the pions.
Electron Identification
The CLAS trigger system required a particle to deposit energy in the electromagnetic calorimeter and illuminate the Cherenkov counter within a 150 ns time window (Figure 1.1). Unfortunately, this trigger suffers from a back- ground of high energy negative pions that may be misidentified as electrons. The pion contamination of the electron sample is reduced using cuts on the energy deposited in the electromagnetic calorimeter and the momentum measured by reconstructing the particles track in the known magnetic field. The total energy deposited by electron in the EC is proportional to their kinetic energy, whereas the energy deposited by pions is relatively independent of their momentum since the pions entering the EC are minimum ionizing particles(Figure 1.2). Geometrical and time matching cuts between the Cherenkov counter hit and the measured track in the drift chamber were developed to suppress the pion background further.
EC CUTS
The CLAS electromagnetic calorimeter was used to reduce the misidentification of negatively charged pions as electron candidates. The electromagnetic calorimeter contains thirteen layers of lead-scintillator sandwiches composed of 2 mm thick lead and 10 mm thick scintillator sections. Each set of thirteen layers is subdivided into five inner and eight outer layers that are named the inner and outer calorimeter respectively. Electrons interacting with the calorimeter produce electromagnetic showers that release energy into the calorimeter. The deposited energy is proportional to the momentum of the electrons. Figure 1.3 shows the correlation of the inner and outer calorimeter electron candidate’s energy measured by the calorimeter and divided by the particles momentum reconstructed by the drift chamber. As shown in Figure 1.3, there is an island near E/p = 0.2, which contains most of the electron candidates as well as some regions below 0.2 which will be argued to be negative pions misidentified as electrons.
Pions entering the calorimeter are typically minimum ionizing particles, loosing little of their incident energy in the calorimeter at a rate of 2 . Electrons, on the other hand, deposit a larger fraction of their momentum into the calorimeter. As a result, the energy deposited into the electromagnetic calorimeter is different for electrons and pions. Pions loose about 0.08 GeV of energy traversing the calorimeter independent their momentum thereby producing a constant signal in the calorimeter around 0.08 GeV. In order to reduce misidentified pions from the electron sample, the following cut
ECinner > 0.08 × p, (1.1) where p represents a particle’s momentum and ECinner the energy deposited into the inner part of the calorimeter. Since the energy loss of pions is related to the calorimeter thickness, a correlation can be established between the energy deposited into the inner and outer layers of the calorimeter: ECtot = 13, (1.2) ECinner 5 and results in the following cut for the energy deposition into the outer layer of the calorimeter: ECtot > 0.2 × p. (1.3)
Cherenkov Counter Cut
The Cherenkov counter has been used to further reduce the negatively charged pion background in the reconstructed electron sample. When the velocity of a charged particle is greater than the local phase velocity of light or when it enters a medium with different optical properties, the charged particle can emit photons. Cherenkov light is emitted at the critical angle representing the angle of Cherenkov radiation relative to the particle’s direction. It can be
has been applied: 
Fig. 1.3: ECinner/p versus ECtot/p before and after EC cuts (ECtot > 0.2p and ECinner > 0.08p). After applying EC cuts about 46% of the events have been removed from the electron sample. shown that the cosine of the Cherenkov radiation angle is inversely proportional to the velocity of the charged particle cosθc = 1 , (1.4) nβ
where βc is the particle’s velocity and n the index of refraction of the medium. The charged particle in time t travels a distance βct, while the electromagnetic waves travel c t. For a medium with given index of refraction n, there is a n threshold velocity βthr = 1 , below which no radiation is emitted. This process n may be used to distinguish between the highly relativistic electrons and the less relativistic pions based on the number of photons produced in the Cherenkov detector. The number of photons produced per unit path length of a particle with charge Ze and per unit energy interval of the photons is proportional to the sine of the Cherenkov angle [2]
Taylor expanding Eq. 3.6 and keeping only the first two terms we get following
The gas used in the CLAS Cerenkov counter is perfluorobutane C4F10 with an index of refraction equal to 1.00153. Approximately thirteen photoelec- trons are produced by electrons traversing the Cherenkov detector. On the
other hand, calculations show that the number of photons produced by the negatively charged pions in the Cherenkov detector is approximately two. The theoretical results of the number of photons produced by the electrons and pions when passing through the Cherenkov counter are shown on Figure 1.4.
Fig. 1.4: Theoretical Calculation of the Number of Photoelectrons for electrons and pions.
The distribution of the number of photoelectrons measured in the Cherenkov detector and the energy deposition dependence on number of photoelectrons are shown on Figure 1.5 and Figure 1.6. Pions, misidentified as electrons appear on Figure 1.5 at nphe<2.5.
Geometric and Timing cuts
Negative pions may be produced when the lepton scatters at a polar angle close to zero and is not observed by the detector. In order to reduce the electron sample contamination by those pions, geometrical cuts on the location of the particle at the entrance to the Cherenkov detector and time matching cuts have been developed by Osipenko [3]. For each CLAS Cherenkov detector segment the following cut has been applied
, (1.9)
where represents the measured polar angle with respect to a projectile plane for each electron event and the width of the polar angle . The Cherenkov counter’s projective plane is an imaginary plane behind the Cherenkov detector where Cherenkov radiation would have arrived if it had moved the same distance from the emission point to the PMT, without reflections in the mirror system. is the polar angle from the CLAS detector center to the image of Cherenkov counter segment center and is the shift in the segment center position. In addition to geometrical cuts, timing cuts have been applied to match the time between a Cherenkov counter hit and the time of flight system.
The pion contamination in an electron sample was estimated by fitting the photoelectron distribution using two Gaussian distributions convoluted with a Landau distribution [4]:
(1.10)
The fits in Figure 1.7.(a) suggest that the pion contamination in the electron sample is 9.63% ± 0.01% before applying the OSI cuts and after the OSI cuts the contamination is about 4.029% ± 0.003% (Figure 1.7.(b)).
Fig. 1.7: The number of photoelectrons before and after geometrical and time matching cuts.
Pion Identification
Charged pions are identified using a coincidence hit in the drift chamber and Time-of-Flight (ToF) counter. Pions are separated from the other charged particles by looking at the particle momentum versus the β distribution. The particle velocity, β = v , is calculated from the difference of the RF time and the c time-of-flight measurement in the ToF system with the path length from the
vertex to the ToF counters. The mass of the charged particle can be identified by combining the particle’s β with the particle momentum obtained from the track measured by the drift chamber in the known magnetic field. The particle mass in a magnetic field is given as
,
(1.11) (1.12) (1.13)
where m is the mass of the charged particle, its velocity, p particle momentum, Lpath the path length from the vertex to scintillators and tflight the time of flight from the interaction vertex to the ToF system.
Using the above information (particle momentum from the drift cham- bers and the timing information from the ToF system), the mass squared of the charged particle was calculated and is shown on Figure 1.9. The pion mass band is distributed around zero. To isolate charged pions from the rest of the particles, a cut on the momentum versus distribution has been applied [5].
In addition to the charged particle velocity (), the fiducial volume cuts have been applied for the charged pion identification. For the EG1b experiment, pions were detected from to [5]. The pion identification code has been developed by Joshua Pierce [6].
Fig. 1.8: The charged particle momentum versus distribution. The pion and proton bands are clearly separated.
Event Reconstruction Efficiency
The goal of this work is to measure the semi-inclusive asymmetry when an electron and a pion are detected in the final state. For this analysis, pions of opposite charge will be observed using the same scintillator paddles by flipping the CLAS torus magnetic field direction. Although pions will be detected by the same detector elements, electrons will intersect different detector elements. As a result, the electron reconstruction efficiency was evaluated in terms of the electron rate observed in two different scintillator paddles detecting the same electron kinematics.
Inclusive Electron Event Reconstruction Efficiency
The electron reconstruction efficiency for individual scintillator detec- tors using the 4.2 GeV EG1b data set is investigated below. Only the electron is detected in the final state (inclusive case). The pion contamination in the electron sample was removed by applying the cuts described above. The electron paddle numbers 10 (B<0) and 5 (B>0) were chosen respectively, because they contained the most electron events in a first pass semi-inclusive pion analysis of the data set. The electron kinematics (momentum, scattering angle and invariant mass) for these scintillators is shown on Figure 1.10.
Ratios of the inclusive electron rate, normalized using the gated Faraday cup and detected in scintillator paddles # 5 and # 10, were measured. Two ratios are constructed to quantify the CLAS detector’s ability to reconstruct electrons in scintillator paddle #5 using a positive Torus polarity and scintillator #10 using the negative Torus polarity.
The above ratios are statistically the same. The semi-inclusive analysis to be performed in this work will be taking ratios using an and target. Below is the observed ratio comparing the inclusive electrons observed by scintillator #5 for a positive torus polarity and an target to the electrons observed by scintillator #10 when the torus polarity is negative and the target is .
Fig. 1.10: Electron Kinematics. (a) Electron Momentum, (b) Electron Scattering Angle and (c) W Invariant mass((, B>0), (, B<0), (, B>0) and (, B<0)).
The above ratios, which have been observed to be ammonia target independent, indicate a difference in an electron detector efficiency when the torus polarity is flipped. An electron detection efficiency "correction coefficient" is defined in terms of the above ratio and measured to be and . The impact of these corrections on the data is illustrated in the next section.
Exclusive and Semi-Inclusive Event Reconstruction Efficiencies
The measured single pion electroproduction rate was compared to the MAID 2007 unitary model \cite{MAID2007}, that has been developed using the world data of pion photo and electro-production, to determine the impact of using the above electron reconstruction efficiency "correction coefficient". The MAID 2007 model has predictions of the total cross section for the following two cases that are relevant to our work:
Using MAID 2007, the total cross section was calculated for the following invariant mass and four momentum transfer squared values: 1.7 GeV < W<1.8 GeV and =1.1 GeV \cite{MAID2007}. The exclusive total cross section for such reactions may be expressed as
where is the pion azimuthal angle in the CM frame, is the virtual photon polarization, the energy difference of the initial and final state electron, the four momentum transfer squared, the electron scattering angle and the electron helicity.
The ratio of the pions detected for the opposite torus particles in the scintillator paddles, located between the Cherenkov counter and electromagnetic calorimeter, is shown in Figure~\ref{fig:PionPaddleNumbervsRatio}. Ratios were measured for four different cases. The intrinsic assumption is that, for the inbending case, positive pions and for the outbending case negative pions have the same trajectories when they have the same kinematics. In addition, negatively charged pions in the inbending field and positively charged pions in the outbending fields are detected by the same detector elements.
Fig. 1.11: Pion paddle number versus the Semi-Inclusive ratio.
After applying corrections determined by the inclusive events, the ratios were compared to the results from MAID2007. The difference of the measured and MAID2007 model ratios for each pion paddle number is shown in Figure~\ref{fig:MAID2007Experiment}. One can argue, using Figure~\ref{fig:MAID2007Experiment}, that the "inclusive corrections" do not impact single pion production rates for the exclusive cases.
Fig. 1.12: Pion Paddle Number versus MAID2007 - Experiment(N (, ND) / N(, NH)). The Black and red data represent B>0/B<0 and B<0/B>0 cases respectively before corrections. The green and blue points represent the ratios for B>0/B<0 and B<0/B>0 after inclusive corrections.
Asymmetries
The double spin asymmetry measurements in this work are performed by comparing scattering events that occur when the incident probe spin and nuclear target spin are parallel to the scattering events that occur when the spins are anti-parallel.
Beam Charge Asymmetry
The helicity of the electron beam was flipped at a rate of 1 Hz. The helicity is prepared at the source such that helicity pairs are produced pseudo randomly.
Fig. 1.13: The Helicity State: A one bit signal from the beam injector gives the helicity information. A sync bit with a 2 Hz frequency is generated to indicate the start of a helicity state.
If the first electron bunch is pseudo randomly chosen to be positive (negative) then it is labeled as the original helicity state and denoted in software by a 2 (1). The next helicity state is prepared to be a complement to the first state and labeled in the software as either a 4, if the original helicity state was a 1 (negative), or 3 if the original helicity state was a 2 (positive). The helicity selection process is then repeated.
Figure 1.13 illustrates the signals used to label the helicity states. The clock pulse (SYNC) is used to indicate that a change in the pockel cell used to define the helicity state may have occurred. The helicity bit identifies the helicity state that was set. The original/complement pulse identifies if the state is an original or complement helicity state. All three bits are recorded in the raw data file for each event and then converted to the labels 1, 2, 3, 4 during DST file production once the particles have been reconstructed.
Two scalers were used to record several ancillary detectors, such as a Faraday cup and several PMTs mounted on the beam line, according to their helicity label. One of the scalers was gated by the DAQ live time in order to record beam conditions when the DAQ was able to take data and not busy recording data. The second scaler remained ungated. Both scalers recorded the SYNC and Helicity signals from the injector along with the counts ob- served from ancillary detectors during the SYNC interval. The Faraday cup signal recorded by the gated helicity scaler is used to normalize the events reconstructed during the same helicity interval.
The beam charge asymmetry is defined in Eq. 1.21 and measured using the gated helicity scaler. For each run number, a gaussian fit was used to fit the beam charge asymmetry distributions as in Figure 1.14. The beam charge asymmetry is defined as
(1.20)
where () represents the Faraday cup counts observed for the original helicity 1 and 2 states (the complement helicity 3 and 4 states).
Fig. 1.14: Beam charge asymmetry for run #28101 using the gated Faraday cup counts for two helicity pairs (1-4 and 2-3 helicity pairs). and
EG1b data sets, with the same half wave plate, target type, target polarization, and beam torus have been combined. The beam charge asymmetries have been calculated for the each run group and are listed in Table 1.2.
| Run Group | Half wave plate(HWP) | ||
| 28100 - 28105 | +1 | ||
| 28106 - 28115 | -1 | ||
| 28145 - 28240 | +1 | ||
| 28242 - 28284 | -1 | ||
| 28286 - 28324 | +1 | ||
| 28325 - 28447 | -1 | ||
| 28449 - 28479 | +1 |

Table 1.2: Run Group versus Beam Charge Asymmetry.
Electron Asymmetry
A measurement of the electron cross section helicity difference needs to account for a possible helicity dependence of the incident electron flux (charge asymmetry). Figure~\ref{fig:RunvsEAsym} shows the reconstructed electron rate asymmetry, before it is normalized by the gated Faraday Cup, as a function of the run number for the 4.2 GeV data set. The reconstructed electron asymmetry can be defined following way:
or
where () represents number of electron scattered for the positive (negative) beam helicity state.
Fig. 1.15: Run Number versus Electron Asymmetry before FC normalization. The black and red points represent reconstructed electron asymmetry for the helicity 1-4 pair for and target respectively. The blue and green points represent the helicity pair 2-3 for and respectively. The green line shows the sign of the half wave plate (HWP) and the purple line is the sign of the target polarization (TPol).
Systematic effects on the asymmetry measurement may be investigated by separating the data into two groups based on which helicity state is set first. The first group (black data points) represents the electron asymmetry observed when the first (original) helicity state is negative and its complement state is positive (helicity state #1 - state #4). The second group (red data points) represents the asymmetry observed when the first state is positive and the complement state is negative (helicity state #2 - #3). Both groups were divided into two subgroups based the target type used. The diamond points on the histogram represent the data for the target and the squares for the target. Two lines on the histogram are used to identify the sign of the half wave plate (HWP) and the target polarization (TPol). The relative spin orientation can be changed by either inserting a half wave plate (HWP) or by populating a different target polarization state with a different RF frequency. One would expect the asymmetry to change sign if either the HWP is inserted or the target polarization is rotated 180 degrees. As one can see for Figure~\ref{fig:RunvsEAsym} and Figure~\ref{fig:WvsNESAsym}, the electron asymmetry changes sign if the HWP or the target polarization is reversed.
Fig. 1.16: W versus and . The electron asymmetry changes sign when the target polarization is reversed.
The un-normalized reconstructed electron asymmetry has been calculated as:
and the Faraday cup normalized asymmetry as:
(1.23) (1.24)
Fig. 1.17: Run number versus electron asymmetry after applying FC normalization. The black and red points represent the reconstructed electron asymmetry for the helicity 1-4 pair for and target respectively. The blue and green points are the helicity pair 2-3 for and respectively. The green line shows the sign of the half wave plate (HWP) and the purple line is the sign of the target polarization (TPol).
Semi-Inclusive Asymmetries
%The ratio of the combined semi-inclusive deep inelastic asymmetries () from the Table. 4.3 , for two different torus settings have been corrected for the electron reconstruction efficiency. The Fig. 4.7 represents asymmetry ratios before and after electron reconstruction efficiency. The ratios have been calculated for each target and charged pion type. SIDIS asymmetries are statistically the same. The results suggest electron reconstruction efficiency do not make significant change on the asymmetries.
The asymmetries from semi-inclusive pion electroproduction using proton or deuteron targets can be written in terms of the difference of the yield when the electron spin is parallel and antiparallel to the spin of the nucleon. There are four combinations of semi-inclusive asymmetries: , , and
where () and () represent the number of and hadrons detected in the final state with the scattered electron when the spin of the initial electron beam was antiparallel (parallel) to the spin of the proton and neutron respectively.
The kinematic coverage for the events used in the measured asymmetries are shown on Figure~\ref{fig:InvariantMassvsQ2} and Figure~\ref{fig:MissingMassM_X}. The semi-inclusive asymmetries are listed in Table~\ref{tab:RunvsSIDISAsym}. The first group represents the asymmetry measured when the first original electron spin (hel1) is antiparallel to the target nucleon spin and its complement state (hel4) is parallel, whereas the second group represents measuring the SIDIS asymmetry when the first helicity state is parallel (hel2) and its complement state (hel3) is antiparallel to the spin of the nucleon. For the final measurement, the two groups are combined into one set, in order to increase statistics. Instead of looking at original and complement electron helicity states, they have been combined into the positive (hel42) and negative (hel13) helicity states, which are parallel and antiparallel to the spin of the target nucleon respectively.
Fig. 1.18: Invariant Mass versus .
Fig. 1.19: Missing Mass. The line represents a cute used to remove events with < 1.6 GeV from the semi-inclusive analysis.
The ratio of the combined semi-inclusive deep inelastic asymmetries (Araw) from Table 1.3, for two different torus settings have been corrected for the electron reconstruction efficiency. The Figure 1.20 represents the raw asymmetry ratios before and after electron reconstruction efficiency corrections. The ratios have been calculated for each target and charged pion type. The SIDIS asymmetries before and after the correction are statistically the same. The result indicates that the electron reconstruction efficiency does not change the asymmetries.
|  Target type, Beam Torus | |||
| , B>0, | |||
| , B<0, | |||
| , B>0, | |||
| , B<0, | |||
| , B>0, | |||
| , B<0, | |||
| , B>0, | |||
| ND_{3}$, B<0, $\pi^{+}$ & $-29.22 \pm 107.53$ & $123.98 \pm 106.86$ & $92.25 \pm 85.38$ |
Table 1.3: SIDIS Asymmetry for Each Type Target material and Beam Torus.
The data have been combined for each target type and asymmetries measured for two values (Table 1.4). The SIDIS asymmetries were calcu- lated for the following kinematic range: electron scattering angle 17.5<<18.5, electron momentum 2.55 GeV< <2.75 GeV, invariant mass 1.6 GeV<W<1.8 GeV and momentum transfer squared 0.9 <<1.3 .
Fig. 1.20: The ratio of the SIDIS asymmetries for two torus field settings Araw(B>0) versus target and the charged pion type. The black squares represent the data before electron reconstruction efficiency and the red data - after electron reconstruction efficiency has been applied.
SIDIS Asymmetry xB = 0.3 xB = 0.4 Aπ+,raw NH3 (150.08 ± 65.96) × 10−4 (217.20 ± 69.06) × 10−4 Aπ−,raw ND3 (39.04 ± 81.44) × 10−4 (91.90 ± 96.14) × 10−4 Aπ−,raw NH3 (100.81 ± 83.49) × 10−4 (−23.98 ± 94.92) × 10−4 Aπ+,raw ND3 (53.17 ± 74.89) × 10−4 (85.17 ± 82.97) × 10−4 Table 1.4: SIDIS Asymmetries for xB = 0.3 and xB = 0.4.
In addition to xB, the data have been subdivided according to the frac- tion energy of the observed final state pion . Aπ+,raw asymmetries for two z NH3 are shown in Table 1.5. 31 z xB = 0.3 xB = 0.4 0.4 0.7 1.4.4 CLAS-NOTE 2012 (125.62 ± 81.92) × 10−4 (165.81 ± 86.76) × 10−4 (140.32 ± 158.98) × 10−4 (238.34 ± 156.79) × 10−4 Table 1.5: Aπ+,raw SIDIS Asymmetry. NH3
Dilution Factor
To account for the contributions of polarized nucleons from the nitrogen nuclei in the ammonia target and the cooling material of the target (Helium) cell to the semi-inclusive rates, the measured raw double spin asymmetries have to be divided by a dilution factor. The dilution factor accounts for the fraction of events coming from the desired polarized target nucleon. The dilution factors are calculated by combining the data from runs using different target types. During the EG1b experiment, several runs were taken with Carbon C12 and an empty target cell (He). All the runs in this work used liquid Helium as the coolant during the experiment. The Carbon and empty target runs were used to estimate the dilution of the data by the noise attributed to the interaction of the incident electron beam with the Nitrogen or Helium nucleons present in the target cell [8].
In order to calculate the dilution factor, we need to define the number of counts with beam helicity negative and positive for ammonia (NA), Carbon (NC) and empty target (NMT) runs. All are weighted by the corresponding gated Faraday cup counts [9]. Normalized rates for Carbon and empty target types are defined as
N+ +N−
n = C,MT C,MT (1.29)
C,MT FC+ +FC− 32

and
1NA+ NA− nA=2(FC+ +FC−), (1.30) where nC is the rate from a Carbon target, nMT is from an empty target and nA is from one of the NH3 or ND3 ammonia targets.
The counts for all four targets (empty, Carbon and ammonia) can be expressed as the sum of counts from the entrance and exit window foils (ρF, lF, σF), liquid Helium coolant (ρHe, lHe, σHe), Carbon(ρC, lC, σC), Nitrogen (ρN, lN, σN), Hydrogen (Deuterium) (ρH(D), lH(D), σH(D)). and nMT = ρFlFσF + ρHeLσHe = fρClCσC + ρHeLσHe, nC = ρFlFσF + ρClCσC + ρHe(L − lC)σHe, (1.31) (1.32) nA = ρFlFσF + ρHe(L − lA)σHe + ρAlA(σN + 3σH(D)), where f ≡ ρFlFσF , σ represents the Hydrogen (Deuteron) cross section. ρClCσC H(D) (1.33)
Using above system of equations, we define two new spectra to account for the Carbon target and the difference in the amount of Helium in ammonia targets vice versus the Carbon target. For a target cell with length L and the Carbon target with length lC, the Carbon and LHe contributions can be written following way: and n′12C= L nC− L−lC nMT=ρClCσC L+flC L+flC n′4He = (1 + f )lHe nMT − f lHe nC = ρHelHeσHe, L+flC L+flC (1.34) (1.35) where n′12C is the rate from the Carbon nucleus only and n′He is the rate from liquid Helium only. The length and densities are listed in Table 1.6.
We need to establish how the rate from the Carbon target is related to the rate from the N15 in NH3 and ND3. The cross section for N15 can be written in terms of the cross sections on C12 target material (σ12C) and on a bound neutron in N15 (σn′ ). σ15N ≈7σ12C+σn′ =7+ σn′ σ12C. (1.36) 6 6 σ12C
It is assumed that when the scattering occurs on protons inside the target material, the ratio of σn′ = 0 and when the reaction happens on neutrons σ12C inside the target, the value of the ratio is σn′ = 1, because there are six σ12C 6
Using the above quantities, the background represented by the number bound neutrons in C12 [9]. of counts due to the non-hydrogen and non-deuterium parts of the ammonia target can be expressed as nB = ρAlA7+ σn′ +fn′12C+(L−lA)n′4He ρClC 6 σ12C = nMT+lA ρA 7+ σn′ n′12C−n′4He. (1.37) ρClC 6 σ12C The dilution factor df is df = nA − nB . (1.38) nA Item Description Value ρFlF Density times target length for empty target. Al: 167 μm; 0.045 g/cm2. Kapton: 384 μm; 0.055 g/cm2 . Total=Al + Kap- ton=0.0996 g/cm2 ρClC Density times target length for Carbon target. 0.498 g/cm2 f The ratio of counts from foils to the C12 slab in the Carbon target. 0.200 ρHe He density. 0.145 g/cm3 L The length of the target cell from the entrance to exit foil. 1.90 cm ρC C12 density. 2.17 g/cm3 lC Carbon target length. 0.23 cm ρNH3 NH3 density 0.917 g/cm3 ρND3 ND3 density 1.056 g/cm3 lA Ammonia target length. 0.6 cm Table 1.6: Length and density values for different types of target material reproduced from the EG1b experiment [9]. The dilution factor is compared below in Table 1.8: 35 CLAS-NOTE 2012 The fractional energy of the observed final state hadron(z) Dilution Factor(df) NH3,π+ &&z=0.4 0.160 ± 0.02 0.152 ± 0.03 Table 1.7: Calculated dilution Factor for NH3 target type. NH3,π+ &&z=0.7  Reaction Dilution Factor(df) Resonance region 0.11 - 0.13 Inclusive 0.14 - 0.17 Semi-Inclusive 0.122 - 0.182 Table 1.8: Dilution Factor compared with other results [8] [10].
Results
Semi-Inclusive Pion Asymmetries
The final results are presented in this chapter. They have been obtained by analyzing the data collected in 2000 - 2001 at Thomas Jefferson National Laboratory using a longitudinally polarized electron beam on a longitudinally polarized Hydrogen (15NH3) and Deuterium (15ND3) targets. The incident electron’s energy was 4.2 GeV. The CEBAF Large Acceptance Spectrometer (CLAS) was used for particle detection. The measurements were made for the kinematic region where xB ≥ 0.3 and momentum transfer squared Q2=1.1 ± 0.2 GeV2. The SIDIS asymmetries were measured at four different values of xB and are presented on Figure 2.1.
Systematic Errors
The results presented in the previous sections include only statistical uncertainties. However, the experimental setup and the cuts used for particle identification and background reduction are sources of systematic errors. This section describes the methods used for estimating the systematic errors from each type of source. The systematic errors for the SIDIS asymmetries are shown 37 CLAS-NOTE 2012 Fig. 2.1: xB versus SIDIS pion asymmetries. in Table 2.1. The total systematic error is calculated by combining individual systematic errors in quadrature. 1.40 × 10⁻² 3.50 × 10⁻² 1.87 × 10⁻² 0.64 × 10⁻² 4.26 × 10⁻² Table 2.1: Summary of the systematic errors for the Aπ+ NH3 38 Source Systematic Error Geometrical and timing cuts Electromagnetic calorimeter cut Dilution Factor Target and beam polarization Total asymmetry. The systematic errors associated with the electromagnetic cuts and fidu- cial cuts for electron identification were calculated by comparing the SIDIS asymmetries before and after cuts were applied. As can be seen, the effect due to the electromagnetic calorimeter and fiducial cuts is on the order of 3.5 % and 1.4% respectively (Figure 2.2). (a) (b) Fig. 2.2: xB versus Aπ+ SIDIS Asymmetry: (a) geometrical and timing cuts, NH3 (b) electromagnetic calorimeter cuts.
Dilution factor
Systematic effects related to the dilution factor were estimated the following way: First, the SIDIS asymmetries were calculated for the standard values of the dilution factor. Then asymmetries were recalculated by changing the value of each parameter by the amount of its uncertainty. The difference between these two values is the systematic effect due to the dilution factor. The resulting shift is about 1.9% (Figure 2.3).
2.2.1 Cut Dependence 
Fig. 2.3: xB versus Aπ+ SIDIS Asymmetry. NH3 2.2.3 Polarization Systematic effects due to the target and beam polarization were esti- mated following way: First, the SIDIS asymmetries were calculated for the standard values of the Pt×Pbpolarization. Then asymmetries were recalculated by changing the value of each parameter by the amount of its uncertainty. The difference between these two values is the systematic error associated with the target and beam polarization, which is approximately 0.6% (Figure 2.4).
Fig. 2.4: xB versus Aπ+ SIDIS Asymmetry. NH3
Semi-Inclusive Pion Asymmetries
The corrected measured semi-inclusive deep inelastic asymmetries Aπ+ , NH3 Aπ− , Aπ+ and Aπ− are shown below on Figure 2.5 and compared to NH3 ND3 ND3 the asymmetries measured by the HERMES experiment. The SIDIS asymmetries for longitudinally polar- ized Hydrogen (15NH3) and Deuterium (15ND3) targets are listed in Table 2.2 for four values of xB. The asymmetries have been corrected for the target and beam polarization [11] and dilution factor from ref[12].
(a) (b) (c) (d) Fig. 2.5: xB versus SIDIS Asymmetry: (a) Aπ+ , (b) Aπ− (c) Aπ+ and π− NH3 NH3 ND3 (d) AND3. The solid black squares are measurements from ref[13] and the solid black diamonds represent SIDIS asymmetries measured using the data collected during the EG1b experiment. The error bar lines represent systematic uncertainty and the risers statistical uncertainty.
Aπ− ± stat. ± syst. NH3 Aπ+ ± stat. ± syst. NH3  xB  0.1644 ± 0.0504 ± 0.0191 0.2733 ± 0.0400 ± 0.0229 0.3308 ± 0.0499 ± 0.0407 0.2521 ± 0.1257 ± 0.0387 Aπ+ ± stat. ± syst. ND3 0.1378 ± 0.0745 ± 0.0183 0.1183 ± 0.0583 ± 0.0176 −0.0917 ± 0.0753 ± 0.0361 −0.1908 ± 0.1942 ± 0.0374 Aπ− ± stat. ± syst. ND3 0.30  0.35  0.40  0.45  xB 0.30 0.35 0.40 0.45   0.2273 ± 0.0317 ± 0.0351 0.0209 ± 0.0314 ± 0.0164 0.3368 ± 0.0322 ± 0.0583 0.2408 ± 0.0377 ± 0.0485 0.1286 ± 0.0320 ± 0.0240 0.1904 ± 0.0319 ± 0.0306 0.1080 ± 0.0330 ± 0.0386 0.5125 ± 0.0392 ± 0.0787    Table 2.2: Semi-inclusive asymmetries on the proton and deuterium targets (Aπ+,π− and Aπ+,π− ). NH3 ND3
Bibliography
[1]M.Osipenko et. al., CLAS-NOTE-2003-001.
[1] E. Christova and E. Leader, Semi-inclusive production-tests for independent fragmentation and for polarized quark densities. hep- ph/9907265 (1999).
[2] K. Nakamure et. al., The Review of Particle Physics. Particle Data Group. J. Phys. G 37, 075021 (2010).
[3] M. Osipenko, A. Vlassov and M. Taiuti, Matching between the electron candidate track and the Cherenkov counter hit. CLAS-NOTE 2004-020 (2004).
[4] C. Lanczos, SIAM Journal of Numerical Analysis, B1, 86 (1964).
[5] K. Park, V. D. Burkert and W. Kim (The CLAS Collaboration), Phys. Rev. C77, 015208 (2008).
[6] J. Pierce, Pion Identification code, From EG1 Hall-B, WWW Document, (http://www.jlab.org/Hall-B/secure/eg1/EG2000/josh/pion.cc).
[7] Unitary Isobar Model, MAID2007, WWW Document, (http://wwwkph.kph.uni-mainz.de/MAID//maid2007/maid2007.html). 44 CLAS-NOTE 2012
[8] R. G. Fersch, Measurement of Inclusive Proton Double Spin Asym- metries and polarized Structure Functions. Doctoral dissertation. The College of William and Mary, Williamsburg, VA (2008).
[9] S. E. Khun, Dilution Factor for Exclusive Channels. Old Dominion University, Norfolk, VA (2010).
[10] Y. A. Prok, Measurement of The Spin Structure Function g1(x, Q2) of the Proton in The Resonance Region. Doctoral dissertation. University of Virginia, Richmond, VA, 2004.
[11] K. V. Dharmawardane et. al., (The CLAS Collaboration), Phys. Lett. B641, 11 (2006).
[12] P. Bosted et. al., Interpolated model calculated dilution factors for EG1b directly from radiated cross-sections, WWW Document, (http://www.jlab.org/Hall-B/secure/eg1/EG2000/fersch/DILUTION/ dilutionmodel/) (2007).
[13] A. Airapetian et. al., (The HERMES Collaboration), Phys. Rev. Lett. 92, 012005 (2004).
[SIDIS_PionAsym_EG2000]
