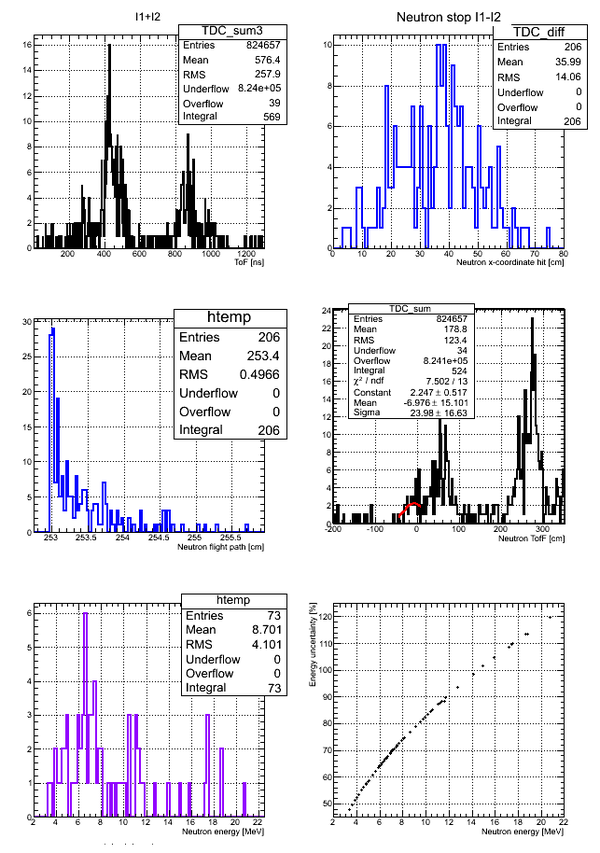
Difference between revisions of "Runs 4111(D2O)/4112(H2O)"
| (94 intermediate revisions by the same user not shown) | |||
| Line 23: | Line 23: | ||
[[File:run_4111_subtr4.png | 600 px]] | [[File:run_4111_subtr4.png | 600 px]] | ||
| − | == | + | ==Preliminary data analysis== |
Neutron energy distribution data analysis for run 4111: | Neutron energy distribution data analysis for run 4111: | ||
[[File:D2O_neutron_spectra.pdf]] | [[File:D2O_neutron_spectra.pdf]] | ||
| + | |||
| + | Correlation between the neutron energy and neutron energy uncertainty is plotted below: | ||
| + | |||
| + | [[File:Error_plot_detM.png | 400 px]] | ||
| + | |||
| + | The above plot may look better if you plot <math>Energy</math> -vs- (<math>Energy \pm Energy</math>) | ||
| + | As the energy increased the uncertainty increases to the point the the error bar is as big as the magnitude of the energy. | ||
| + | |||
| + | |||
| + | |||
| + | == Neutron energy analysis == | ||
Errors on the neutron energy for the case of Det M: | Errors on the neutron energy for the case of Det M: | ||
| Line 33: | Line 44: | ||
<math>E_n \pm U(E_n)=m_nc^2/2 \cdot 1/c^2 \cdot (l_n/t_n)^2 \cdot [1 \pm 2 \sqrt{U^2(l_n)/l^2_n + U^2(t_n)/t^2_n}]</math> | <math>E_n \pm U(E_n)=m_nc^2/2 \cdot 1/c^2 \cdot (l_n/t_n)^2 \cdot [1 \pm 2 \sqrt{U^2(l_n)/l^2_n + U^2(t_n)/t^2_n}]</math> | ||
| − | Where uncertainty in the neutron flight pass due to the finite width of the detector ( | + | Where uncertainty in the neutron flight pass due to the finite width of the detector <math>U(l_n)</math> was simulated using GEANT4 and uncertainty in zero time definition in neutron TOF spectrum <math>U(t_n)</math> was defined from the experimental data as sigma of the zero time photon peak. |
| + | |||
| + | The neutron flight path length was calculated using the following expression: <math>l_n = \sqrt{l_c^2 + (X_c-X_i)^2}</math>, where <math>X_c=75/2=37.5cm</math> is the coordinate of the middle of the neutron detector active area and <math>X_i</math> is the current x-coordinate extracted from time difference spectrum. <math>l_c</math> is the distance from the middle of the target to the middle of the neutron detector surface. The current coordinate can be defined as <math>X_i = (((TDC_{left}-TDC_{right}) \cdot 0.223 ns/ch) \pm S) \cdot R</math>, where <math>S</math> is a shift factor due to the difference in delays for the two channels and should be taken to be the lowest value in <math>(TDC_{left}-TDC_{right}) \cdot 0.223</math> spectrum. The coefficient <math>R</math> is equal to active area dimension divided by the total width of <math>(TDC_{left}-TDC_{right}) \cdot 0.223</math> spectrum measured at base,i.e. <math>R = \frac{ 75(cm)}{abs(MAX[(TDC_{left}-TDC_{right})(ch) \cdot 0.223(ns/ch)]-MIN[(TDC_{left}-TDC_{right})(ch) \cdot 0.223(ns/ch)])} </math> or it can be measured by moving a radioactive source along the neutron detector surface. | ||
| + | |||
| + | |||
| + | |||
| + | However, there is a question on how to define the uncertainty on the coefficient <math>R</math>. Calibration <math>R_{calibr}</math> does not correspond to the measured one <math>R_{data}</math> (measured w/ Co-60 source). As an example for Det M we have (neutrons and photons combined together): | ||
| + | |||
| + | [[File:DetM_Calibr_data_mis.png]] | ||
| + | |||
| + | If we take into account only neutron region, we'll get | ||
| + | |||
| + | |||
| + | [[File:DetM_Calibr_data_mis_nCut.png]] | ||
| + | |||
| + | |||
| + | If we take into account only photon region, we'll get | ||
| − | |||
| − | [[File: | + | [[File:DetM_Calibr_data_mis_gCut.png]] |
| + | |||
| + | |||
| + | Neutron ToF to the surface of the detector can be calculated as <math>t_n = 0.5 \cdot ((TDC_{left}+TDC_{right})-ToF_{sint+lg})</math>, where <math>ToF_{sint+lg}</math> is the total light ToF inside the detector and it was taken to be a const <math>ToF_{sint+lg} = 100cm \cdot \frac{1}{2.5 cm/ns} \simeq 40 ns</math>. So, the neutron ToF can be calculated as <math>t_n = 0.5 \cdot ((TDC_{left}+TDC_{right})-40)</math> | ||
| + | |||
| + | == Neutron Phi distribution analysis == | ||
| + | |||
| + | Phi angle of the neutron hitting the surface of the detector can be found as | ||
| + | <math>tan(\phi)=\frac{(((TDC_{left}-TDC_{right})(ch) \cdot 0.223(ns/ch)) \pm S(ns)) \cdot R(cm/ns)}{l_c}= \frac{X_i}{l_c}</math> | ||
| + | |||
| + | The width of each channel is 0.223 ns and time walk of CF8000 is 0.25 ns. Hence the uncertainty on the x-coordinate can be calculated as <math>\delta X_i = \sqrt{(0.223(ns) \cdot R(cm/ns))^2 + (0.25(ns) \cdot R(cm/ns))^2}</math>. | ||
| + | |||
| + | For example, for the Det_M the coefficient <math>R=2.5 cm/ns</math> and <math>\delta X_i(Det_M) = \sqrt{(0.223(ns) \cdot 2.5(cm/ns))^2 + (0.25(ns) \cdot 2.5(cm/ns))^2}</math>. | ||
| − | + | Finally <math>\delta X_i(Det_M) = 0.84 cm</math>. | |
| − | |||
== Simulation of n-flight path. DetM. == | == Simulation of n-flight path. DetM. == | ||
| Line 59: | Line 96: | ||
As can be seen we have <math>U(l_n)</math> of ~ 3.3 cm for the whole detector (no binning). | As can be seen we have <math>U(l_n)</math> of ~ 3.3 cm for the whole detector (no binning). | ||
| + | |||
| + | If we apply the binning (total # of events sampled <math>4 \cdot 10^5</math>): | ||
| + | |||
| + | {| cellpadding="2" style="border: 1px solid darkgray;" | ||
| + | ! width="400" | Region 4 | ||
| + | ! width="400" | Region 3 | ||
| + | ! width="400" | Region 2 | ||
| + | ! width="400" | Region 1 | ||
| + | |- border="0" | ||
| + | | [[File:Region4_DetM.png|300px|Region 1]] | ||
| + | | [[File:Region3_DetM.png|300px|Region 2]] | ||
| + | | [[File:Region2_DetM.png|300px|Region 3]] | ||
| + | | [[File:Region1_DetM.png|300px|Region 4]] | ||
| + | |- align="center" | ||
| + | | x <= -18.97 cm|| 0 >= x >= -18.97 cm|| 0 <= x <= 18.97 cm || x >= 18.97 cm | ||
| + | |} | ||
== Experimental data Det M == | == Experimental data Det M == | ||
| − | The correlation of neutron energy <math>E_n = m_nc^2/2 \cdot 1/c^2 \cdot (l_n/t_n)^2</math> and its uncertainty <math>U(E_n)= 2 \sqrt{( | + | The correlation of neutron energy <math>E_n = m_nc^2/2 \cdot 1/c^2 \cdot (l_n/t_n)^2</math> and its uncertainty <math>U(E_n)= 2 \sqrt{(3cm)^2/l^2_n + (8.8ns)^2/t^2_n} \cdot 100\%</math> for the case neutron ToF cut [25,65] ns: |
[[File:DetM_neutron_energy.png | 600 px]] | [[File:DetM_neutron_energy.png | 600 px]] | ||
| + | |||
| + | Correlation plot of neutron energy vs neutron Phi angle (experimental data, cuts on time applied): | ||
| + | |||
| + | [[File:Det_M_PhiEn_corr.png | 600 px]] | ||
| + | |||
| + | |||
If we consider the neutron time of flight uncertainty <math>U(t_n) = 7 ns</math> and <math>U(l_n) = 3.3 cm</math> then the correlation plot changes to | If we consider the neutron time of flight uncertainty <math>U(t_n) = 7 ns</math> and <math>U(l_n) = 3.3 cm</math> then the correlation plot changes to | ||
| Line 76: | Line 135: | ||
It can be concluded that the neutron energy uncertainty is really sensitive to the neutron ToF uncertainty. In our case we had a long tail in photon peak which could possibly distort the zero time definition and the precision of neutron energy calculation. | It can be concluded that the neutron energy uncertainty is really sensitive to the neutron ToF uncertainty. In our case we had a long tail in photon peak which could possibly distort the zero time definition and the precision of neutron energy calculation. | ||
| − | == Data | + | == Data analysis for DetH == |
===Simulation of n-flight path. DetH.=== | ===Simulation of n-flight path. DetH.=== | ||
| Line 129: | Line 188: | ||
According to my observation the uncertainty in the neutron flight path does not influence the uncertainty in neutron energy too much. Main contribution is from the zero-time definition in ToF spectrum. | According to my observation the uncertainty in the neutron flight path does not influence the uncertainty in neutron energy too much. Main contribution is from the zero-time definition in ToF spectrum. | ||
| − | == Data | + | Correlation plot of neutron energy vs neutron Phi angle (experimental data, cuts on time applied): |
| + | |||
| + | [[File:Det_H_PhiEn_corr.png | 600 px]] | ||
| + | |||
| + | == Data analysis for Det_E == | ||
| + | |||
| + | Simulated neutron flight path for detector F w/o binning and <math>2 \cdot 10^5</math> events simulated: | ||
| + | |||
| + | [[File:Det_E_sim_flightpath_nobinning.png | 400 px]] | ||
| + | |||
| + | The uncertainty in neutron flight path is RMS = 2.36 cm. | ||
| + | |||
| + | |||
| + | Phi-angular distribution of hits (experimental data, no cuts on time): | ||
| + | |||
| + | [[File:Det_E_angl_distr.png | 400 px]] | ||
| + | |||
| + | Correlation plot of neutron energy vs neutron Phi angle (experimental data, cuts on time applied): | ||
| + | |||
| + | [[File:Det_E_PhiEn_corr.png | 600 px]] | ||
| + | |||
| + | |||
| + | If we apply the binning: | ||
| + | |||
| + | {| cellpadding="2" style="border: 1px solid darkgray;" | ||
| + | ! width="400" | Region 4 | ||
| + | ! width="400" | Region 3 | ||
| + | ! width="400" | Region 2 | ||
| + | ! width="400" | Region 1 | ||
| + | |- border="0" | ||
| + | | [[File:Region4_DetE.png|300px|Region 1]] | ||
| + | | [[File:Region3_DetE.png|300px|Region 2]] | ||
| + | | [[File:Region2_DetE.png|300px|Region 3]] | ||
| + | | [[File:Region1_DetE.png|300px|Region 4]] | ||
| + | |- align="center" | ||
| + | | x <= -18.97 cm|| 0 >= x >= -18.97 cm|| 0 <= x <= 18.97 cm || x >= 18.97 cm | ||
| + | |} | ||
| + | |||
[[File:Det_E_data_nobinning.png | 600 px]] | [[File:Det_E_data_nobinning.png | 600 px]] | ||
| − | == Data | + | == Data analysis for Det_F == |
Simulated neutron flight path for detector F w/o binning and <math>2 \cdot 10^5</math> events simulated: | Simulated neutron flight path for detector F w/o binning and <math>2 \cdot 10^5</math> events simulated: | ||
| Line 161: | Line 257: | ||
[[File:Det_F_data_nobinning.png | 600 px]] | [[File:Det_F_data_nobinning.png | 600 px]] | ||
| + | |||
| + | Correlation plot of neutron energy vs neutron Phi angle (experimental data, cuts on time applied): | ||
| + | |||
| + | [[File:Det_F_PhiEn_corr.png | 600 px]] | ||
| + | |||
| + | == Data analysis for Det_G == | ||
| + | |||
| + | Simulated neutron flight path for detector F w/o binning and <math>2 \cdot 10^5</math> events simulated: | ||
| + | |||
| + | [[File:Det_G_sim_flightpath_nobinning.png | 600 px]] | ||
| + | |||
| + | The uncertainty in neutron flight path is RMS = 3.24 cm. | ||
| + | |||
| + | |||
| + | If we apply the binning: | ||
| + | |||
| + | {| cellpadding="2" style="border: 1px solid darkgray;" | ||
| + | ! width="400" | Region 4 | ||
| + | ! width="400" | Region 3 | ||
| + | ! width="400" | Region 2 | ||
| + | ! width="400" | Region 1 | ||
| + | |- border="0" | ||
| + | | [[File:Region4_DetG.png|300px|Region 1]] | ||
| + | | [[File:Region3_DetG.png|300px|Region 2]] | ||
| + | | [[File:Region2_DetG.png|300px|Region 3]] | ||
| + | | [[File:Region1_DetG.png|300px|Region 4]] | ||
| + | |- align="center" | ||
| + | | x <= -18.97 cm|| 0 >= x >= -18.97 cm|| 0 <= x <= 18.97 cm || x >= 18.97 cm | ||
| + | |} | ||
| + | |||
| + | |||
| + | [[File:Det_G_data_nobinning.png | 600 px]] | ||
| + | |||
| + | Correlation plot of neutron energy vs neutron Phi angle (experimental data, cuts on time applied): | ||
| + | |||
| + | [[File:Det_G_PhiEn_corr.png | 600 px]] | ||
| + | |||
| + | == Data analysis for Det_K == | ||
| + | |||
| + | [[File:Det_K_data_non.png | 600 px]] | ||
| + | |||
| + | == Data analysis for Det_I == | ||
| + | |||
| + | Simulated neutron flight path for detector F w/o binning and <math>4 \cdot 10^5</math> events simulated: | ||
| + | |||
| + | [[File:Det_I_sim_flightpath_nobinning.png | 600 px]] | ||
| + | |||
| + | The uncertainty in neutron flight path is RMS = 4.27 cm. | ||
| + | |||
| + | |||
| + | If we apply the binning: | ||
| + | |||
| + | {| cellpadding="2" style="border: 1px solid darkgray;" | ||
| + | ! width="400" | Region 4 | ||
| + | ! width="400" | Region 3 | ||
| + | ! width="400" | Region 2 | ||
| + | ! width="400" | Region 1 | ||
| + | |- border="0" | ||
| + | | [[File:Region4_DetI.png|300px|Region 1]] | ||
| + | | [[File:Region3_DetI.png|300px|Region 2]] | ||
| + | | [[File:Region2_DetI.png|300px|Region 3]] | ||
| + | | [[File:Region1_DetI.png|300px|Region 4]] | ||
| + | |- align="center" | ||
| + | | x <= -18.97 cm|| 0 >= x >= -18.97 cm|| 0 <= x <= 18.97 cm || x >= 18.97 cm | ||
| + | |} | ||
| + | |||
| + | [[File:Det_I_data_nobinning.png | 600 px]] | ||
| + | |||
| + | The uncertainty on the zero time is <math>U(t_n) \simeq 24 ns</math>. Squared value <math>U(t_n)^2 = 576 ns</math> which is comparable to <math>t_n^2</math> and the uncertainty is big while the neutron flight path uncertainty for the whole detector is ~ 3 cm and its squared value is much less than the squared value of the distance traveled by neutrons, e.g. <math>3^2/253^2 = 9/64009 \simeq 1.4 \cdot 10^{-4}</math> | ||
| + | |||
| + | Correlation plot of neutron energy vs neutron Phi angle (experimental data, cuts on time applied): | ||
| + | |||
| + | [[File:Det_I_PhiEn_corr.png | 600 px]] | ||
Latest revision as of 15:35, 4 October 2012
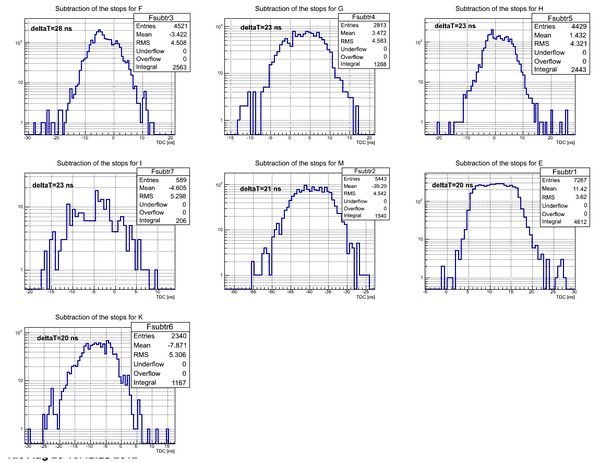
Subtraction of stops for D2O
Subtraction of the stops for each detector in the case of D2O target. The length of the active area (scintillator) of the detector is 75.3 cm.
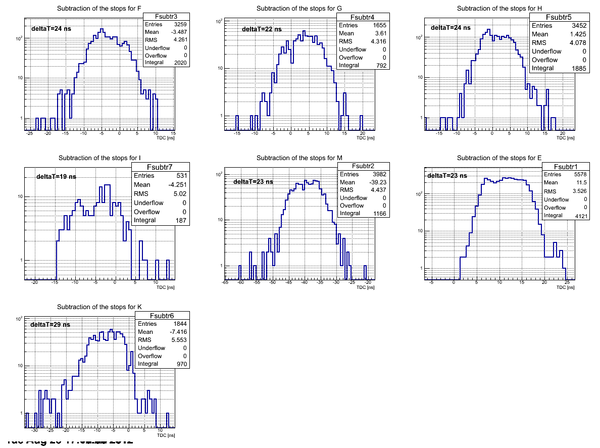
Subtraction of stops for H2O
Subtraction of the stops for each detector in the case of H2O target:
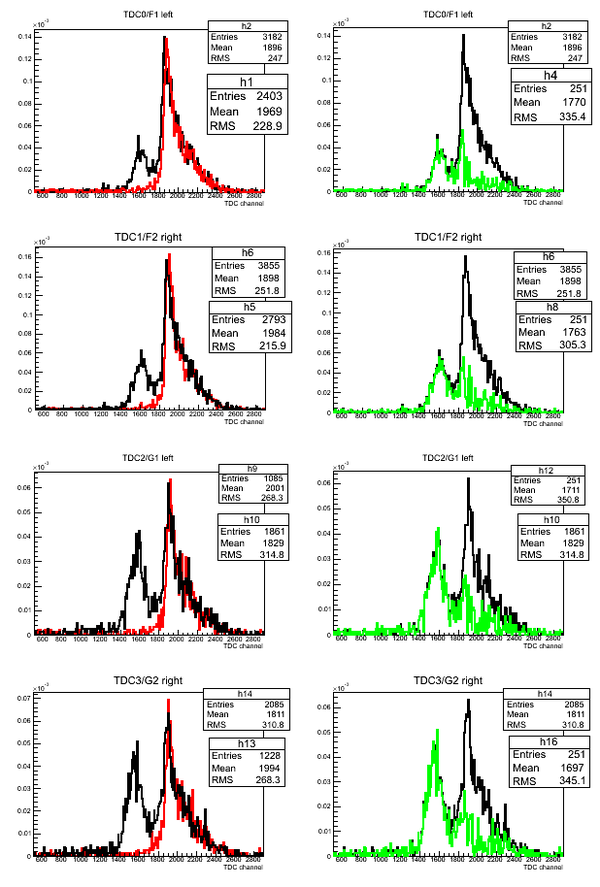
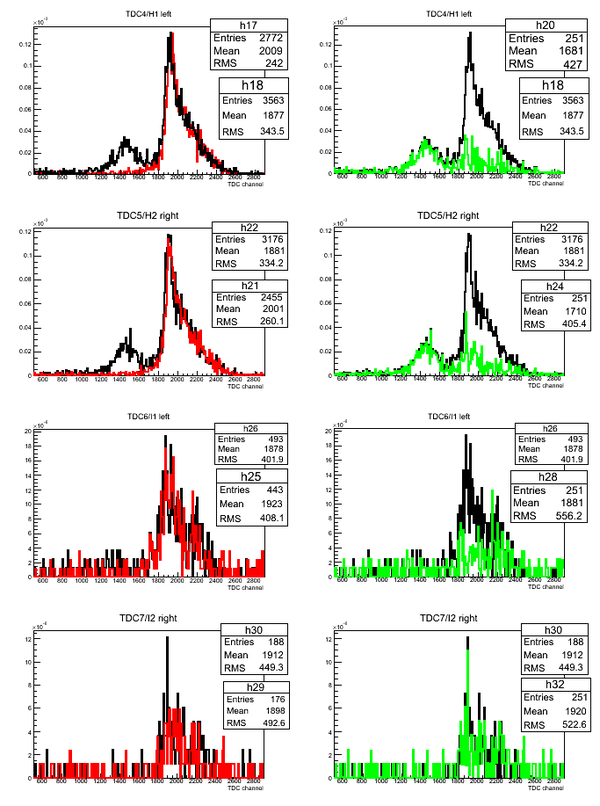
Subtraction of D2O and H2O ToF
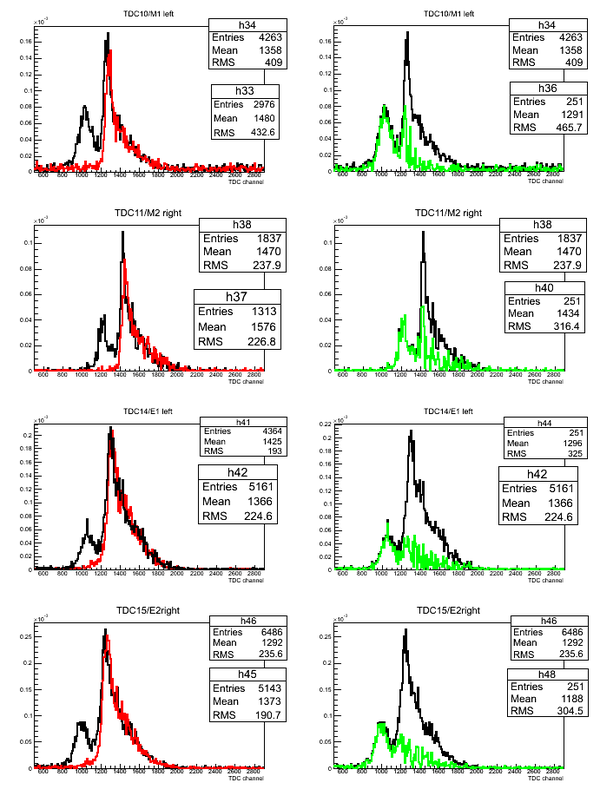
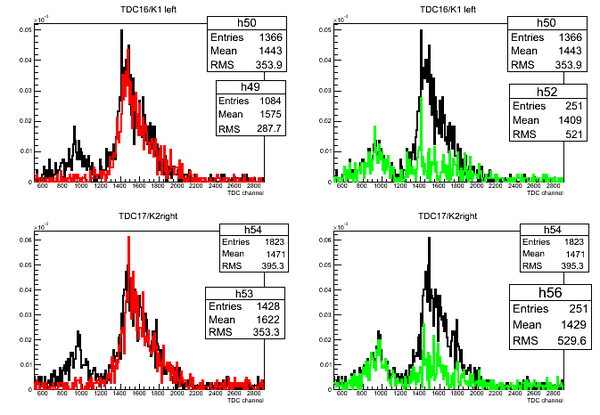
Normalized superimposed timing spectra from D2O(black line)/H2O(red line) targets and bin-by-bin subtraction (green line) of D2O-H2O data:
Preliminary data analysis
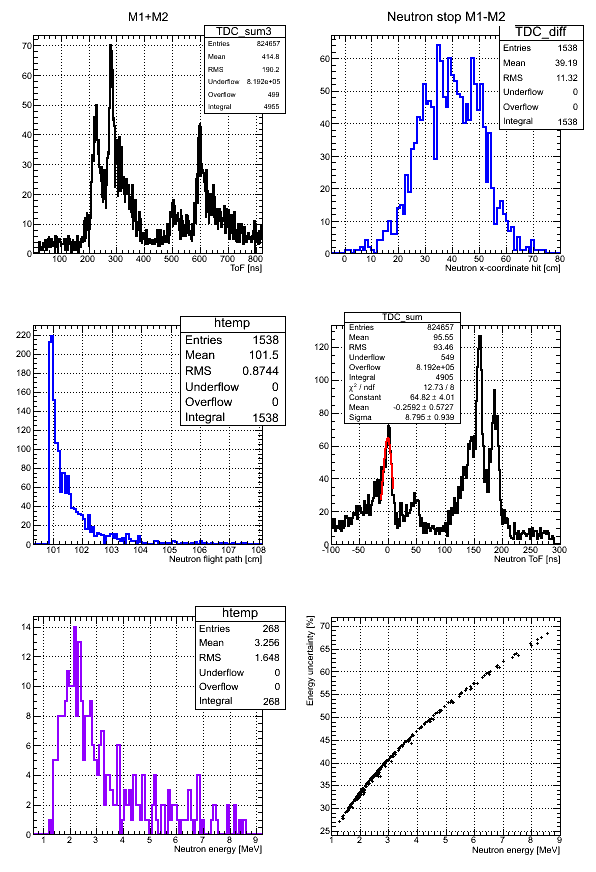
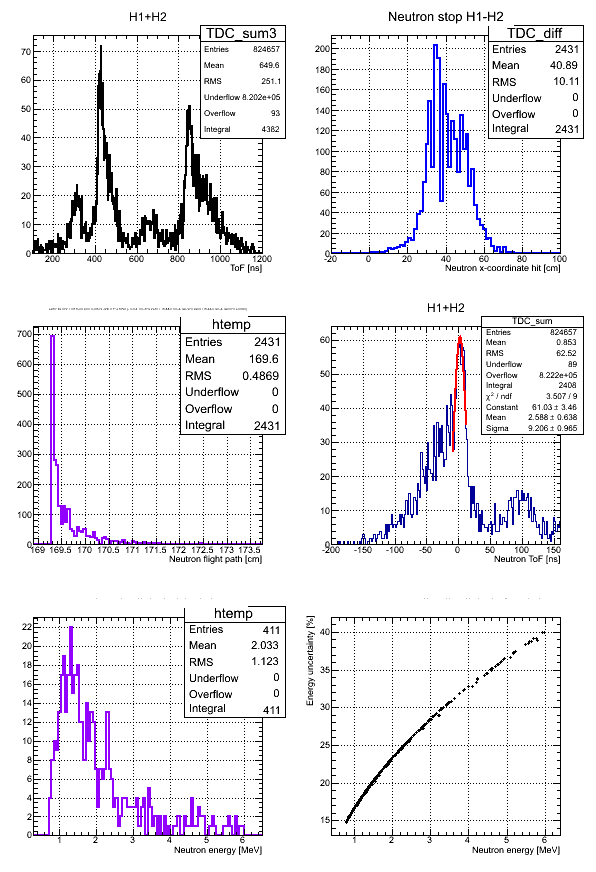
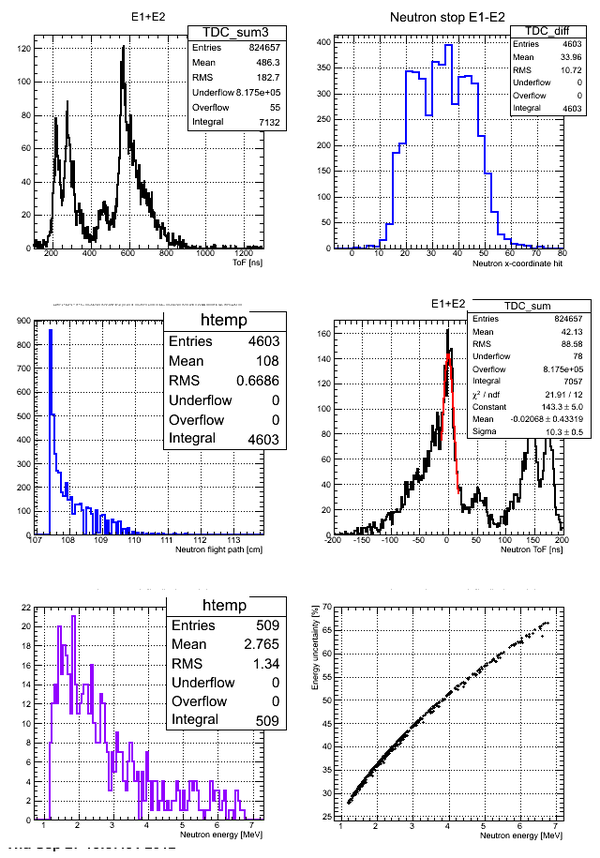
Neutron energy distribution data analysis for run 4111:
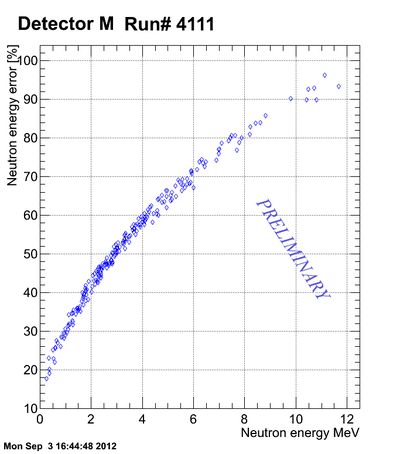
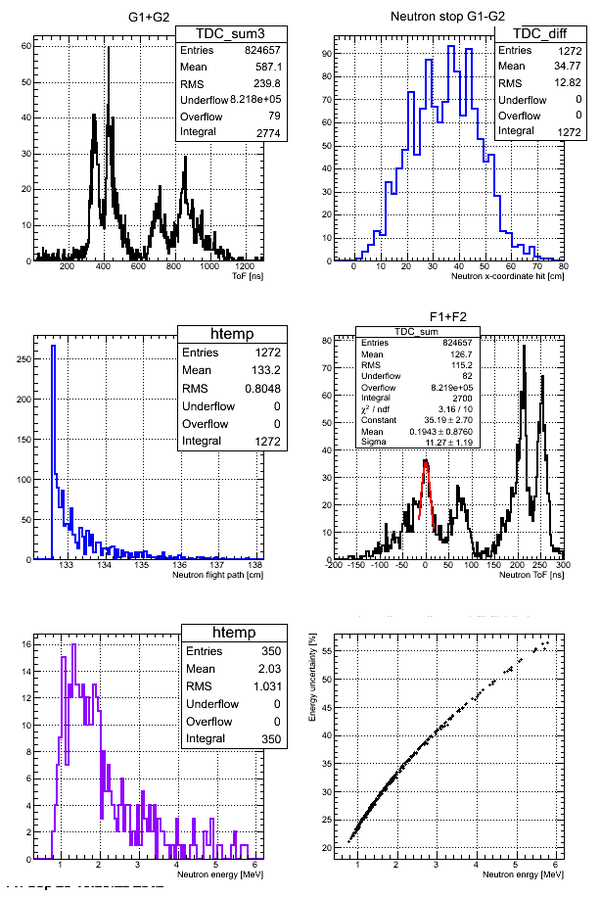
Correlation between the neutron energy and neutron energy uncertainty is plotted below:
The above plot may look better if you plot -vs- () As the energy increased the uncertainty increases to the point the the error bar is as big as the magnitude of the energy.
Neutron energy analysis
Errors on the neutron energy for the case of Det M:
Where uncertainty in the neutron flight pass due to the finite width of the detector was simulated using GEANT4 and uncertainty in zero time definition in neutron TOF spectrum was defined from the experimental data as sigma of the zero time photon peak.
The neutron flight path length was calculated using the following expression: , where is the coordinate of the middle of the neutron detector active area and is the current x-coordinate extracted from time difference spectrum. is the distance from the middle of the target to the middle of the neutron detector surface. The current coordinate can be defined as , where is a shift factor due to the difference in delays for the two channels and should be taken to be the lowest value in spectrum. The coefficient is equal to active area dimension divided by the total width of spectrum measured at base,i.e. or it can be measured by moving a radioactive source along the neutron detector surface.
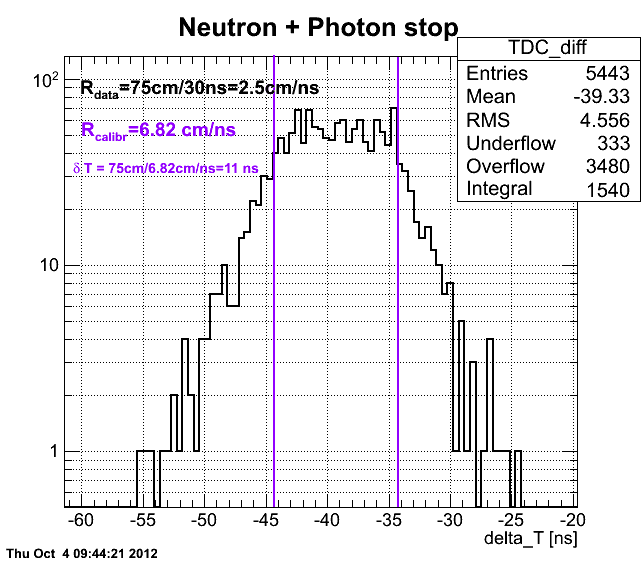
However, there is a question on how to define the uncertainty on the coefficient . Calibration does not correspond to the measured one (measured w/ Co-60 source). As an example for Det M we have (neutrons and photons combined together):
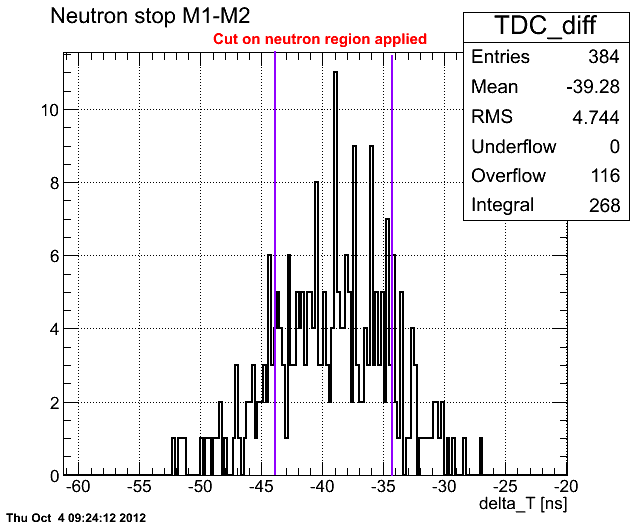
If we take into account only neutron region, we'll get
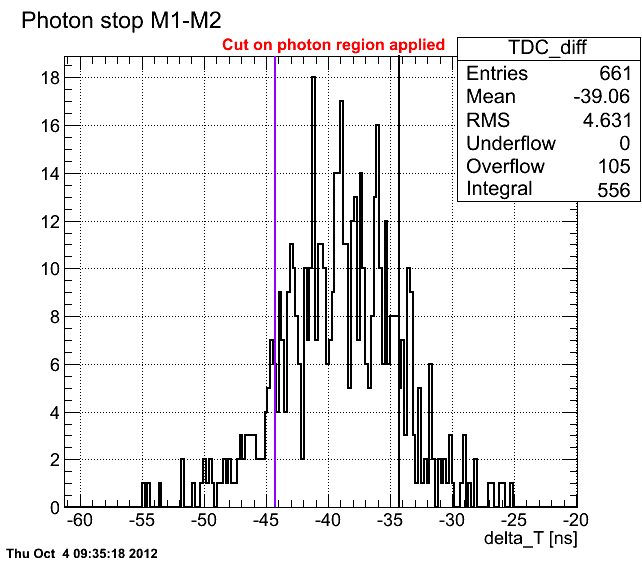
If we take into account only photon region, we'll get
Neutron ToF to the surface of the detector can be calculated as , where is the total light ToF inside the detector and it was taken to be a const . So, the neutron ToF can be calculated as
Neutron Phi distribution analysis
Phi angle of the neutron hitting the surface of the detector can be found as
The width of each channel is 0.223 ns and time walk of CF8000 is 0.25 ns. Hence the uncertainty on the x-coordinate can be calculated as .
For example, for the Det_M the coefficient and .
Finally .
Simulation of n-flight path. DetM.
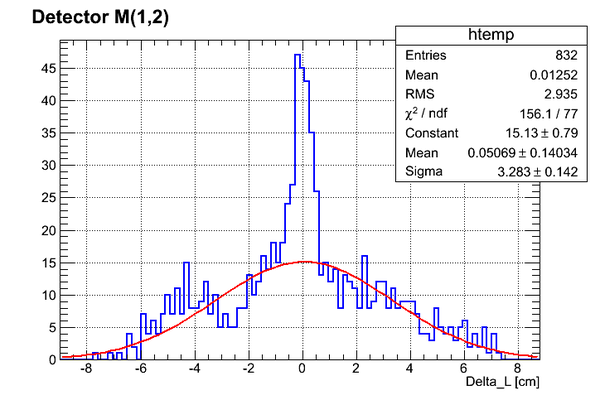
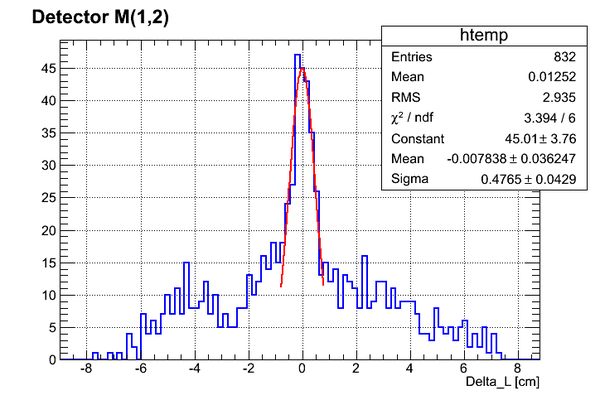
Simulation of the flight path length uncertainty for Det M(1,2) placed right below the target:
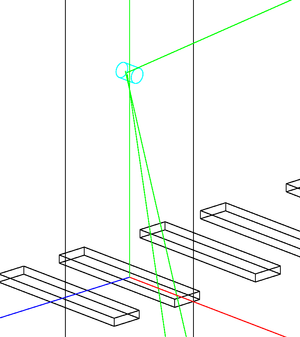
Cylindrical target with dimensions of real target was used. It was filled with liquid D2. 1 MeV neutrons were generated inside the target uniformly and isotropically. The shortest distance from the target to the detector surface was 97.4 cm (corresponds to zero in the plot of the Delta_L)
The whole range fit:
Central region fit:
As can be seen we have of ~ 3.3 cm for the whole detector (no binning).
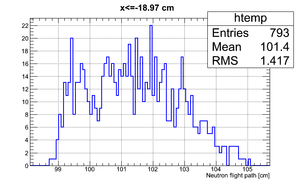
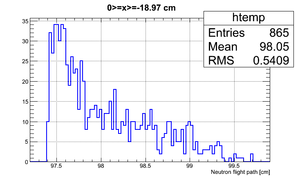
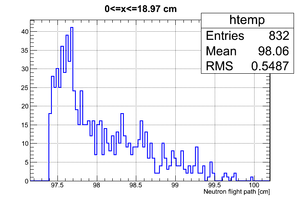
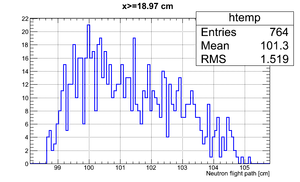
If we apply the binning (total # of events sampled ):
| Region 4 | Region 3 | Region 2 | Region 1 |
|---|---|---|---|
|
|
|
|
| x <= -18.97 cm | 0 >= x >= -18.97 cm | 0 <= x <= 18.97 cm | x >= 18.97 cm |
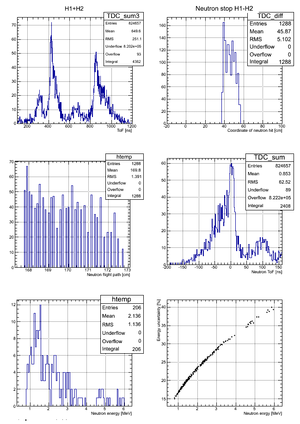
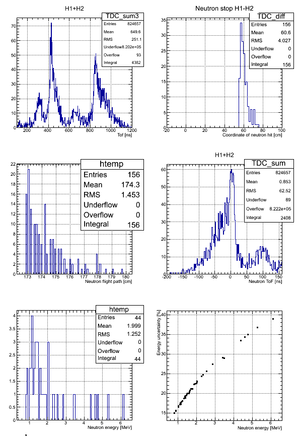
Experimental data Det M
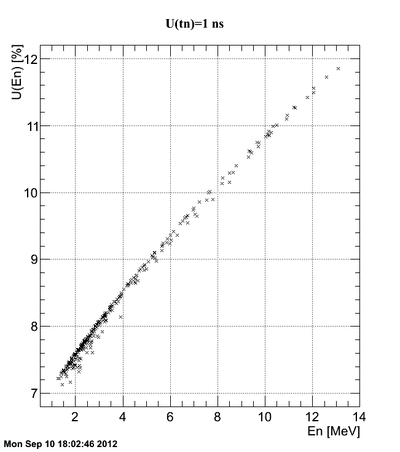
The correlation of neutron energy and its uncertainty for the case neutron ToF cut [25,65] ns:
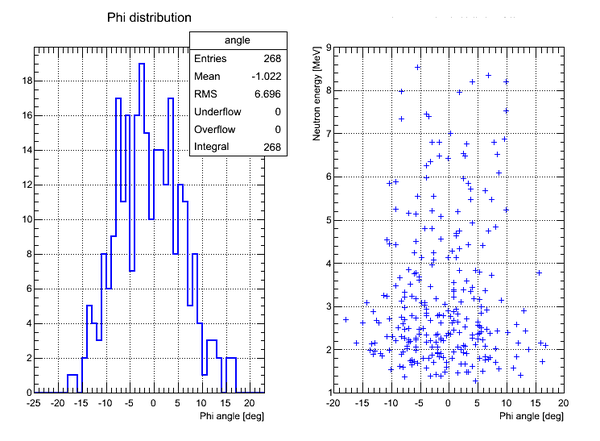
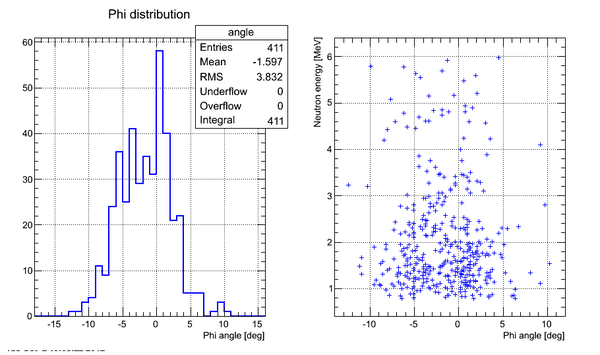
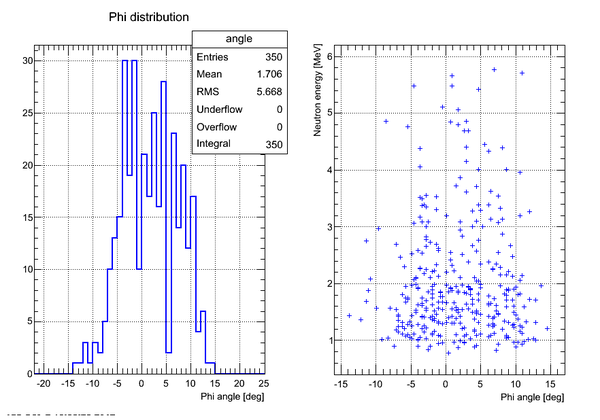
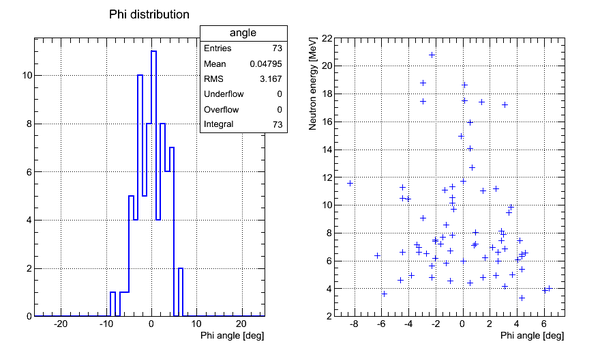
Correlation plot of neutron energy vs neutron Phi angle (experimental data, cuts on time applied):
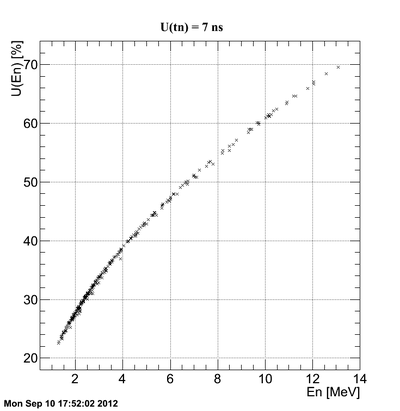
If we consider the neutron time of flight uncertainty and then the correlation plot changes to
If we consider the neutron time of flight uncertainty and then the correlation plot changes to
It can be concluded that the neutron energy uncertainty is really sensitive to the neutron ToF uncertainty. In our case we had a long tail in photon peak which could possibly distort the zero time definition and the precision of neutron energy calculation.
Data analysis for DetH
Simulation of n-flight path. DetH.
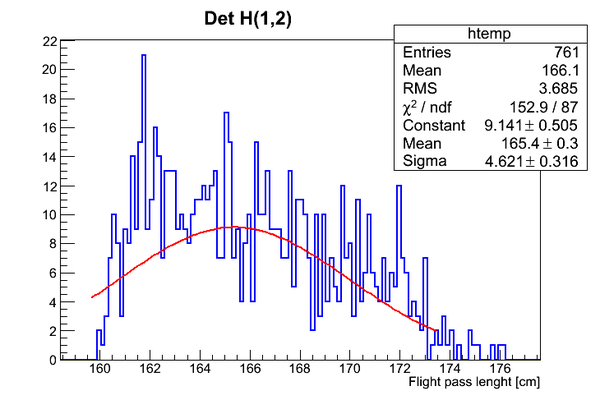
Simulated neutron flight pass lenrgth distribution is presented below:
The width of the distribution is about 10 cm wide.
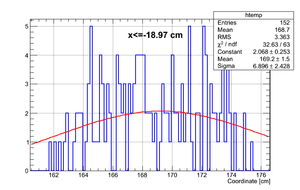
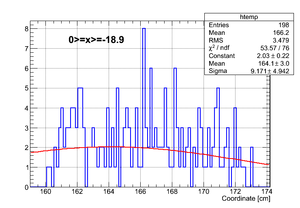
The active area of the detector is ~ 75 cm. If we bin the detector in four, we will get for generated events
| Region 4 | Region 3 | Region 2 | Region 1 |
|---|---|---|---|
|
|
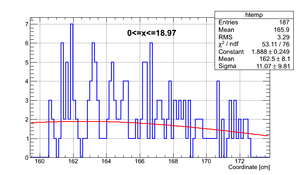
|
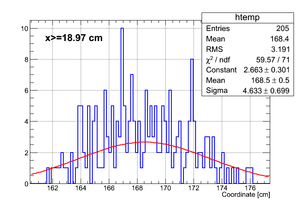
|
| x <= -18.97 cm | 0 >= x >= -18.97 cm | 0 <= x <= 18.97 cm | x >= 18.97 cm |
So it can be seen that the neutron flight path uncertainty, if taken to be the RMS in a flight path spectrum, is .
Experimental data
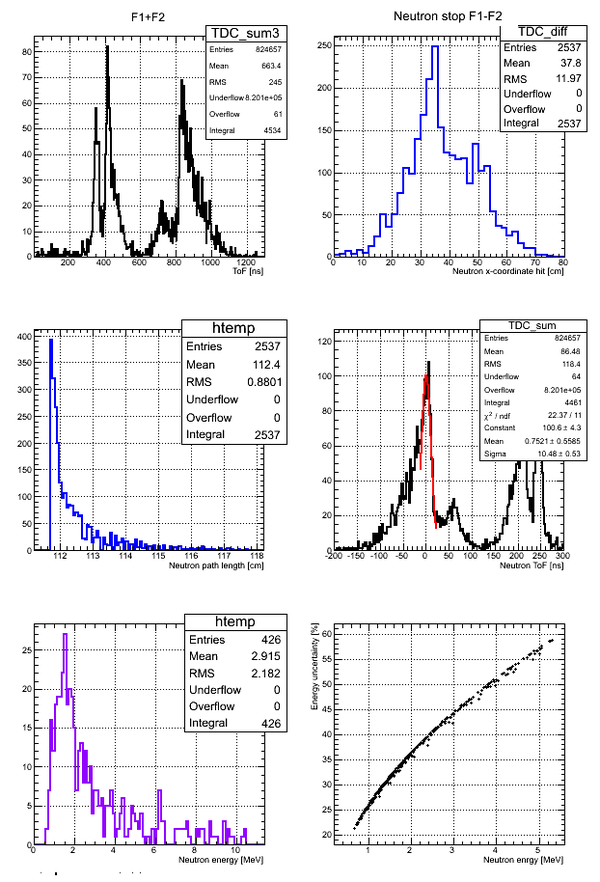
Data with no binning:
After binning the detector and taking for the neutron flight path uncertainty we got:
| Region 4 | Region 3 | Region 2 | Region 1 |
|---|---|---|---|
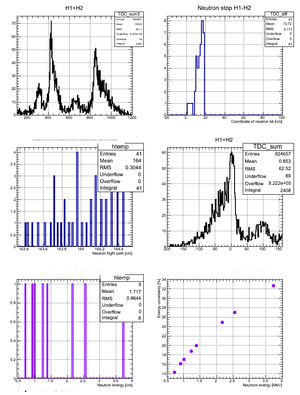
|
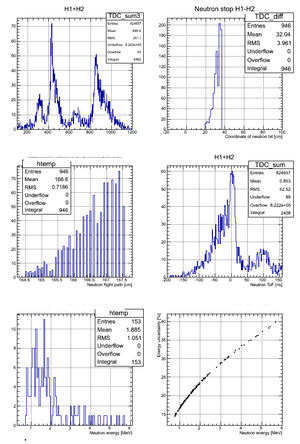
|
|
|
| x <= -18.97 cm | 0 >= x >= -18.97 cm | 0 <= x <= 18.97 cm | x >= 18.97 cm |
According to my observation the uncertainty in the neutron flight path does not influence the uncertainty in neutron energy too much. Main contribution is from the zero-time definition in ToF spectrum.
Correlation plot of neutron energy vs neutron Phi angle (experimental data, cuts on time applied):
Data analysis for Det_E
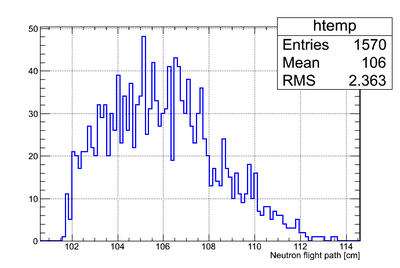
Simulated neutron flight path for detector F w/o binning and events simulated:
The uncertainty in neutron flight path is RMS = 2.36 cm.
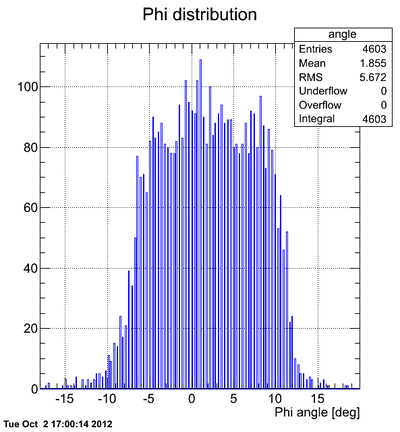
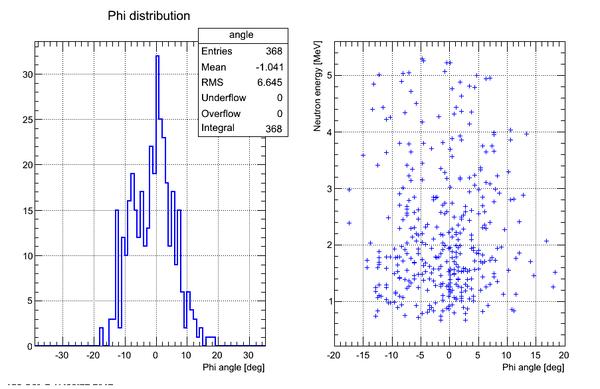
Phi-angular distribution of hits (experimental data, no cuts on time):
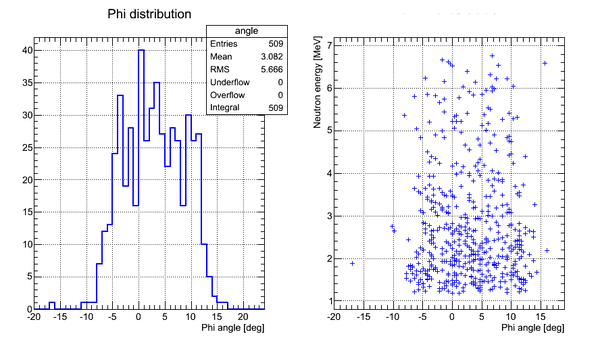
Correlation plot of neutron energy vs neutron Phi angle (experimental data, cuts on time applied):
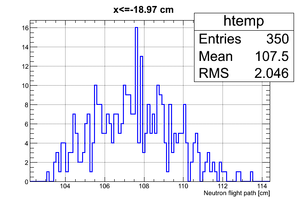
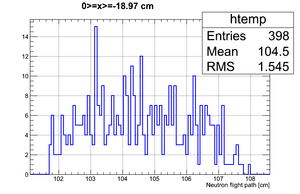
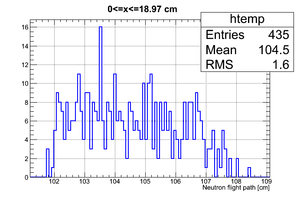
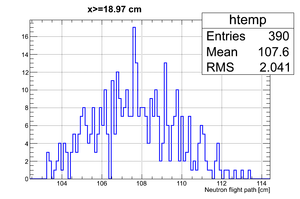
If we apply the binning:
| Region 4 | Region 3 | Region 2 | Region 1 |
|---|---|---|---|
|
|
|
|
| x <= -18.97 cm | 0 >= x >= -18.97 cm | 0 <= x <= 18.97 cm | x >= 18.97 cm |
Data analysis for Det_F
Simulated neutron flight path for detector F w/o binning and events simulated:
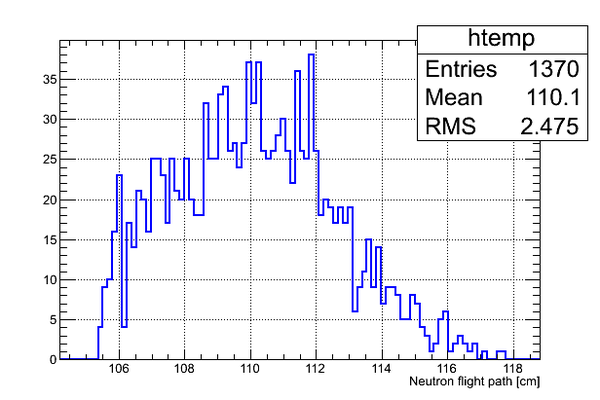
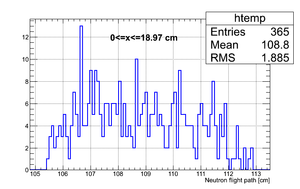
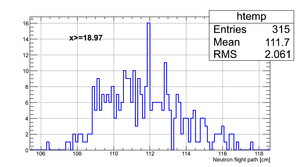
The uncertainty in neutron flight path is RMS = 2.5 cm.
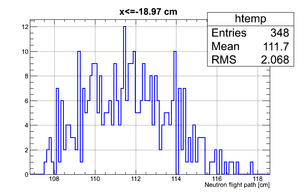
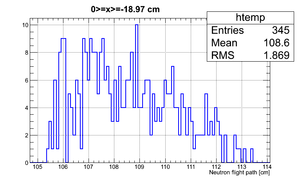
If we apply the binning:
| Region 4 | Region 3 | Region 2 | Region 1 |
|---|---|---|---|
|
|
|
|
| x <= -18.97 cm | 0 >= x >= -18.97 cm | 0 <= x <= 18.97 cm | x >= 18.97 cm |
Experimental data
Correlation plot of neutron energy vs neutron Phi angle (experimental data, cuts on time applied):
Data analysis for Det_G
Simulated neutron flight path for detector F w/o binning and events simulated:
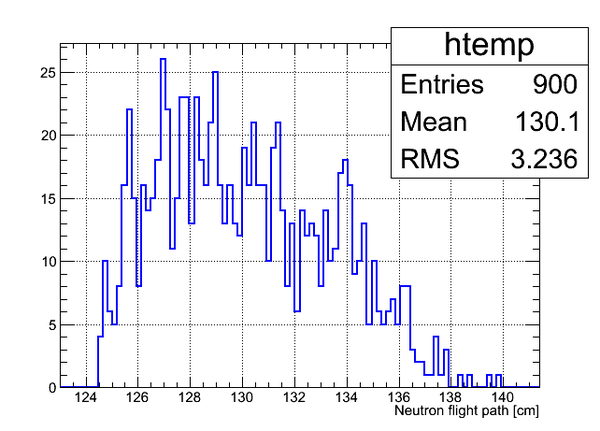
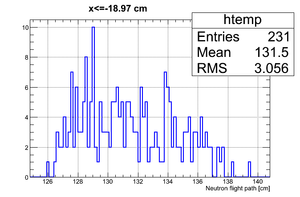
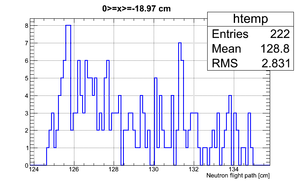
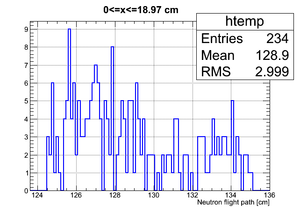
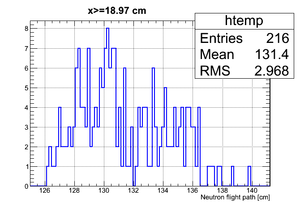
The uncertainty in neutron flight path is RMS = 3.24 cm.
If we apply the binning:
| Region 4 | Region 3 | Region 2 | Region 1 |
|---|---|---|---|
|
|
|
|
| x <= -18.97 cm | 0 >= x >= -18.97 cm | 0 <= x <= 18.97 cm | x >= 18.97 cm |
Correlation plot of neutron energy vs neutron Phi angle (experimental data, cuts on time applied):
Data analysis for Det_K
Data analysis for Det_I
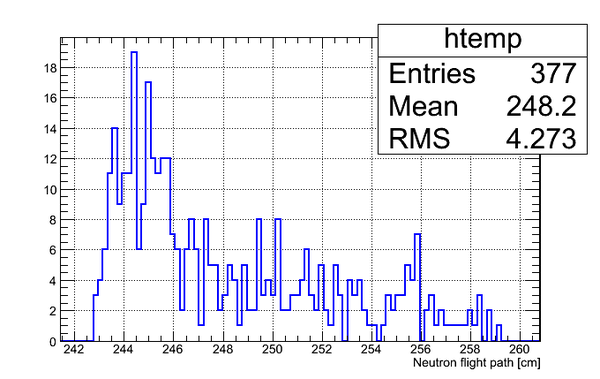
Simulated neutron flight path for detector F w/o binning and events simulated:
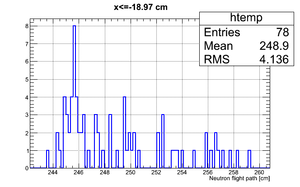
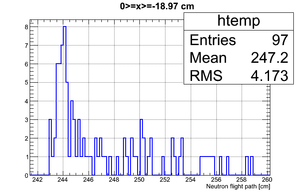
The uncertainty in neutron flight path is RMS = 4.27 cm.
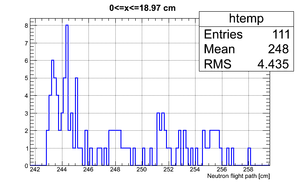
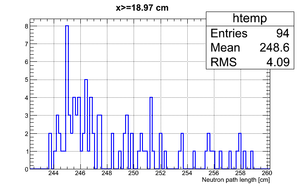
If we apply the binning:
| Region 4 | Region 3 | Region 2 | Region 1 |
|---|---|---|---|
|
|
|
|
| x <= -18.97 cm | 0 >= x >= -18.97 cm | 0 <= x <= 18.97 cm | x >= 18.97 cm |
The uncertainty on the zero time is . Squared value which is comparable to and the uncertainty is big while the neutron flight path uncertainty for the whole detector is ~ 3 cm and its squared value is much less than the squared value of the distance traveled by neutrons, e.g.
Correlation plot of neutron energy vs neutron Phi angle (experimental data, cuts on time applied):
