Difference between revisions of "2n Neutron signal attenuation"
| (6 intermediate revisions by the same user not shown) | |||
| Line 52: | Line 52: | ||
[[File:Det_I_pic.jpg | 300 px]] | [[File:Det_I_pic.jpg | 300 px]] | ||
| − | =Na-22 source timing test= | + | =Na-22 and Co-60 source timing test= |
Here it was used Det K. DAQ was triggered on the coincidence signal from two PMTs and each PMT signal was delayed and connected to corresponding TDC channel. DAQ was configured to work in the common start mode. Na-22 source was moved over the detector surface. | Here it was used Det K. DAQ was triggered on the coincidence signal from two PMTs and each PMT signal was delayed and connected to corresponding TDC channel. DAQ was configured to work in the common start mode. Na-22 source was moved over the detector surface. | ||
| Line 97: | Line 97: | ||
[[Normalized and BKG subtracted data for Det E]] | [[Normalized and BKG subtracted data for Det E]] | ||
| + | |||
| + | ==Slope data== | ||
| + | |||
| + | [[File:Slope_data.png]] | ||
| + | |||
| + | |||
| + | All the calibrations were obtained for the case when detectors had the following HV applied: | ||
| + | |||
| + | {| class="wikitable" | ||
| + | |- | ||
| + | ! Detector !! CFD threshold [mV] !! HV [V] | ||
| + | |- | ||
| + | | F(1,2) || 0 || -1702 | ||
| + | |- | ||
| + | | I(1) || 0 || -1654 | ||
| + | |- | ||
| + | | I(2) || 0 || -1700 | ||
| + | |- | ||
| + | | G(1) || 0 || -1700 | ||
| + | |- | ||
| + | | G(2) || 0 || -1650 | ||
| + | |- | ||
| + | | H(1) || 0 || -1730 | ||
| + | |- | ||
| + | | H(2) || 0 || -1650 | ||
| + | |- | ||
| + | | E(1) || 0 || -1650 | ||
| + | |- | ||
| + | | E(2) || 0 || -1750 | ||
| + | |- | ||
| + | | M(1) || 0 || -1602 | ||
| + | |- | ||
| + | | M(2) || 0 || -1750 | ||
| + | |- | ||
| + | | K(1) || 0 || -1755 | ||
| + | |- | ||
| + | | K(2) || 0 || -1600 (8(60)) | ||
| + | |} | ||
Latest revision as of 16:59, 20 November 2012
Cf-252 source attenuation test
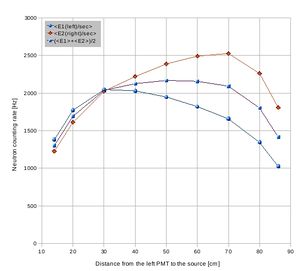
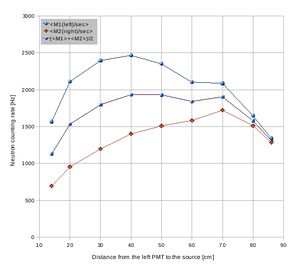
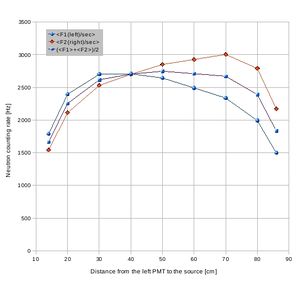
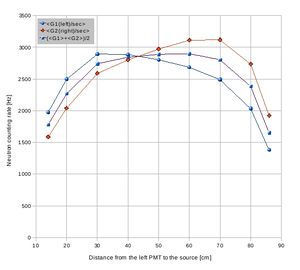
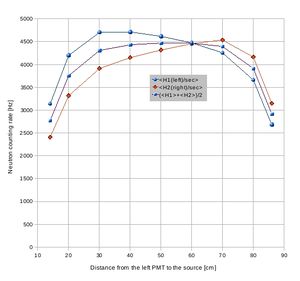
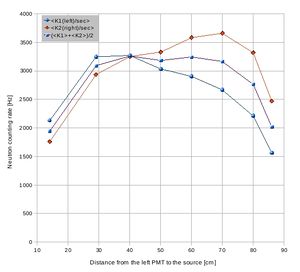
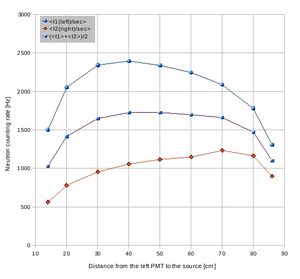
Cf-252 source was used to define the attenuation of a signal produced by neutrons in plastic scintillator. Cf-252 source was placed in different positions along the detector surface shielded with 2" of lead and counting rate of the two PMTs was observed via dual counter ORTEC 778. Cf-252 source was surrounded by borated poly to provide collimation of about 5 cm in diameter.
Would you add to the plot the sum of the rate from each end of the PMT.
In order to get it on the same scale you could divide by 2 or use a scale on the right side of the graph
Data with the counting rate from each tube added together.
Detector E(1,2) neutron signal attenuation data sheet:
Detector M(1,2) neutron signal attenuation data sheet:
Detector F(1,2) neutron signal attenuation data sheet:
Detector G(1,2) neutron signal attenuation data sheet:
Detector H(1,2) neutron signal attenuation data sheet:
Detector K(1,2) neutron signal attenuation data sheet:
Detector I(1,2) neutron signal attenuation data sheet:
Na-22 and Co-60 source timing test
Here it was used Det K. DAQ was triggered on the coincidence signal from two PMTs and each PMT signal was delayed and connected to corresponding TDC channel. DAQ was configured to work in the common start mode. Na-22 source was moved over the detector surface.
Raw spectra
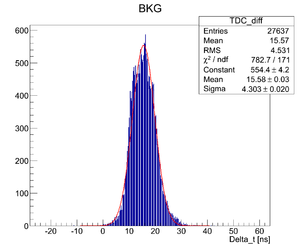
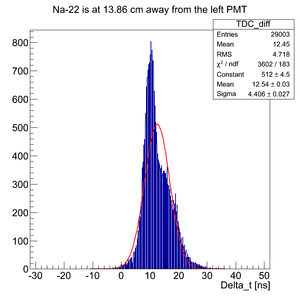
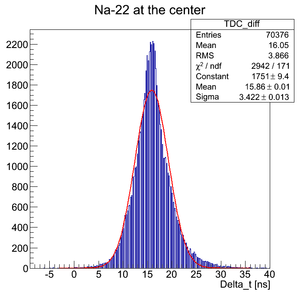
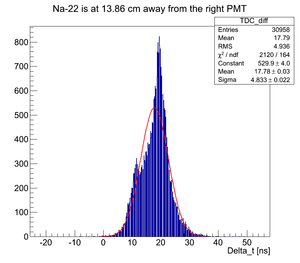
The difference of TOF TDC16-TDC17 (i.e. K1(left)-K2(right)) is plotted below for different source position.
As can be seen the BKG spectrum is not centered around zero time. That means that delays in the channels are different.
Det K data
Normalized and BKG subtracted data
Det I data
Normalized and BKG subtracted data for Det I
Det H data
Normalized and BKG subtracted data for Det H
Det G data
Normalized and BKG subtracted data for Det G
Det F data
Normalized and BKG subtracted data for Det F
Det M data
Normalized and BKG subtracted data for Det M
Det E data
Normalized and BKG subtracted data for Det E
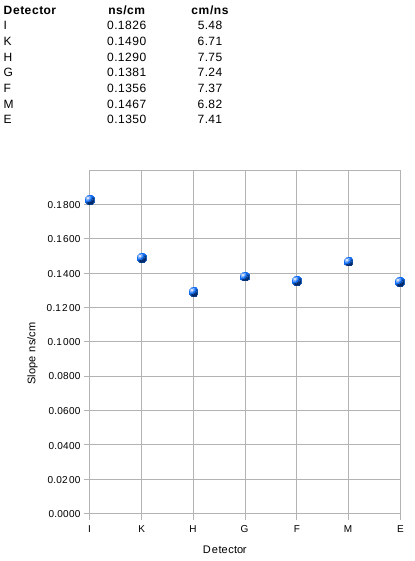
Slope data
All the calibrations were obtained for the case when detectors had the following HV applied:
| Detector | CFD threshold [mV] | HV [V] |
|---|---|---|
| F(1,2) | 0 | -1702 |
| I(1) | 0 | -1654 |
| I(2) | 0 | -1700 |
| G(1) | 0 | -1700 |
| G(2) | 0 | -1650 |
| H(1) | 0 | -1730 |
| H(2) | 0 | -1650 |
| E(1) | 0 | -1650 |
| E(2) | 0 | -1750 |
| M(1) | 0 | -1602 |
| M(2) | 0 | -1750 |
| K(1) | 0 | -1755 |
| K(2) | 0 | -1600 (8(60)) |
