Difference between revisions of "2-Neutron Correlation"
(→8/21) |
|||
| (67 intermediate revisions by the same user not shown) | |||
| Line 1: | Line 1: | ||
| + | =Pre-setup Calculations= | ||
== Big Detector Solid Angle Calculations == | == Big Detector Solid Angle Calculations == | ||
| − | + | [https://wiki.iac.isu.edu/index.php/Neutron_Corr Neutron Corr Home Page] | |
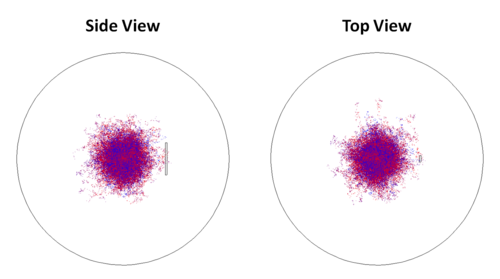
; MCNPX Simulation <br /> | ; MCNPX Simulation <br /> | ||
* 14 MeV neutron source, emitted isotropically (<math>4\pi</math>)<br /> | * 14 MeV neutron source, emitted isotropically (<math>4\pi</math>)<br /> | ||
* Detector placed 1m away from source<br /> | * Detector placed 1m away from source<br /> | ||
| − | + | [[File:mcnpxsetup.png | 500px]] | |
| + | |||
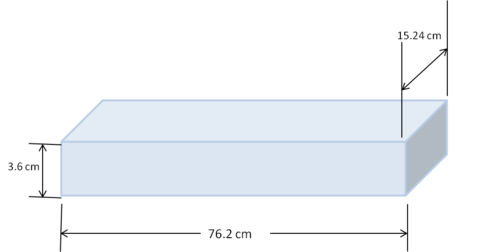
| + | * face of the detector is 15.24cm x 76.2cm, and 3.6cm deep<br /> | ||
| + | [[File:DetectorDimensions.png | 500px]] | ||
| + | |||
The solid angle can be found from the number of particles hitting the detector as:<br /> | The solid angle can be found from the number of particles hitting the detector as:<br /> | ||
<math>\Delta \Omega = 4\pi*\frac{hits}{hits + misses}</math> | <math>\Delta \Omega = 4\pi*\frac{hits}{hits + misses}</math> | ||
| − | ; Results | + | ; Results |
| − | * | + | * Out of 1E9 neutrons generated, 8618287 neutrons hit the detector |
| − | * <math>\Delta \Omega = 0. | + | ** <math>\Delta \Omega = 0.108 Sr</math> |
| + | *** if the detector is placed 70cm away from the source, <math>\Delta \Omega = 0.207 Sr</math> | ||
| + | *** if the detector is placed 65cm away from the source, <math>\Delta \Omega = 0.236 Sr</math> | ||
| + | |||
| + | * As a test to verify our results | ||
| + | ** We change the detector size to 2cm by 2cm and used 1E9 neutrons again | ||
| + | ** 32061 neutrons struck the detector | ||
| + | ** <math>\Delta \Omega = 0.0004 Sr</math> | ||
| + | |||
| + | * And, as a second test to verify our results | ||
| + | ** We change the detector size to 1cm by 1cm and used 1E9 neutrons again | ||
| + | ** 7965 neutrons struck the detector | ||
| + | ** <math>\Delta \Omega = 0.0001 Sr</math> | ||
| + | |||
| + | ; Now, what neutron singles rate into the detector should correspond to 1 fission per pulse? | ||
| + | * If we have 1 fission per pulse and each fission emits on average 2.3 neutrons, we should expect 2.3 neutrons/pulse | ||
| + | * The number of neutrons hitting the detector per pulse is found as <math>2.3*\frac{\Delta \Omega}{4\pi}</math> | ||
| + | ** @ 1 meter => 0.0198 neutrons hitting the detector per pulse | ||
| + | ** @ 70 cm => 0.0379 neutrons hitting the detector per pulse | ||
| + | * Taking into account the efficiency of the detector <math>\epsilon_0</math>, the number detected per pulse can be found as <math>2.3*\frac{\Delta \Omega}{4\pi}*\epsilon_0</math> | ||
| + | ** @ 1 meter from source => (<math>0.0198*\epsilon_0=0.0198*0.17=0.003</math>) neutrons detected per pulse | ||
| + | ** @ 70 cm from source => (<math>0.0379*\epsilon_0=0.0379*0.17=0.006</math>) neutrons detected per pulse | ||
| + | |||
| + | ==Neutron and Photon Flux Through Lead== | ||
| + | |||
| + | Using MCNPX, a simulation was done to determine how much of the neutrons and photons from the target will be blocked by various thickness of lead. With a monochromatic pencil beam of incident particles, the following results illustrate how much of the initial beam actually made it through the lead. | ||
| + | |||
| + | [[File:1MeV_Lead.jpg | 600px]] | ||
| + | |||
| + | [[File:5MeV_Lead.jpg | 600px]] | ||
| + | |||
| + | ==Neutron and Photon Flux Through Concrete== | ||
| + | |||
| + | [[File:1MeV_Concrete.jpg | 600px]] | ||
| + | |||
| + | == Detector Cross-Talk == | ||
| + | |||
| + | Using MCNPX, I am trying to simulated the cross-talk we could expect between the big detectors. I used a fission neutron energy spectrum given in MCNPX, shown below. | ||
| + | |||
| + | [[File:FissionNeutronEnergySpectrum.jpg | 800px]] | ||
| + | |||
| + | These neutrons are incident upon a plastic scintillator and I will look at the neutrons and photons coming out of the scintillator's sides perpendicular to the incident beam. The first case I will look at is where the detectors are placed with only polyethylene between them, as illustrated below. | ||
| + | |||
| + | [[File:OLead.png | 400px]] | ||
| + | |||
| + | This results in a neutron and photon energy spectrum as follows. | ||
| + | |||
| + | [[File:NeutronEnergySpectrum.jpg | 800px]] | ||
| + | |||
| + | [[File:PhotonEnergySpectrum.jpg | 800px]] | ||
| + | |||
| + | The next case I will look at is where we put a layer of lead between the polyethylene between the detectors, as shown in the schematic below. | ||
| + | |||
| + | [[File:DetectorSetupwLead.png | 400px]] | ||
| + | |||
| + | The results for this setup using 1 inch of lead between the detectors is as follows. | ||
| + | |||
| + | [[File:NeutronEnergySpectrumPb.jpg | 800px]] | ||
| + | |||
| + | [[File:PhotonEnergySpectrum1inPb.jpg | 800px]] | ||
| + | |||
| + | And, the results for this setup using 2 inches of lead between the detectors is as follows. | ||
| + | |||
| + | [[File:NeutronEnergySpectrum2Pb.jpg | 800px]] | ||
| + | |||
| + | [[File:PhotonEnergySpectrum2Pb.jpg | 800px]] | ||
| + | |||
| + | =August 2012 HRRL Data Analysis= | ||
| + | |||
| + | The detector measurements used for this data analysis are illustrated in the schematic below: | ||
| + | |||
| + | [[File:2ndetectormeas.jpeg | 800 px]] | ||
| + | |||
| + | Using the index of refraction Oleksiy found: | ||
| + | |||
| + | [[File:Slope_data.png]] | ||
| + | |||
| + | When analyzing the data, all the runs in a particular day were added together for better statistics. First, the raw data was used to determine where the neutrons cut would need to be placed for each run (or each day of runs if they were able to be combined). Applying those neutron cuts to each TDC, coincidences were found. The TDC spectra of the detectors that detected these coincidences were then analyzed to determine the spot on the detectors where each neutron hit. Knowing the location of detection, the theta and phi angles between coincident neutrons were found. | ||
| + | |||
| + | ==8/17== | ||
| + | Raw Data: | ||
| + | |||
| + | [[File:TDC8_17.png | 800 px]] | ||
| + | |||
| + | Coincidence Data: | ||
| + | |||
| + | [[File:phi 8_17.png | 800 px]] | ||
| + | |||
| + | [[File:theta 8_17.png | 800 px]] | ||
| + | |||
| + | ==8/20== | ||
| + | Raw Data: | ||
| + | |||
| + | [[File:TDC8_20.png | 800 px]] | ||
| + | |||
| + | Coincidence Data: | ||
| + | |||
| + | [[File:phi8_20.png | 800 px]] | ||
| + | |||
| + | [[File:theta8_20.png | 800 px]] | ||
| + | |||
| + | ==8/21== | ||
| + | Raw Data: | ||
| + | |||
| + | [[File:TDC8_21.png | 800 px]] | ||
| + | |||
| + | Here the multiple peak indicate that the timing in the beam was shifting, thus not allowing to combine. Each run of this day is plotted below. | ||
| + | |||
| + | ===4143=== | ||
| + | [[File:TDC8_21_4143.png | 800 px]] | ||
| + | |||
| + | ===4144=== | ||
| + | [[File:TDC8_21_4144.png | 800 px]] | ||
| + | |||
| + | ===4145=== | ||
| + | [[File:TDC8_21_4145.png | 800 px]] | ||
| + | |||
| + | ===4146=== | ||
| + | [[File:TDC8_21_4146.png | 800 px]] | ||
| + | |||
| + | ==8/22== | ||
| + | Raw Data: | ||
| + | |||
| + | [[File:TDC8_22.png | 800 px]] | ||
| + | |||
| + | Coincidence Data: | ||
| + | |||
| + | [[File:phi8_22.png | 800 px]] | ||
| + | |||
| + | [[File:theta8_22.png | 800 px]] | ||
| + | |||
| + | ==8/23== | ||
| + | Raw Data: | ||
| + | |||
| + | [[File:TDC_8_23.png | 800 px]] | ||
| + | |||
| + | Coincidence Data: | ||
| + | |||
| + | [[File:phi8_23.png | 800 px]] | ||
| + | |||
| + | [[File:theta8_23.png | 800 px]] | ||
| + | |||
| + | ==8/24== | ||
| + | Raw Data: | ||
| + | |||
| + | [[File:TDC8_24.png | 800 px]] | ||
| + | |||
| + | Coincidence Data: | ||
| + | |||
| + | [[File:phi8_24.png | 800 px]] | ||
| + | |||
| + | [[File:theta8_24.png | 800 px]] | ||
| + | |||
| + | ==8/17 - 8/20== | ||
| + | [[File:TDC8_17_20.png | 800 px]] | ||
| + | |||
| + | ==8/17 - 8/21== | ||
| + | [[File:TDC8_17_21.png | 800 px]] | ||
| + | |||
| + | ==8/17 - 8/22== | ||
| + | [[File:TDC8_17_22.png | 800 px]] | ||
| + | |||
| + | |||
| + | |||
| − | |||
| − | |||
| − | |||
[https://wiki.iac.isu.edu/index.php/User:Jasenswanson Go Back] | [https://wiki.iac.isu.edu/index.php/User:Jasenswanson Go Back] | ||
Latest revision as of 20:51, 2 October 2012
Pre-setup Calculations
Big Detector Solid Angle Calculations
- MCNPX Simulation
- 14 MeV neutron source, emitted isotropically ()
- Detector placed 1m away from source
- face of the detector is 15.24cm x 76.2cm, and 3.6cm deep
The solid angle can be found from the number of particles hitting the detector as:
- Results
- Out of 1E9 neutrons generated, 8618287 neutrons hit the detector
-
- if the detector is placed 70cm away from the source,
- if the detector is placed 65cm away from the source,
-
- As a test to verify our results
- We change the detector size to 2cm by 2cm and used 1E9 neutrons again
- 32061 neutrons struck the detector
- And, as a second test to verify our results
- We change the detector size to 1cm by 1cm and used 1E9 neutrons again
- 7965 neutrons struck the detector
- Now, what neutron singles rate into the detector should correspond to 1 fission per pulse?
- If we have 1 fission per pulse and each fission emits on average 2.3 neutrons, we should expect 2.3 neutrons/pulse
- The number of neutrons hitting the detector per pulse is found as
- @ 1 meter => 0.0198 neutrons hitting the detector per pulse
- @ 70 cm => 0.0379 neutrons hitting the detector per pulse
- Taking into account the efficiency of the detector , the number detected per pulse can be found as
- @ 1 meter from source => () neutrons detected per pulse
- @ 70 cm from source => () neutrons detected per pulse
Neutron and Photon Flux Through Lead
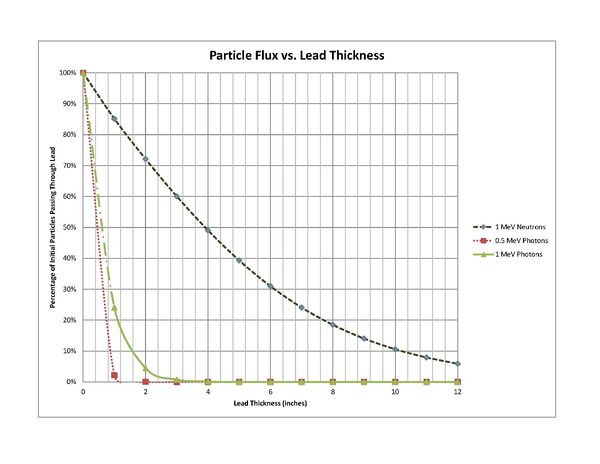
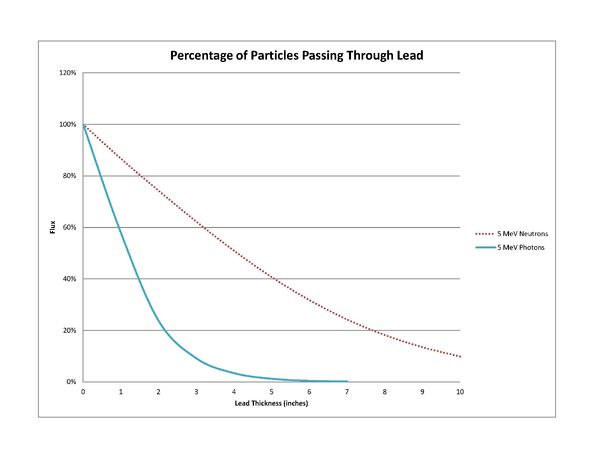
Using MCNPX, a simulation was done to determine how much of the neutrons and photons from the target will be blocked by various thickness of lead. With a monochromatic pencil beam of incident particles, the following results illustrate how much of the initial beam actually made it through the lead.
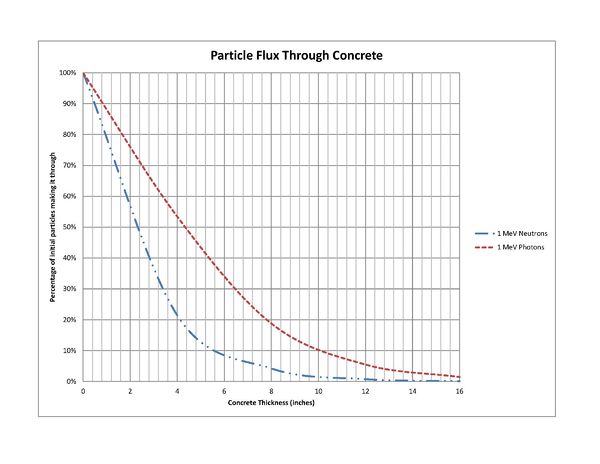
Neutron and Photon Flux Through Concrete
Detector Cross-Talk
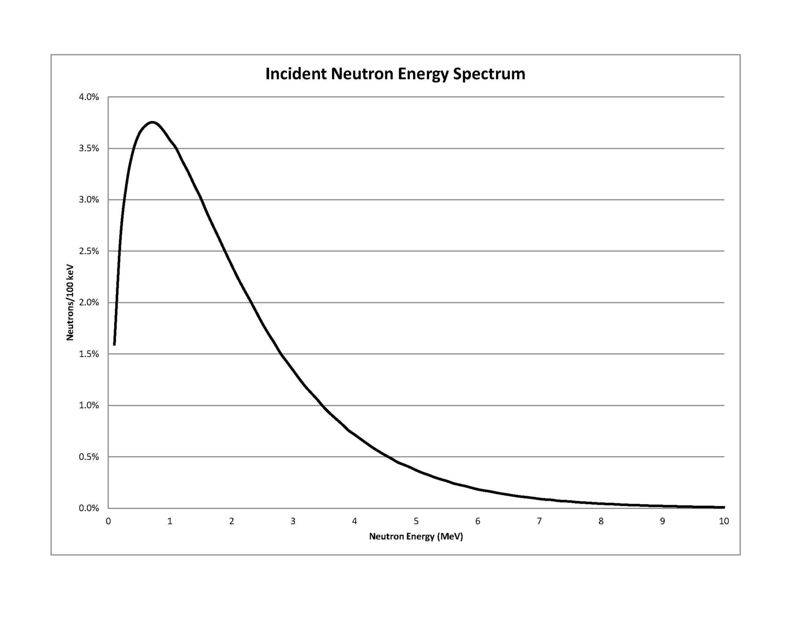
Using MCNPX, I am trying to simulated the cross-talk we could expect between the big detectors. I used a fission neutron energy spectrum given in MCNPX, shown below.
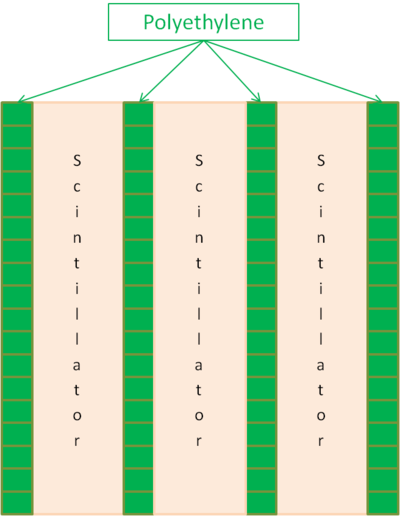
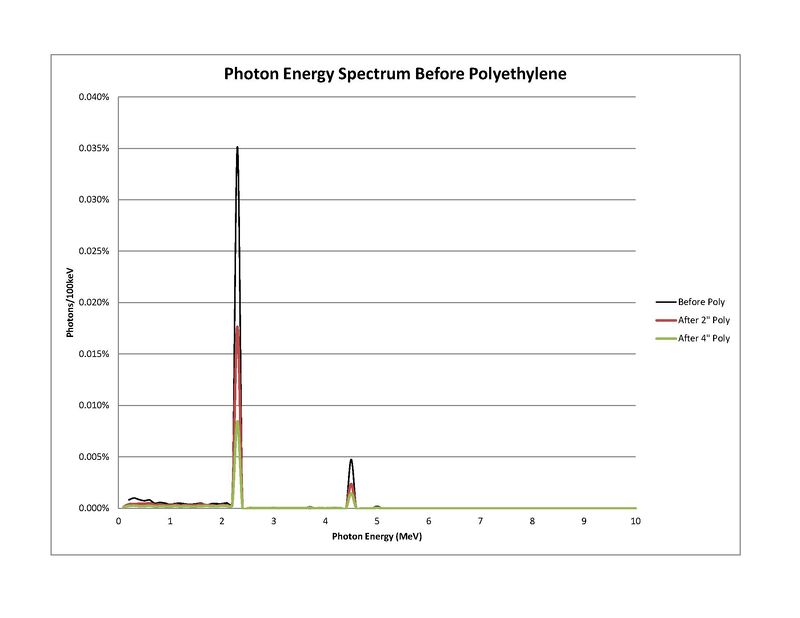
These neutrons are incident upon a plastic scintillator and I will look at the neutrons and photons coming out of the scintillator's sides perpendicular to the incident beam. The first case I will look at is where the detectors are placed with only polyethylene between them, as illustrated below.
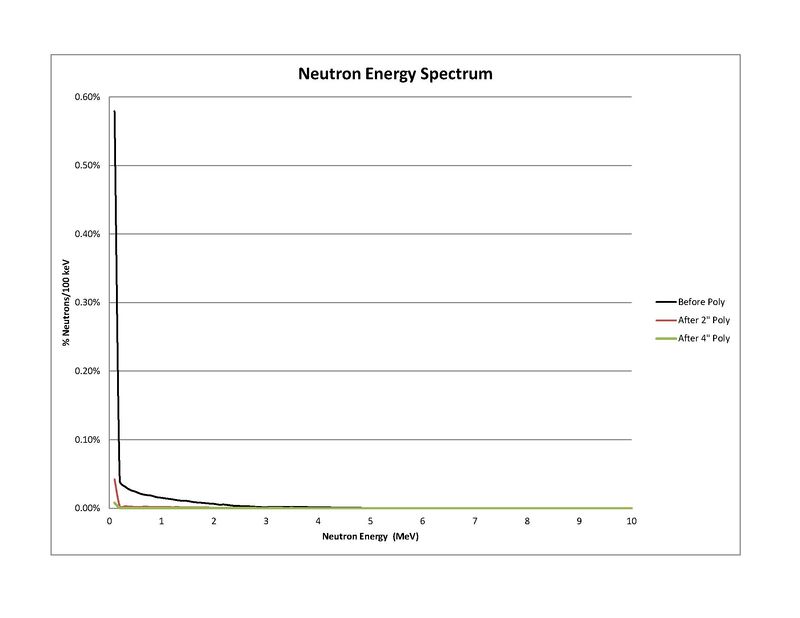
This results in a neutron and photon energy spectrum as follows.
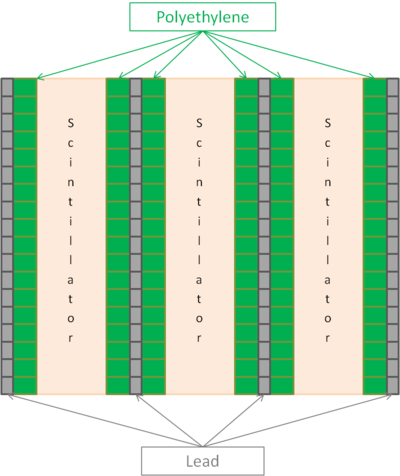
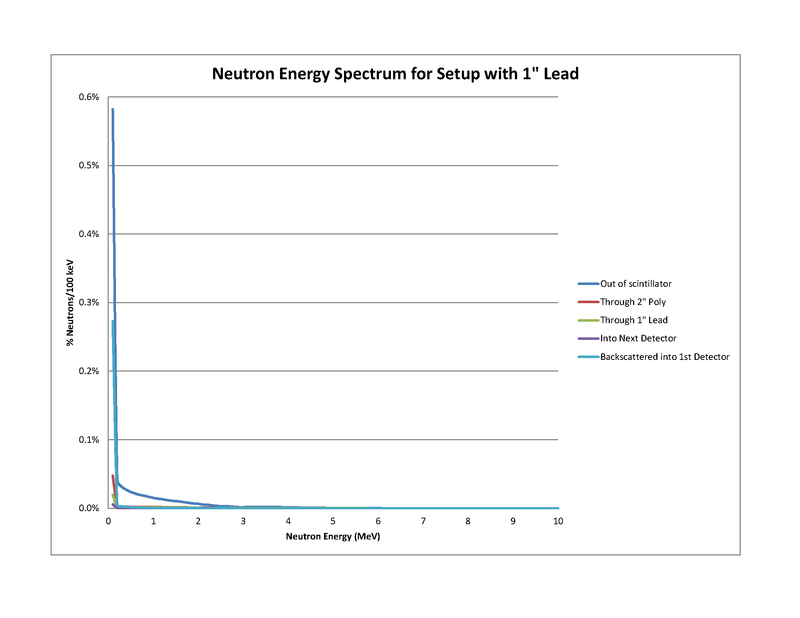
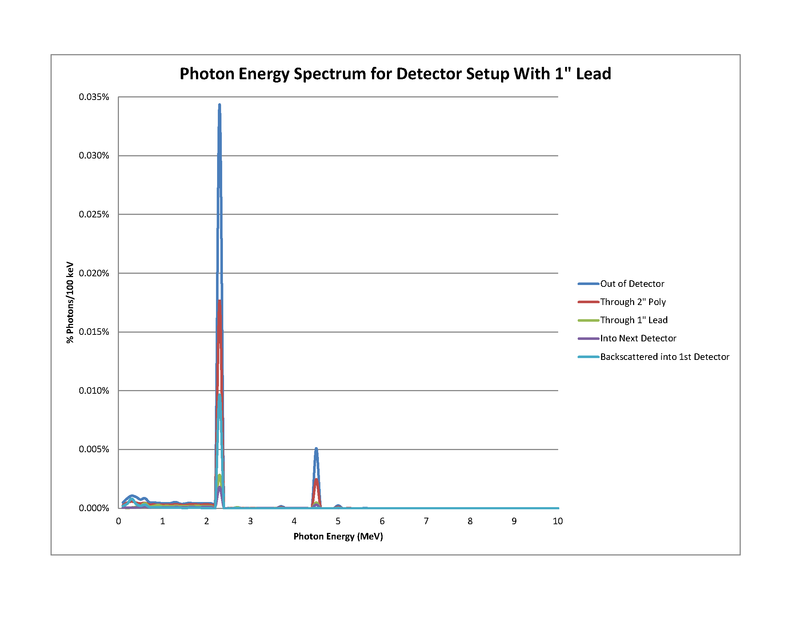
The next case I will look at is where we put a layer of lead between the polyethylene between the detectors, as shown in the schematic below.
The results for this setup using 1 inch of lead between the detectors is as follows.
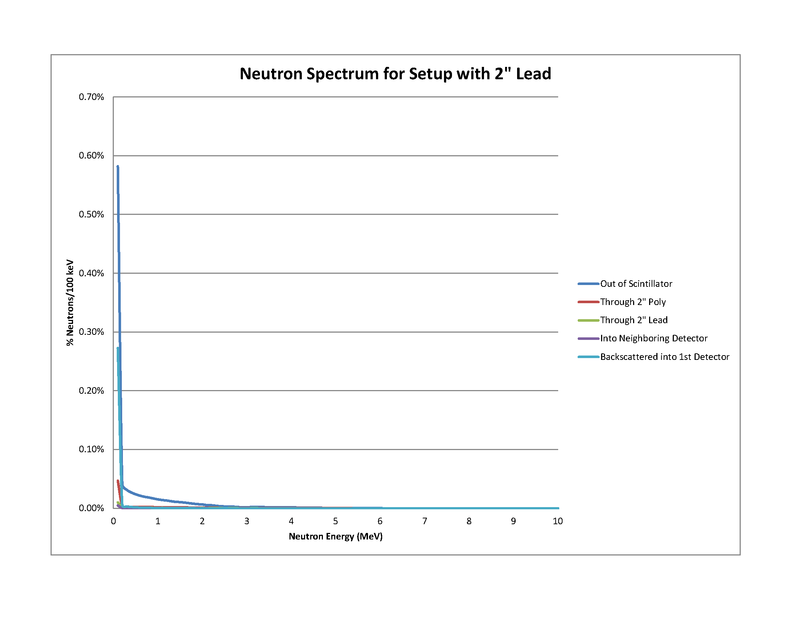
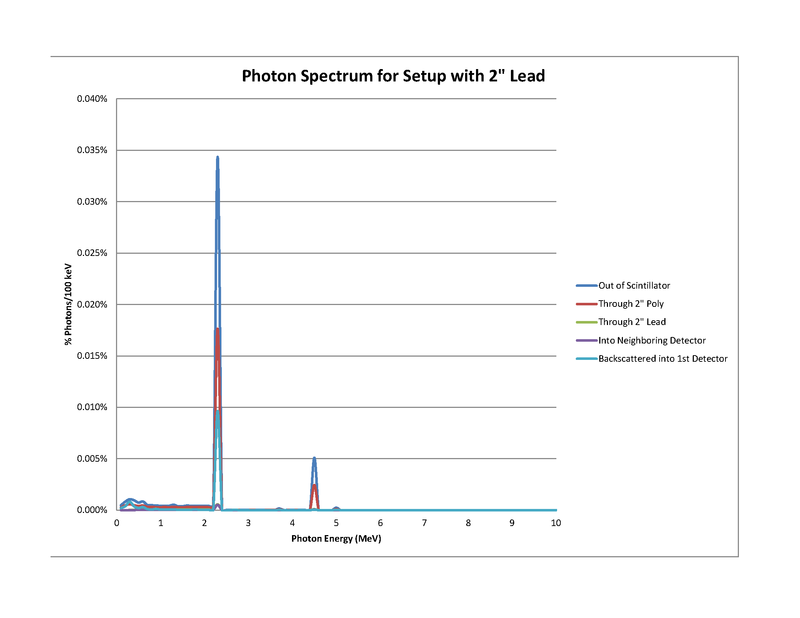
And, the results for this setup using 2 inches of lead between the detectors is as follows.
August 2012 HRRL Data Analysis
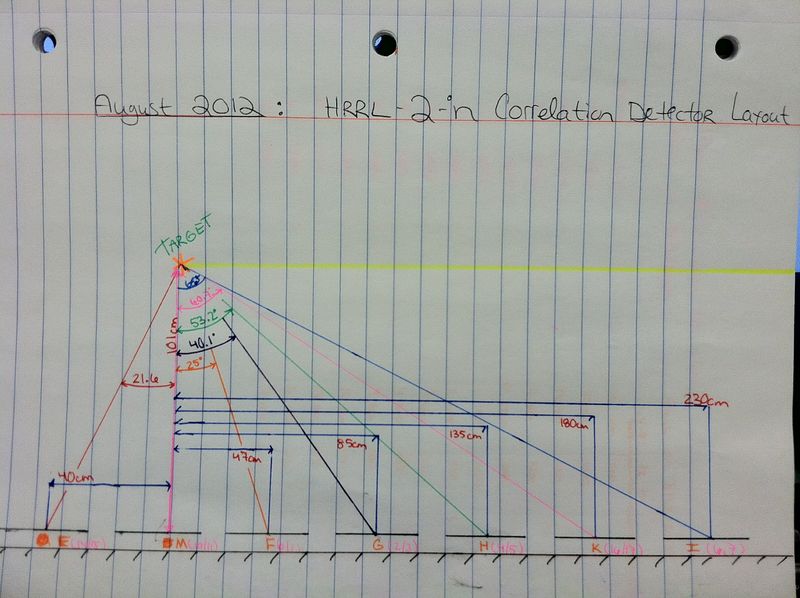
The detector measurements used for this data analysis are illustrated in the schematic below:
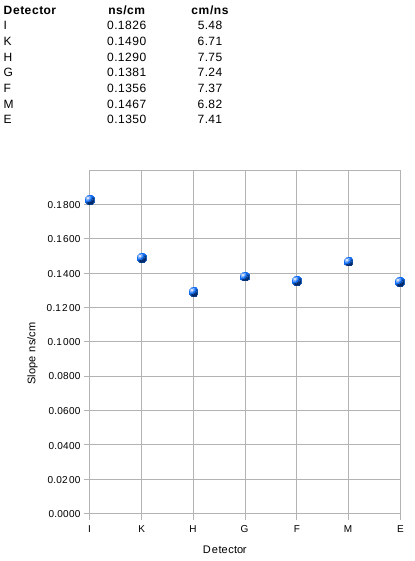
Using the index of refraction Oleksiy found:
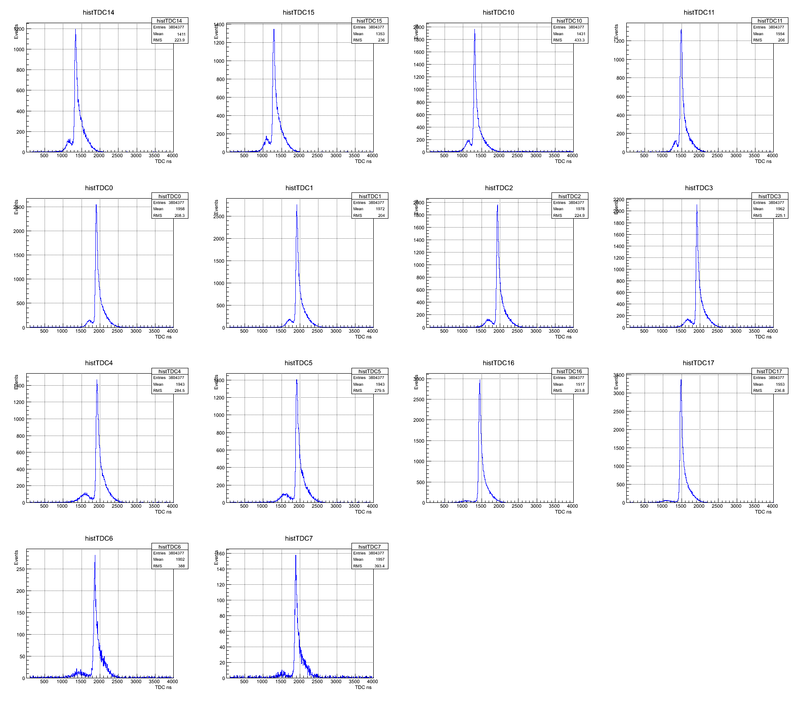
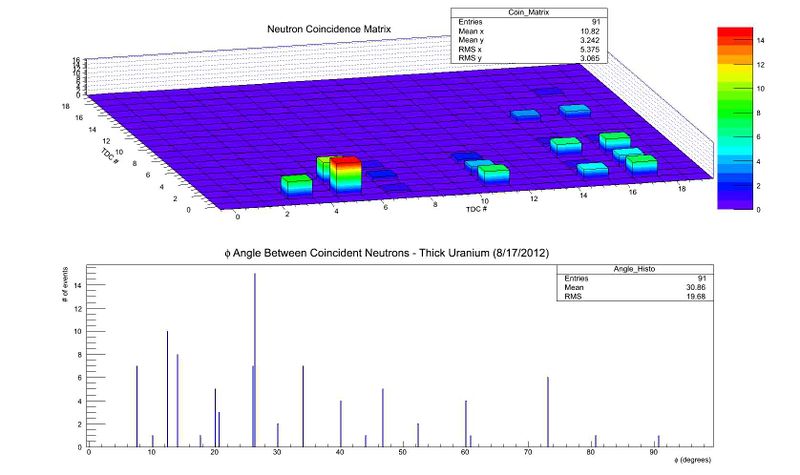
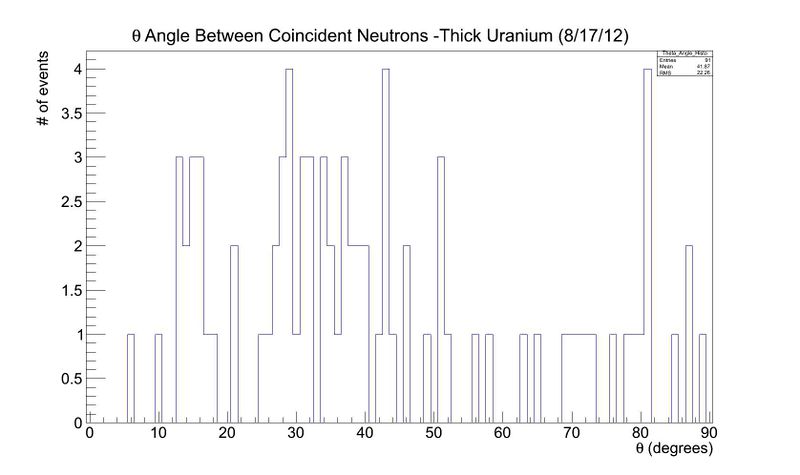
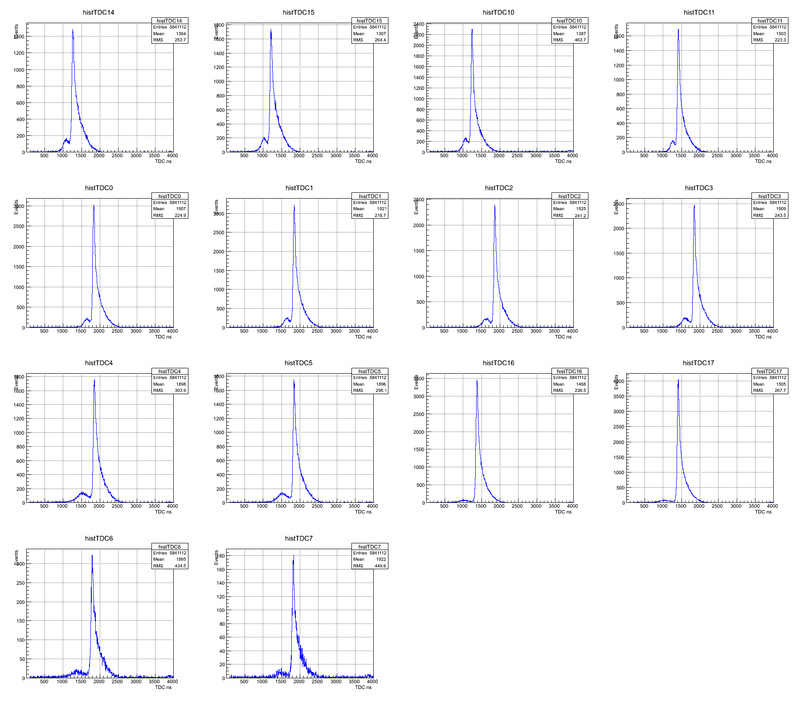
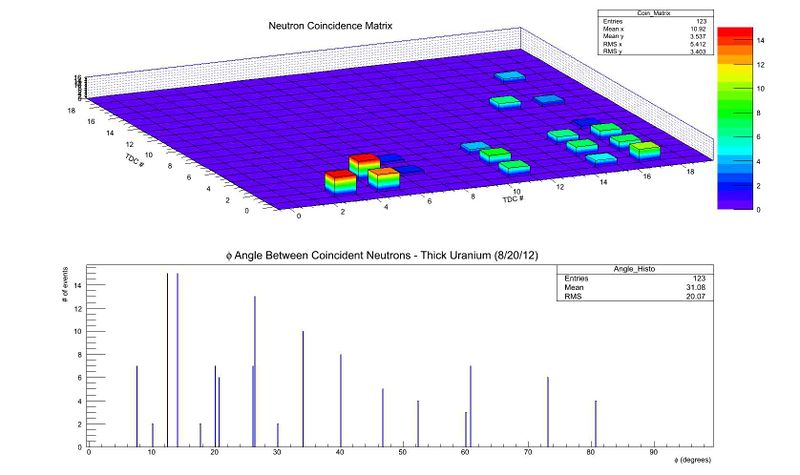
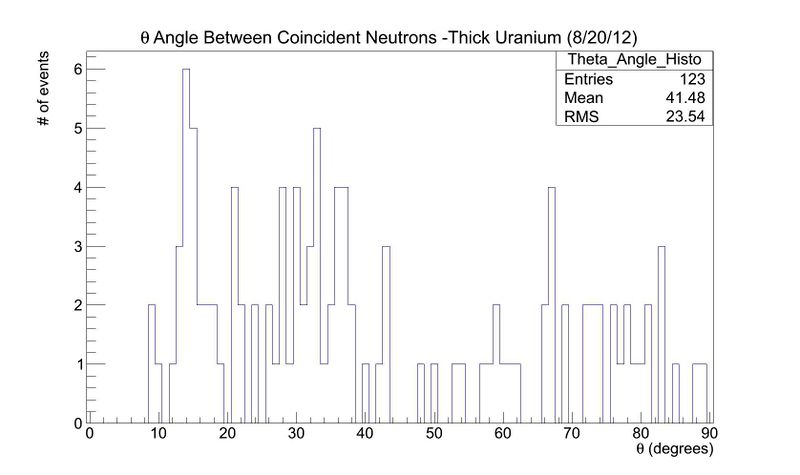
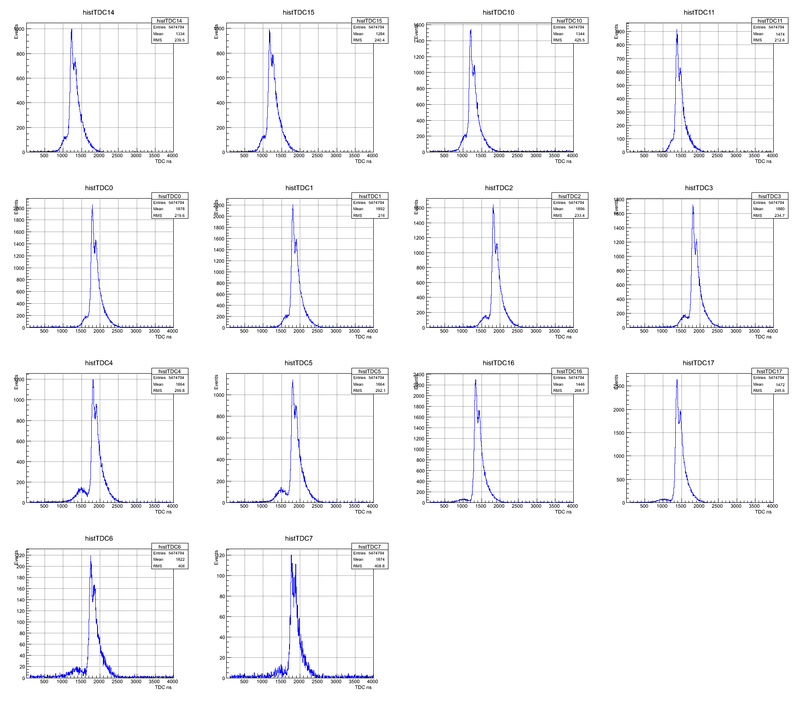
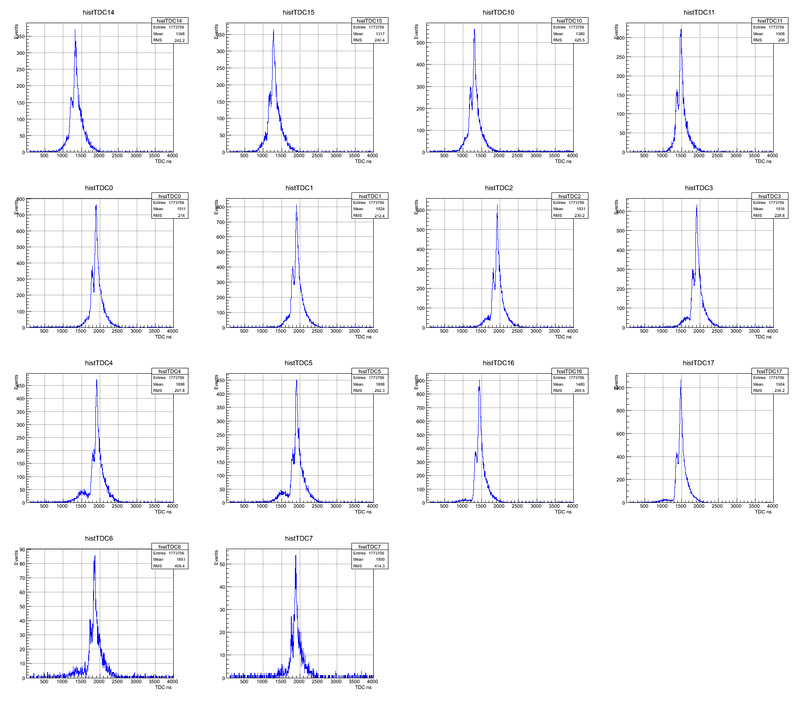
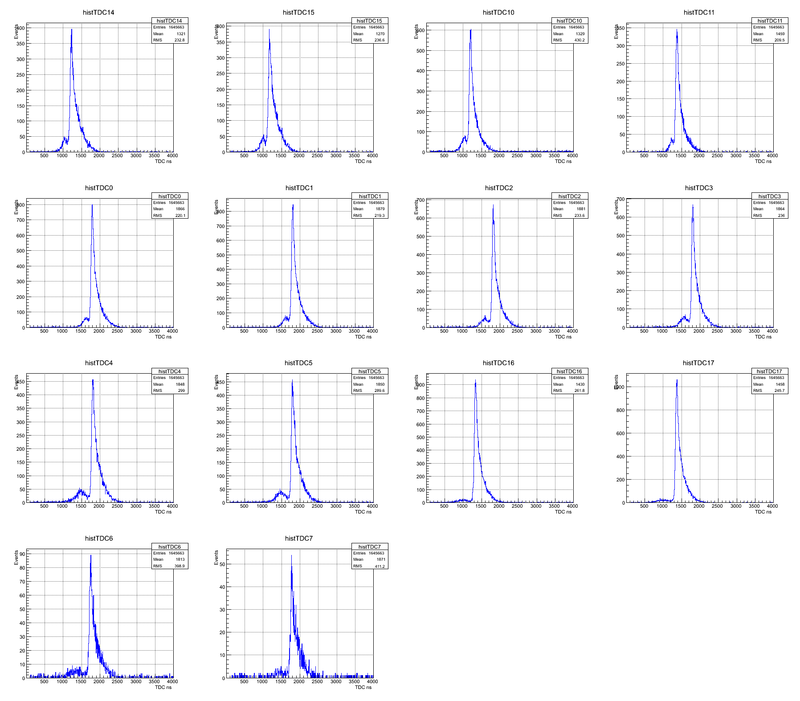
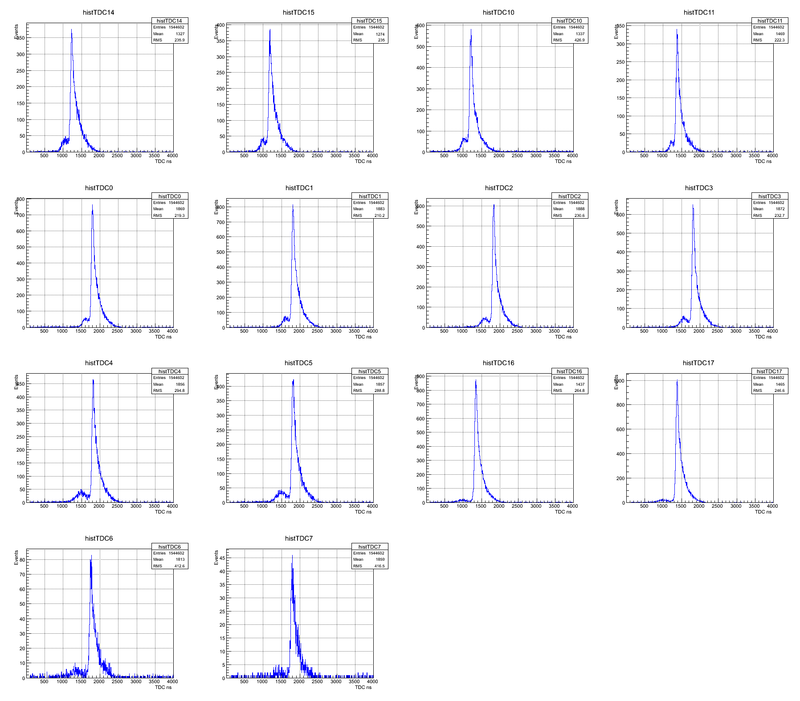
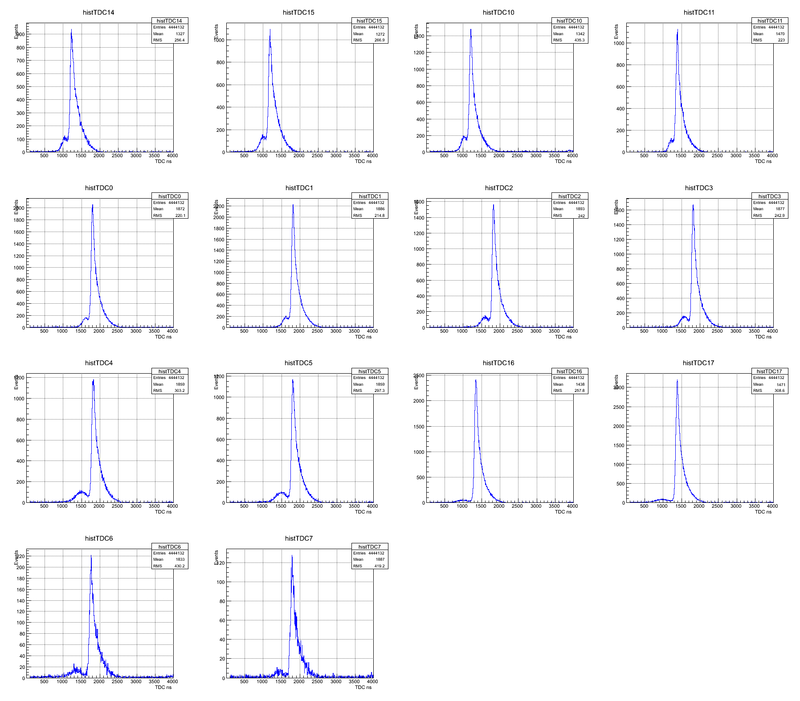
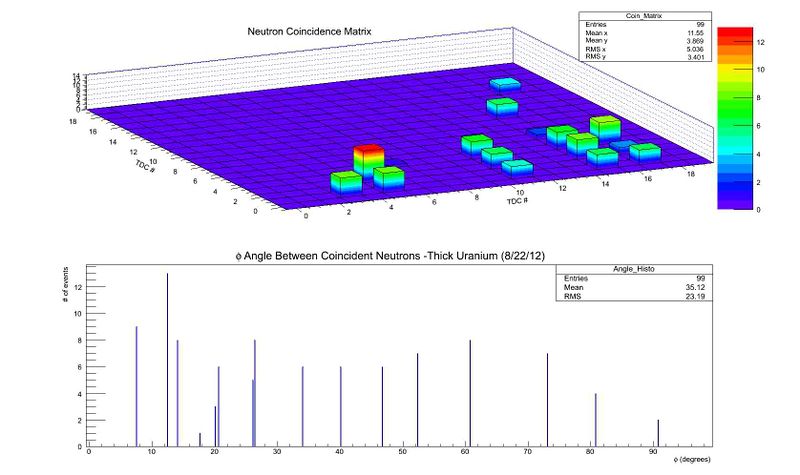
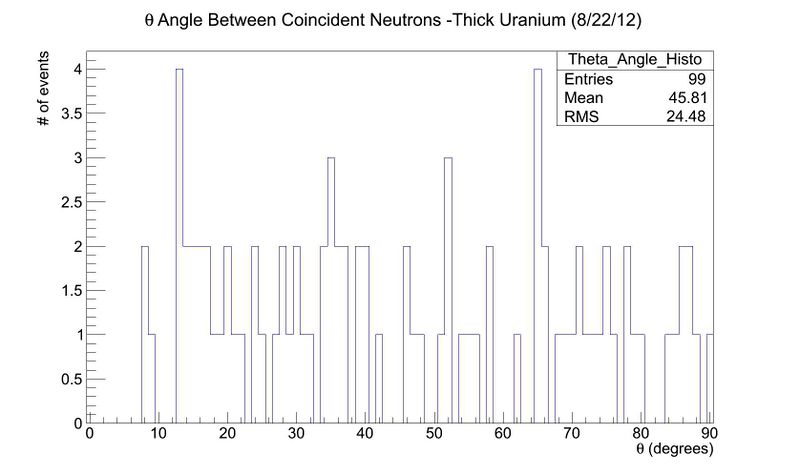
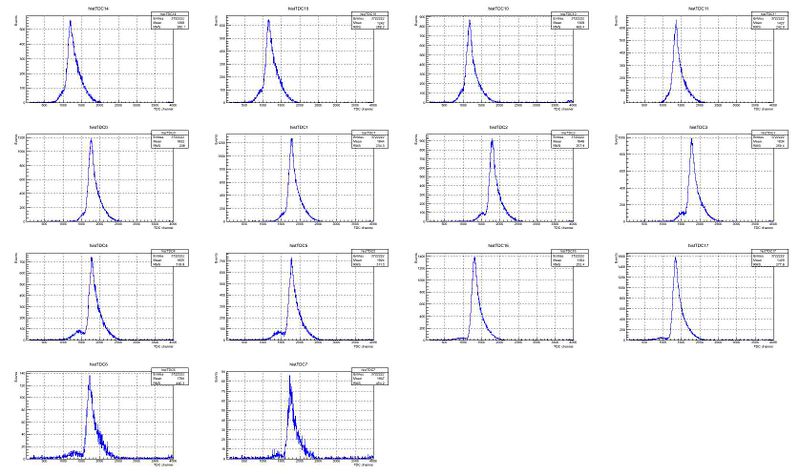
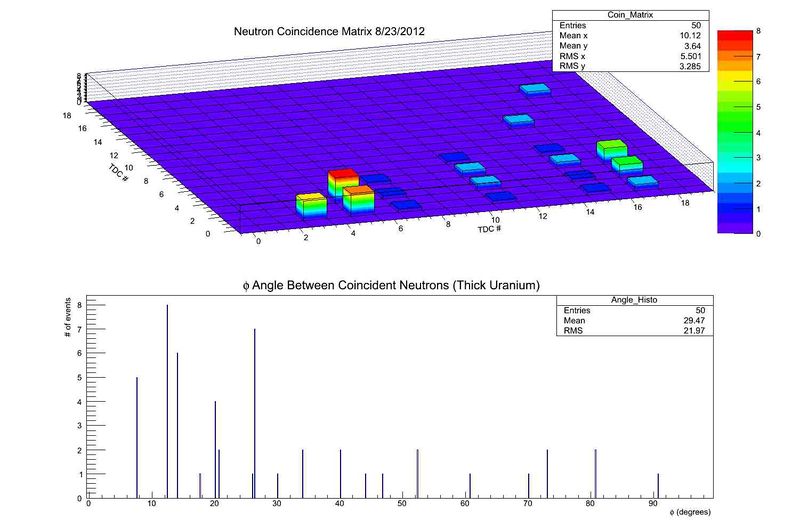
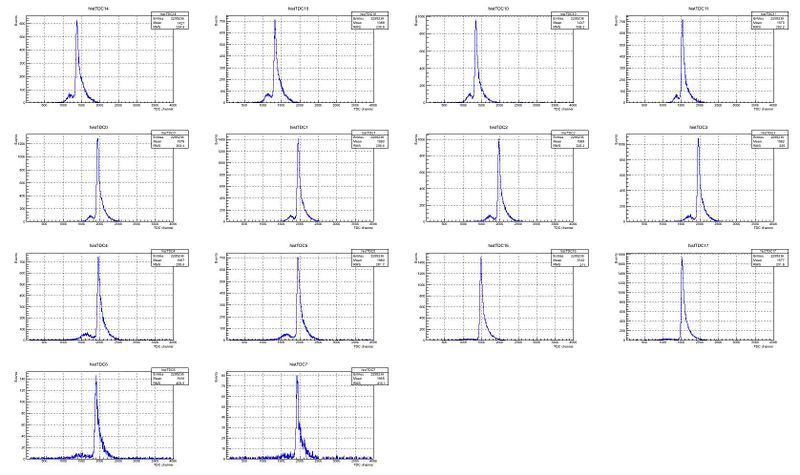
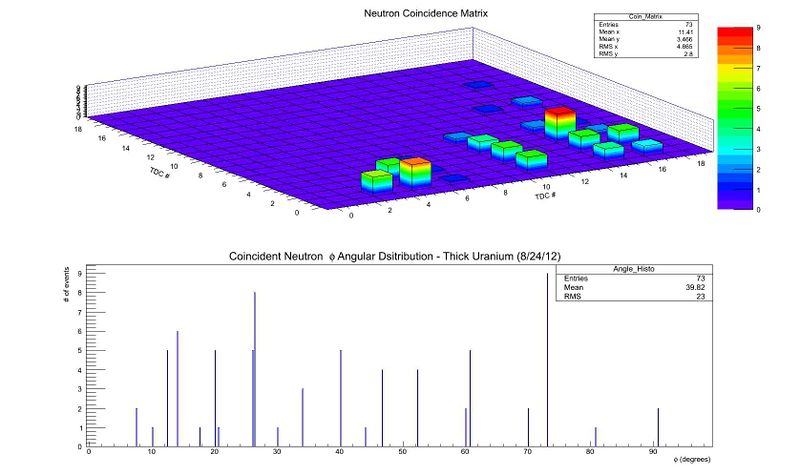
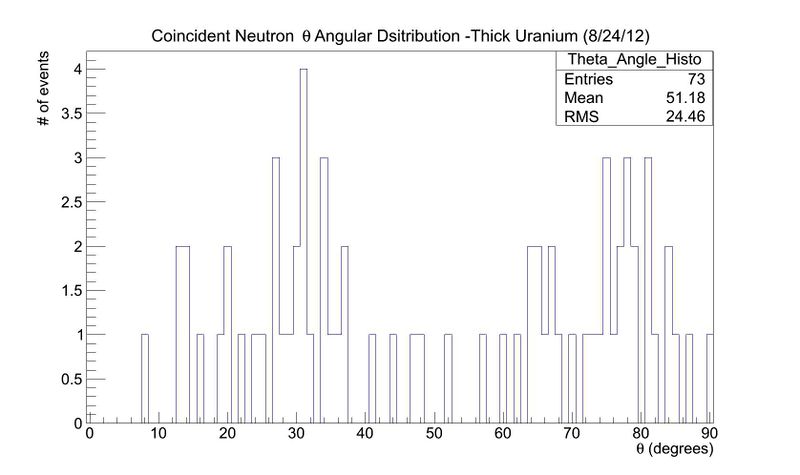
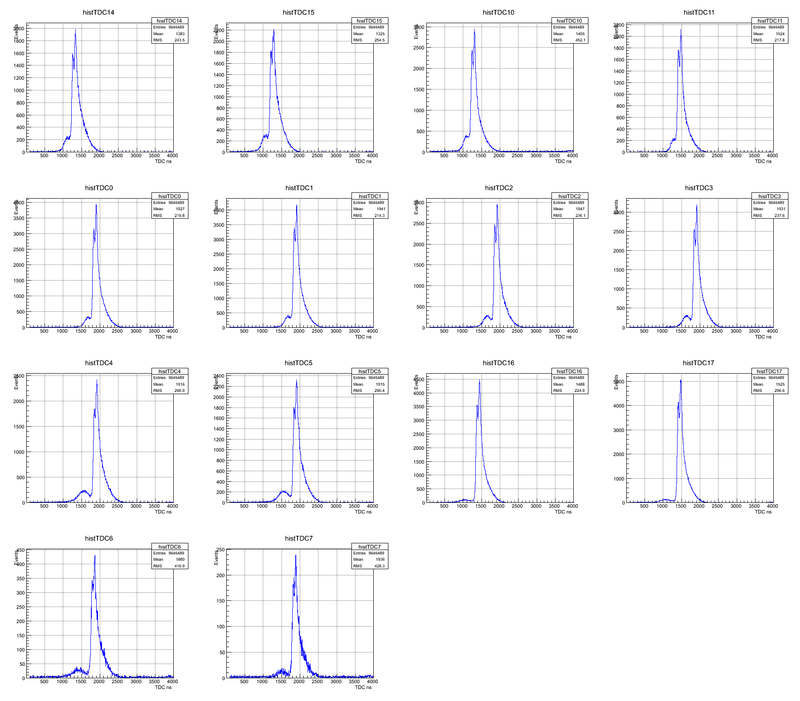
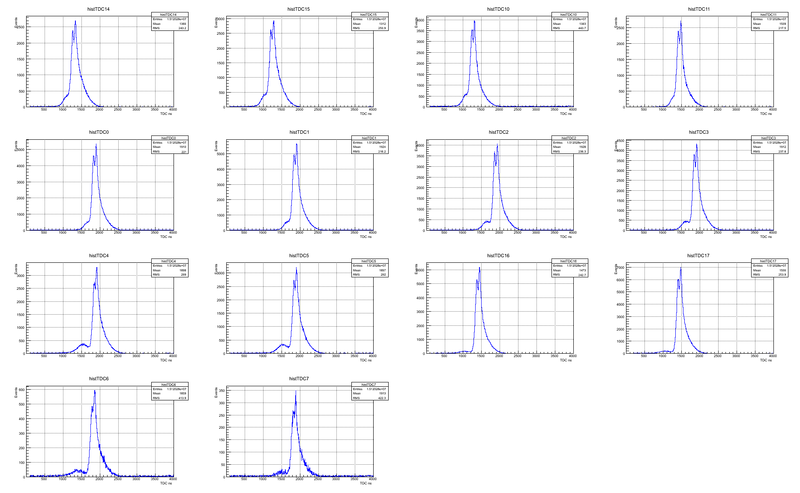
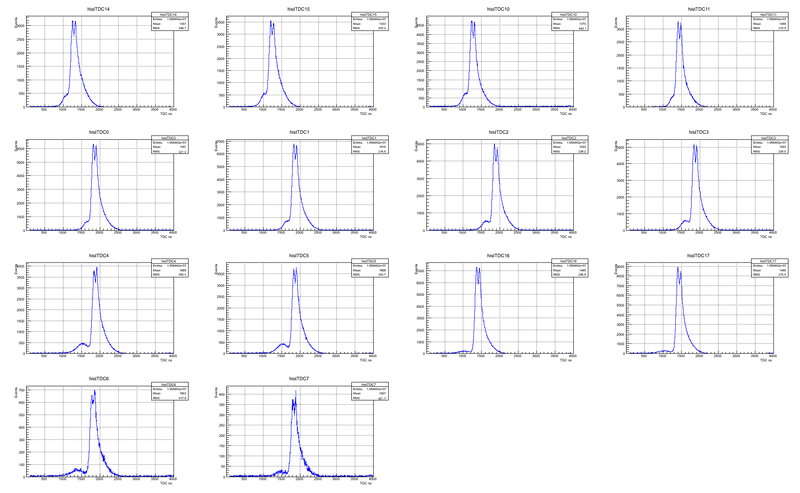
When analyzing the data, all the runs in a particular day were added together for better statistics. First, the raw data was used to determine where the neutrons cut would need to be placed for each run (or each day of runs if they were able to be combined). Applying those neutron cuts to each TDC, coincidences were found. The TDC spectra of the detectors that detected these coincidences were then analyzed to determine the spot on the detectors where each neutron hit. Knowing the location of detection, the theta and phi angles between coincident neutrons were found.
8/17
Raw Data:
Coincidence Data:
8/20
Raw Data:
Coincidence Data:
8/21
Raw Data:
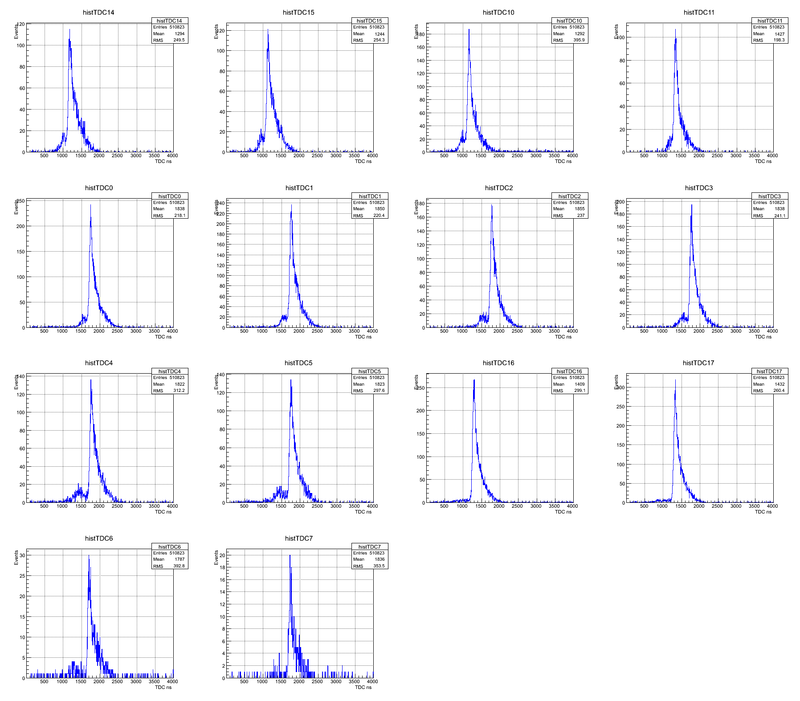
Here the multiple peak indicate that the timing in the beam was shifting, thus not allowing to combine. Each run of this day is plotted below.
4143
4144
4145
4146
8/22
Raw Data:
Coincidence Data:
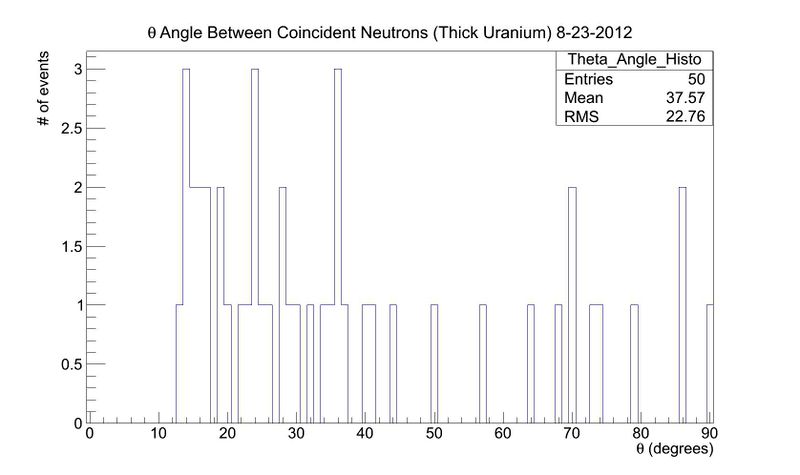
8/23
Raw Data:
Coincidence Data:
8/24
Raw Data:
Coincidence Data:
8/17 - 8/20
8/17 - 8/21
8/17 - 8/22
