Difference between revisions of "Yields and Asymmetry versus Energy Cuts."
| (4 intermediate revisions by the same user not shown) | |||
| Line 16: | Line 16: | ||
[[File:2n energy correlations vs cuts more.png | 800px]] | [[File:2n energy correlations vs cuts more.png | 800px]] | ||
| + | |||
| + | That I can not explain at present time. Maybe there are some physics or maybe that is just simple statistical fluctuation. Need more investigation. | ||
| + | |||
[[File:2n yields vs cuts more.png | 800px]] | [[File:2n yields vs cuts more.png | 800px]] | ||
| + | |||
| + | The peak is probably due to the energy neutron spectrum (no, there are some code issues, it's appears on about 20 step, do not always at that energy above)) | ||
| + | |||
[[File:2n counts vs cuts more.png | 800px]] | [[File:2n counts vs cuts more.png | 800px]] | ||
| + | |||
| + | The peak is probably due to the energy neutron spectrum | ||
==Summary table of yields and asymmetry versus energy cuts== | ==Summary table of yields and asymmetry versus energy cuts== | ||
| Line 33: | Line 41: | ||
[[File:2n energy correlations error vs cuts more.png | 800px]] | [[File:2n energy correlations error vs cuts more.png | 800px]] | ||
| − | To do more investigation | + | To do more investigation I will need more statistics. But that is problematically at present moment due to the lack of hard disk space: |
| − | * | + | *10 M events is about 1 Gb file. |
| − | * | + | *Say I want 100 times more statistics. I will need about 100 Gb free space |
Latest revision as of 15:35, 21 June 2011
Follow are some Monte Carlo simulations of 2n correlations. One neutron are from one FF, two neutrons per fission. No accidental neutron was considered, all neutrons are correlated. Total 10M events was simulated. Every neutron was sampled up to 10 MeV. The polarization of gammas are zero.
2n Asymmetry versus Energy Cut
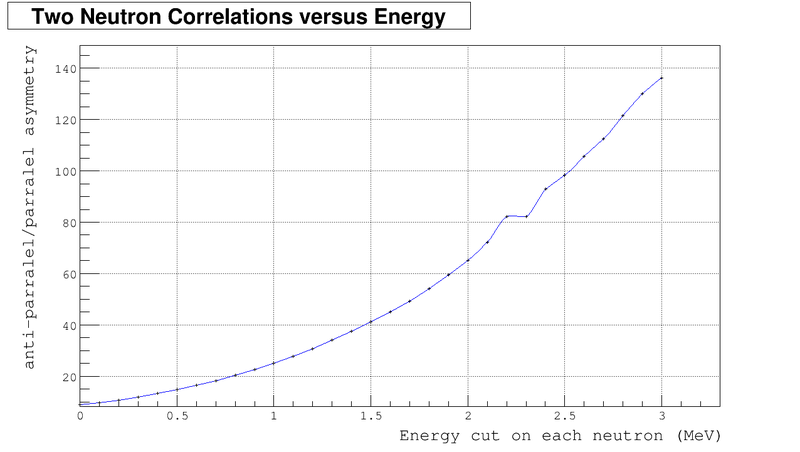
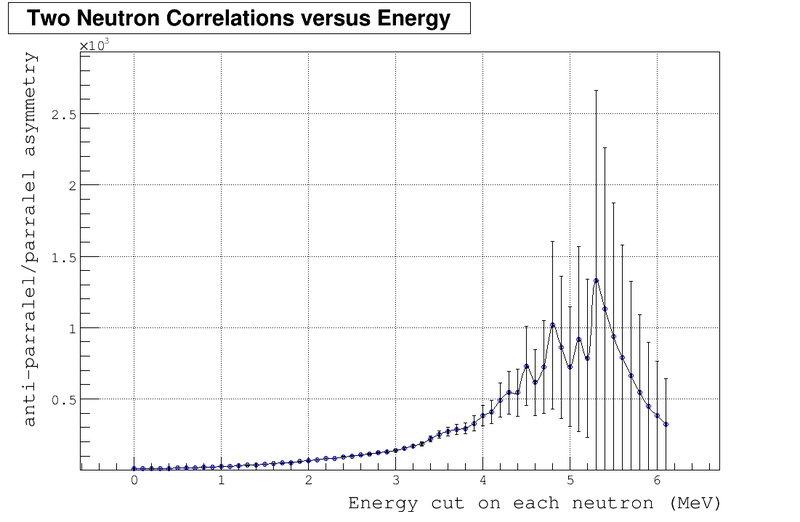
It was been shown by Dr Dale that Asymmetry of 2n correlations (anti-parallel/parallel) is the strong function of energy cuts and increases as energy cut increases.
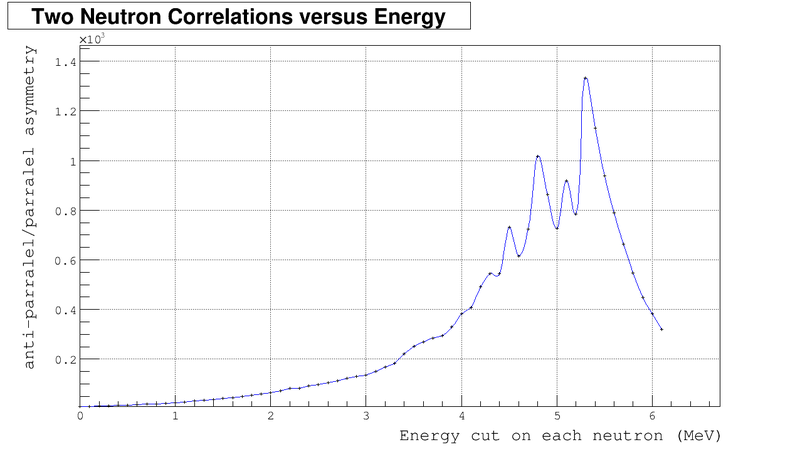
Let's see what happens if we increase the energy cuts
That I can not explain at present time. Maybe there are some physics or maybe that is just simple statistical fluctuation. Need more investigation.
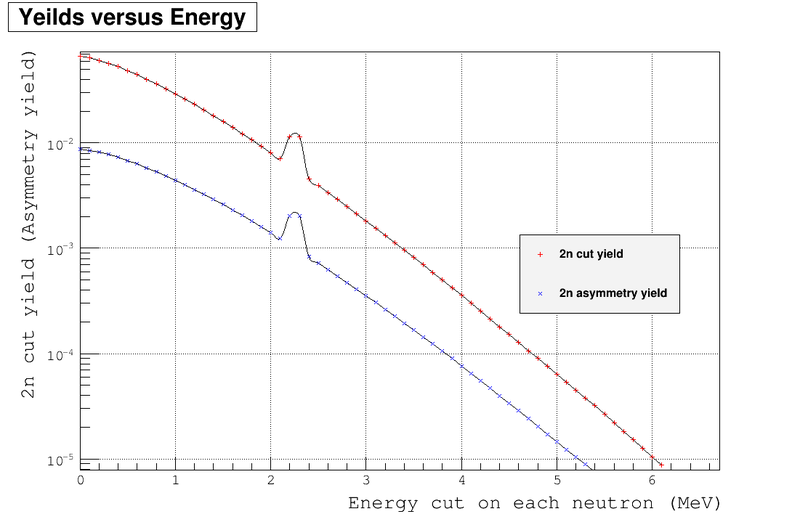
The peak is probably due to the energy neutron spectrum (no, there are some code issues, it's appears on about 20 step, do not always at that energy above))
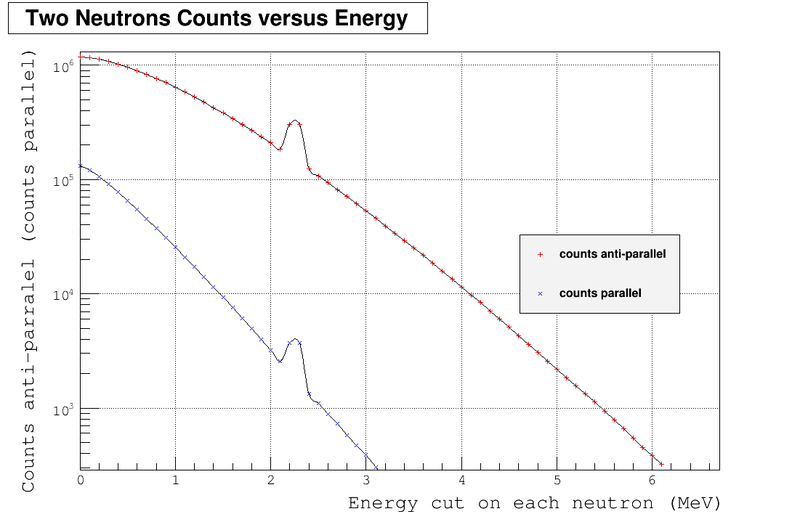
The peak is probably due to the energy neutron spectrum
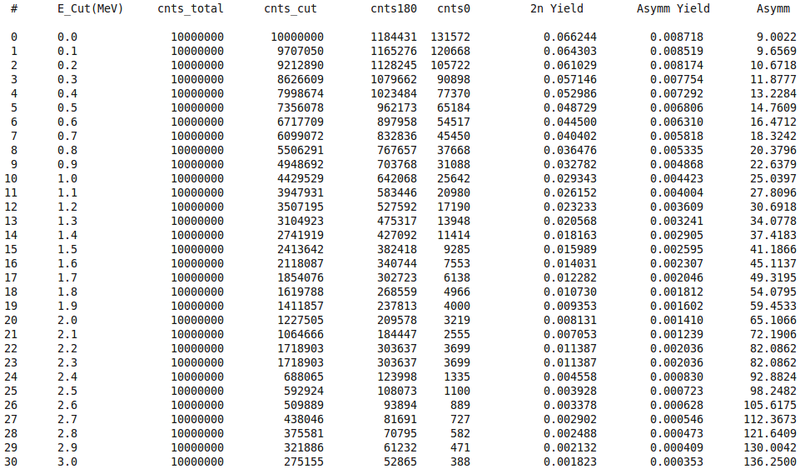
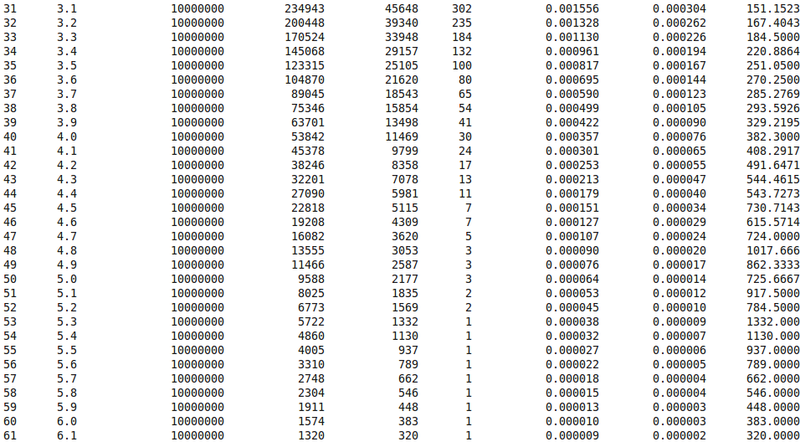
Summary table of yields and asymmetry versus energy cuts
Because cnts0 becomes really small quantity we need to analyze errors
To do more investigation I will need more statistics. But that is problematically at present moment due to the lack of hard disk space:
- 10 M events is about 1 Gb file.
- Say I want 100 times more statistics. I will need about 100 Gb free space
