Difference between revisions of "TF EIMLab9 Writeup"
| (8 intermediate revisions by the same user not shown) | |||
| Line 6: | Line 6: | ||
[[File:TF_EIM_Lab9.png | 200 px]] | [[File:TF_EIM_Lab9.png | 200 px]] | ||
| − | Using Diode | + | Using Diode 1N5230B |
And | And | ||
| Line 18: | Line 18: | ||
3.)Based on your observations using a oscilloscope, sketch the voltages <math>V_{in}</math> and <math>V_{out}</math> as a function of time. | 3.)Based on your observations using a oscilloscope, sketch the voltages <math>V_{in}</math> and <math>V_{out}</math> as a function of time. | ||
| + | Outoput for several input voltages near the bias point | ||
| + | {| border="3" cellpadding="20" cellspacing="0" | ||
| + | | V_{in} = 0.5V || V_{in} = 0.6 V|| V_{in} = 0.75 V|| V_{in} = 0.8 V|| V_{in} = 1.0 V | ||
| + | |- | ||
| + | |[[File:TF_EIM_Lab9_P1_0.5V.png | 100 px]] ||[[File: TF_EIM_Lab9_P1_0.6V.png | 100 px]]||[[File: TF_EIM_Lab9_P1_0.75V.png | 100 px]]||[[File: TF_EIM_Lab9_P1_0.8V.png | 100 px]]||[[File: TF_EIM_Lab9_P1_1.0V.png | 100 px]] | ||
| + | |- | ||
| + | |} | ||
4.)Do another sketch for<math> V_0</math> = 1.0 V and another for 10.0 V (DONT LET ANY SMOKE OUT!). (20 pnts) | 4.)Do another sketch for<math> V_0</math> = 1.0 V and another for 10.0 V (DONT LET ANY SMOKE OUT!). (20 pnts) | ||
| Line 49: | Line 56: | ||
4.)plot <math>V_{in}</math> and <math>V_{out}</math> as a function of time using your scope observations. (20 pnts) | 4.)plot <math>V_{in}</math> and <math>V_{out}</math> as a function of time using your scope observations. (20 pnts) | ||
| + | |||
| + | |||
| + | {| border="3" cellpadding="20" cellspacing="0" | ||
| + | | Signal setup|| RC fall time | ||
| + | |- | ||
| + | |[[File:TF_EIM_Lab9_P2_5V_Signal.png | 200 px]] ||[[File: TF_EIM_Lab9_P2_RCfallTime.png | 200 px]] | ||
| + | |- | ||
| + | |} | ||
5.) Now add the diode circuit from part 1 to prevent <math>V_{out}</math> from rising above +5 V. Sketch the new circuit below. | 5.) Now add the diode circuit from part 1 to prevent <math>V_{out}</math> from rising above +5 V. Sketch the new circuit below. | ||
| + | |||
| + | |||
| + | |||
| + | |||
6.)plot <math>V_{in}</math> and <math>V_{out}</math> as a function of time with the diode circuit you added using your scope observations. (the diode should clip off positive spikes)(20 pnts) | 6.)plot <math>V_{in}</math> and <math>V_{out}</math> as a function of time with the diode circuit you added using your scope observations. (the diode should clip off positive spikes)(20 pnts) | ||
| + | |||
| + | |||
| + | Notice the output pulse does not increase when V_{in} is increased | ||
| + | |||
| + | {| border="3" cellpadding="20" cellspacing="0" | ||
| + | | V_{in} = 4 V || V_{in} = 7 V|| V_{in} =9V | ||
| + | |- | ||
| + | |[[File:TF_EIM_Lab9_P2_Vin4V.png | 200 px]] ||[[File: TF_EIM_Lab9_P2_Vin7V.png | 200 px]]||[[File: TF_EIM_Lab9_P2_Vin9V.png | 200 px]] | ||
| + | |- | ||
| + | |} | ||
=Questions= | =Questions= | ||
#Explain your results in parts 1 & 2 in terms of the diode turn-on voltage. (20 pnts) | #Explain your results in parts 1 & 2 in terms of the diode turn-on voltage. (20 pnts) | ||
Latest revision as of 18:18, 4 March 2011
Lab 9: Diode Circuits
Clipping Circuit
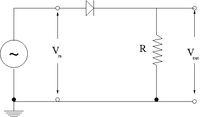
1.) Construct the circuit shown below using a silicon diode.
Using Diode 1N5230B
And
R= 9.6k
2.) Use a sine wave generator to drive the circuit so where V and = 1kHz. (20 pnts)
3.)Based on your observations using a oscilloscope, sketch the voltages and as a function of time.
Outoput for several input voltages near the bias point
| V_{in} = 0.5V | V_{in} = 0.6 V | V_{in} = 0.75 V | V_{in} = 0.8 V | V_{in} = 1.0 V |
 |
 |
 |
 |

|
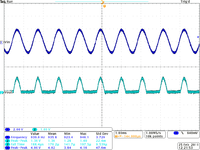
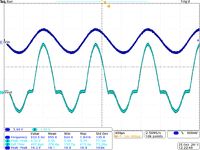
4.)Do another sketch for = 1.0 V and another for 10.0 V (DONT LET ANY SMOKE OUT!). (20 pnts)
| V_{in} = 1 V | V_{in} = 10 V |
 |
|
Differentiating Circuit with clipping
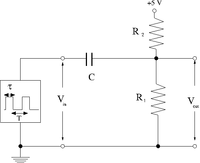
1.)Construct the circuit below.
2.)Select and such that the current from the +5V DC source is less than 1.0 mA and the DC voltage at is 3 V when there is no input pulse.
3.)Select a capacitor and a pulse width to form a differentiating circuit for the pulse from the signal generator. Hint: .
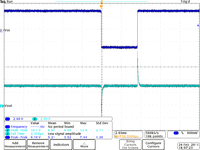
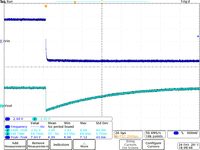
4.)plot and as a function of time using your scope observations. (20 pnts)
| Signal setup | RC fall time |
 |
|
5.) Now add the diode circuit from part 1 to prevent from rising above +5 V. Sketch the new circuit below.
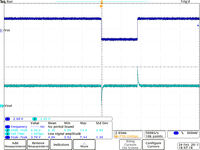
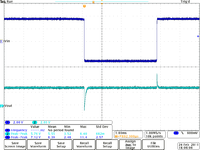
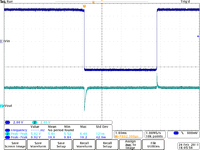
6.)plot and as a function of time with the diode circuit you added using your scope observations. (the diode should clip off positive spikes)(20 pnts)
Notice the output pulse does not increase when V_{in} is increased
| V_{in} = 4 V | V_{in} = 7 V | V_{in} =9V |
 |
 |
|
Questions
- Explain your results in parts 1 & 2 in terms of the diode turn-on voltage. (20 pnts)
