Difference between revisions of "TF EIMLab1 Writeup"
| (25 intermediate revisions by 2 users not shown) | |||
| Line 15: | Line 15: | ||
{| border="3" cellpadding="20" cellspacing="0" | {| border="3" cellpadding="20" cellspacing="0" | ||
| − | |Variable ||Measured Value | + | |Variable ||Measured Value |
|- | |- | ||
| − | | <math>V_A </math> || | + | | <math>V_A </math> || 20 Volts |
|- | |- | ||
| − | | <math>R_1</math> || | + | | <math>R_1</math> || 902 <math>\Omega</math> |
|- | |- | ||
| − | | <math>R_2</math> || | + | | <math>R_2</math> || 10.2 <math>\Omega</math> |
|- | |- | ||
| − | | <math>R_3</math> || | + | | <math>R_3</math> || 10.6 <math>\Omega</math> |
|} | |} | ||
| Line 32: | Line 32: | ||
a.) Predict the value of <math>V_B</math> | a.) Predict the value of <math>V_B</math> | ||
| + | |||
| + | <math>V_A - I_1R_1 = V_b </math> | ||
| + | |||
| + | I_1 =? | ||
| + | |||
| + | Kirchoff's Loop theorem (Voltage Law) | ||
| + | |||
| + | <math>V_A -I_1(R_1+R_{tot}) = 0</math> where R<math>_{tot}</math> =resistance for <math>R_2</math> and <math>R_3</math> in series. | ||
| + | |||
| + | <math>R_{tot} = \frac{1}{\frac{1}{R_2} + \frac{1}{R_3}} = 5.2 \Omega</math> | ||
| + | |||
| + | <math>I_1 = \frac{V_A}{R_1+R_{tot}} = \frac{ 20 \mbox{Volts}}{902 \Omega + 5.2 \Omega} = 22 \mbox{mA}</math> | ||
| + | |||
| + | |||
| + | <math>V_b = V_A - I_1 R_1 = 20 - 0.022 \times 902 = 156</math> mV | ||
b.) Predict the values of the three currents. | b.) Predict the values of the three currents. | ||
| + | |||
| + | <math>I_1 = I_2 + I_3</math> | ||
| + | |||
| + | I<math>_2 R_2 - I_3 R_3 = 0</math> | ||
| + | |||
| + | 2 equations and 2 unkowns | ||
| + | |||
| + | <math>I_3 = \frac{I_1}{\frac{R_3}{R_2} +1} = \frac{22 mV}{\frac{10.6}{10.2}+1} = 10.8</math> mA | ||
| + | |||
| + | <math>I_2 = I_1 - I_3 = 22 - 10.8 = 11.2</math> mA | ||
c.) compare your predictions and measurements by filling in the table below. | c.) compare your predictions and measurements by filling in the table below. | ||
| Line 40: | Line 65: | ||
|Variable ||Measured Value|| Predicted Value|| % Difference | |Variable ||Measured Value|| Predicted Value|| % Difference | ||
|- | |- | ||
| − | | <math>V_B</math> || || || | + | | <math>V_B</math> || 103.5 +/- 50 mV || 156 || 50% |
|- | |- | ||
| − | | <math>I_1</math> || || || | + | | <math>I_1</math> || 20.4 mA ||22 || 7% |
|- | |- | ||
| − | | <math>I_2</math> || | + | | <math>I_2</math> || 9.5 mA ||11.2 || 18% |
|- | |- | ||
| − | | <math>I_3</math> || | + | | <math>I_3</math> || 9.0 mA || 10.8|| 20% |
|} | |} | ||
| Line 52: | Line 77: | ||
Measure the internal resistance of your power source by graphing the potential difference on the x-axis and the current on the y-axis for several values of the resistance <math>R_L</math> shown in the circuit below. Begin with <math>R_L = 1k\Omega</math> and then decrease it by a factor of 5 for each subsequent measurement. You can use a volt meter to measure the current and potential difference. | Measure the internal resistance of your power source by graphing the potential difference on the x-axis and the current on the y-axis for several values of the resistance <math>R_L</math> shown in the circuit below. Begin with <math>R_L = 1k\Omega</math> and then decrease it by a factor of 5 for each subsequent measurement. You can use a volt meter to measure the current and potential difference. | ||
| + | |||
| + | |||
| + | [[File:TF_EIM_Lab1a_fig.png | 200px]][[File:TF_EIM_Lab1b_fig.png | 350px]] | ||
| + | |||
| + | |||
| + | {| border="3" cellpadding="20" cellspacing="0" | ||
| + | | R_{Load} (<math>\Omega</math>) || V (Volts)|| I (mA) | ||
| + | |- | ||
| + | | 10|| 1.42 <math>\pm</math> 0.06 || 118 <math>\pm</math> 3 | ||
| + | |- | ||
| + | | 93|| 1.55<math> \pm</math> 0.01 || 16.15 <math>\pm</math> 0.05 | ||
| + | |- | ||
| + | |990 || 1.575 <math>\pm</math> 0.005 || 1.54 <math>\pm</math> 0.04 | ||
| + | |- | ||
| + | |10110 || 1.579 <math>\pm</math> 0.005 || 0.146 <math>\pm</math> 0.005 | ||
| + | |- | ||
| + | | 15060|| 1.579 <math>\pm</math> 0.005 || 0.101 <math>\pm</math> 0.003 | ||
| + | |} | ||
| + | |||
| + | <math>V_A - V_B = IR_{Load} = V_{bb} - I R_{int}</math> | ||
| + | |||
| + | <math>(V_A - V_B) = - R_{int} I + V_{bb}</math> | ||
| + | |||
| + | <math>y = mx+b \Rightarrow R_{int} =</math> slope of V-vs- I plot | ||
| + | |||
| + | [[File:Lab1b_TF_EIM.png | 200 px]] | ||
| + | |||
| + | ;Since the current is in mA the resistance must be in kOhms in order to get volts. | ||
| + | |||
| + | :<math>R_{int} = 1.33 \pm 0.04 \Omega</math> | ||
| + | |||
| + | Book suggests 1.5 flashlight battery could have an internal resistance of 0.5 Ohms. | ||
| + | |||
| + | Below I set R= 95 <math>\Omega</math> and changed V | ||
| + | |||
| + | {| border="3" cellpadding="20" cellspacing="0" | ||
| + | | V (mv) || I (mA) | ||
| + | |- | ||
| + | | 126.1 || 0.79 | ||
| + | |- | ||
| + | | 300 || 2.64 | ||
| + | |- | ||
| + | | 500|| 4.62 | ||
| + | |- | ||
| + | | 1000|| 9.29 | ||
| + | |- | ||
| + | | 2000|| 18.78 | ||
| + | |- | ||
| + | | 3000|| 30.4 | ||
| + | |} | ||
| + | |||
| + | Now lets try to fix V and change R | ||
| + | |||
| + | |||
| + | |||
| + | [[File:Lab1a_TF_EIM.png | 200 px]] | ||
=Questions (20 pnts)= | =Questions (20 pnts)= | ||
Latest revision as of 17:40, 20 January 2015
Kirchoff's Law (50 pnts)
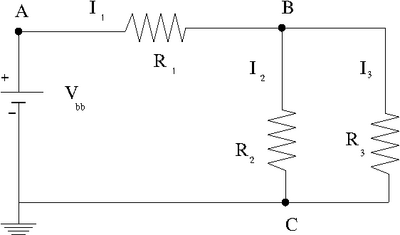
Construct the circuit below
Enter the values of the DC voltage and Resisters that you used.
Use a voltmeter to measure the potential difference and resistances.
| Variable | Measured Value |
| 20 Volts | |
| 902 | |
| 10.2 | |
| 10.6 |
Enter the measured and predicted quantities in the table below
Given and the values of all resistors, use Kirchoff's laws to predict
a.) Predict the value of
I_1 =?
Kirchoff's Loop theorem (Voltage Law)
where R =resistance for and in series.
mV
b.) Predict the values of the three currents.
I
2 equations and 2 unkowns
mA
mA
c.) compare your predictions and measurements by filling in the table below.
| Variable | Measured Value | Predicted Value | % Difference |
| 103.5 +/- 50 mV | 156 | 50% | |
| 20.4 mA | 22 | 7% | |
| 9.5 mA | 11.2 | 18% | |
| 9.0 mA | 10.8 | 20% |
Internal resistance (30 pnts)
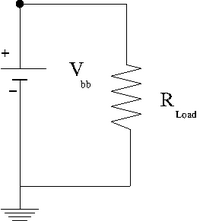
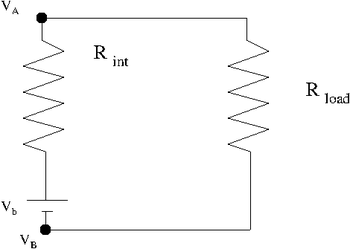
Measure the internal resistance of your power source by graphing the potential difference on the x-axis and the current on the y-axis for several values of the resistance shown in the circuit below. Begin with and then decrease it by a factor of 5 for each subsequent measurement. You can use a volt meter to measure the current and potential difference.
| R_{Load} () | V (Volts) | I (mA) |
| 10 | 1.42 0.06 | 118 3 |
| 93 | 1.55 0.01 | 16.15 0.05 |
| 990 | 1.575 0.005 | 1.54 0.04 |
| 10110 | 1.579 0.005 | 0.146 0.005 |
| 15060 | 1.579 0.005 | 0.101 0.003 |
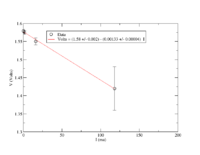
slope of V-vs- I plot
- Since the current is in mA the resistance must be in kOhms in order to get volts.
Book suggests 1.5 flashlight battery could have an internal resistance of 0.5 Ohms.
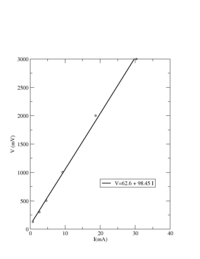
Below I set R= 95 and changed V
| V (mv) | I (mA) |
| 126.1 | 0.79 |
| 300 | 2.64 |
| 500 | 4.62 |
| 1000 | 9.29 |
| 2000 | 18.78 |
| 3000 | 30.4 |
Now lets try to fix V and change R
Questions (20 pnts)
- What conservation law is involved in Kirchoff's Loop Theorem?
- What does the slope in the internal resistance plot above represent?
