Difference between revisions of "HRRL radiation footprint simulations"
| (370 intermediate revisions by the same user not shown) | |||
| Line 1: | Line 1: | ||
| + | |||
| + | |||
| + | = Simulation report= | ||
| + | |||
| + | |||
| + | The development of a positron source for JLab using the HRRL requires moving the HRRL to a new location in order to have sufficient room to construct an achomat beam line. Three measurements of the radiation footprint have been done and used to estimate the radiological impact of moving the HRRL. The simulation package Geant4 was used to estimate the radiation footprint that will result if the HRRL accelerator cavity is moved closer to the accelerator room entrance. The simulation indicates that moving HRRL to the proposed position will increase the radiation at the doorway to the accelerator room by a factor of 8.6. The simulation also estimates that a 1.2 cm thick lead shield around the accelerator will reduce the radiation at the door way to its original levels. If we use this prediction to extrapolate the radiation measurements made, then one can estimate safe operation by restricting the HRRL rep rate to below 400 Hz. This restriction can | ||
| + | be changed based on radiation footprint measurements made after the HRRL is moved. We request amending the current operating license for the HRRL to restrict it's repetition rate to less than 400 Hz so it may be moved to the proposed location. | ||
| + | |||
| + | ==Proposed change to Accelerator== | ||
| + | |||
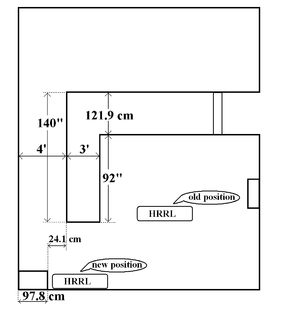
| + | We propose moving the HRRL accelerator cavity from its current location in the center of the room to a corner wall in order to construct a chromatic beam line which will be used in the develop of a positron source for JLab. Below is a picture illustrating the current location of the HRRL cavity and the proposed new location. | ||
| + | |||
| + | {| border="1" |cellpadding="20" cellspacing="0 | ||
| + | |- | ||
| + | | [[Image:HRRL_Move_Plan.jpg|300px|thumb|Figure 1. The proposed new location for the HRRL accelerator.]] | ||
| + | |}<br> | ||
| + | |||
| + | |||
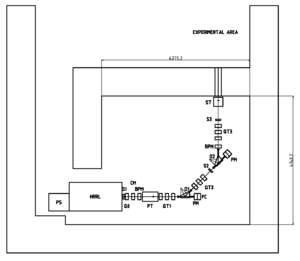
| + | This new position will allow us to install enough quads and dipoles to create an achromatic beam of electrons or positrons. A Tungsten converter will be place close to the HRRL cavity and be used to generate positrons. A setup of two quads will be used before the Tungsten converter in order to focus the incident electron beam on the target. A Faraday Cup is place on the zero port line to measure the beam current and optimize beam transmission prior to inserting a Tungsten converter. A system of 3 quads will be used to collect positrons escaping from the downstream side of the Tungsten converter. The first dipole will separate positrons from the primary electron beam. The remaining beam optics are shown in the beam line drawing below. | ||
| + | |||
| + | |||
| + | {| border="1" |cellpadding="20" cellspacing="0 | ||
| + | |- | ||
| + | | [[Image:Postron_Gun_Beamlin_Sesign.png|300px|thumb|Figure 2. The proposed new HRRL accelerator beamline.]] | ||
| + | |}<br> | ||
| + | |||
| + | == Radiation Measurements== | ||
| + | |||
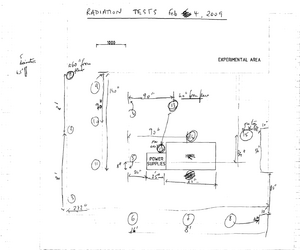
| + | Several measurements of the HRRL's radiation footprint have been done. The first measurements were performed by M. Balzer and G. Stancari on Feb. 4, 2009 using OSL dosimeters at 15 locations around the accelerator. Two additional measurements were done on May 17, 2010 and July 28, 2010 using Ludlum's ion chamber radiation monitors Model 375/9. The first measurements using OSL dosimeters established general map of the radiation surrounding the HRRL accelerator. The second set of measurements focused on two locations and looked at how well the radiation scales with the accelerator beam properties in order to establish a guide for extrapolating the dose after moving the cavity to the new location. The largest dose rate was observed on a wall at a spot which was at 90 degrees from the center of the accelerator (location 7 shown below). The dose dropped as you moved away from the central region of the accelerator. The OSL measurement at a spot symmetric to that location (location 13) reported a dose that was about an order of magnitude smaller. The second set of measurements focused on location 13 as it will be located in the doorway of the accelerator room after the HRRL is repositioned. | ||
| + | |||
| + | |||
| + | |||
| + | === Radiological map using OSL dosimeters=== | ||
| + | |||
| + | On February 4th, 2009, M. Balzer and G. Stancari used OSL dosimeters to measure the dose at several locations around the HRRL accelerator. The measurements made by 5 dosimeters placed at each of the 15 locations was used to determine the average dose and RMS appearing in the table below. Locations 7 and 15 had the highest dose rates measured of 73 rad/hr and 62 rad/hr respectively. One may have expected that the the downstream location would have a high dose rate. The higher dose rate at location 7 is a little surprising but might be explained by the presence of a collimator in the center of the HRRL accelerator which collimates accelerated electrons before they exit the HRRL. Measurements at locations 11 and 13 were chosen because a measurement at location 13 may be used as a first estimate of the dose at location 11 after the HRRL is moved. | ||
| + | |||
| + | The detectors located at positions marked 11 and 13 measured a dose of 164 mrad/hr and 5828 mrad/hr respectively when the accelerator was running with 15 MeV electron beam energy, 20 mA peak current, 1 kHz repetition rate, and 30 ns pulse width. | ||
| + | |||
| + | |||
| + | {| border="1" |cellpadding="20" cellspacing="0 | ||
| + | |- | ||
| + | | [[Image:Dosimeter-locations-20090204.png|300px|thumb|Figure 3. Radiation dose measurements of the HRRL using OSL dosimeters.]] | ||
| + | || | ||
| + | {| | ||
| + | |- align=right | ||
| + | ! width="150pt" | Location !! width="150pt" | Dose rate !! width="150pt" | RMS spread | ||
| + | |- align=right | ||
| + | ! !! (mrad/hr) !! (mrad/hr) | ||
| + | |- align=right | ||
| + | | 1 || 9 || 4 | ||
| + | |- align=right | ||
| + | | 2 || 396 || 57 | ||
| + | |- align=right | ||
| + | | 3 || 7940 || 204 | ||
| + | |- align=right | ||
| + | | 4 || 2831 || 117 | ||
| + | |- align=right | ||
| + | | 5 || 4408 || 373 | ||
| + | |- align=right | ||
| + | | 6 || 29339 || 3332 | ||
| + | |- align=right | ||
| + | | 7 || 72517 || 687 | ||
| + | |- align=right | ||
| + | | 8 || 36507 || 4746 | ||
| + | |- align=right | ||
| + | | 9 || 5 || 5 | ||
| + | |- align=right | ||
| + | |10 || 37 || 4 | ||
| + | |- align=right | ||
| + | |11 || 164 || 40 | ||
| + | |- align=right | ||
| + | |12 || 2734 || 313 | ||
| + | |- align=right | ||
| + | |13 || 5828 || 120 | ||
| + | |- align=right | ||
| + | |14 || 7793 || 2579 | ||
| + | |- align=right | ||
| + | |15 || 62431 || 27155 | ||
| + | |} | ||
| + | |||
| + | |}<br> | ||
| + | |||
| + | ===Lludlum measurements=== | ||
| + | |||
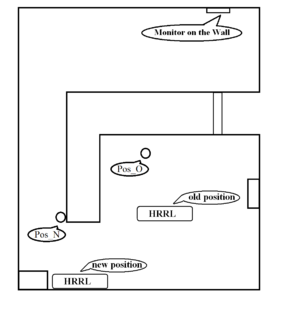
| + | The radiation dose was measured at the three locations shown in Figure 4 while the HRRL was operated at the "old" position denoted in the Figure. The measurements were made using the 2 Gamma Area Monitor model 45-9 radiation monitors from Lludlum. One monitor is mounted in the upper downstream corner of the experimental cell and the other in the accelerator room. The ion chamber in the accelerator room was moved between the two positions, Pos_O and Pos_N, shown in Figure 4. | ||
| + | |||
| + | {| border="1" |cellpadding="20" cellspacing="0 | ||
| + | |- | ||
| + | | [[File:New_Old_Relative_Pos_Detector.jpg |300px|thumb|Figure 4. Illustration of cavity locations before, after shifting and monitors locations.]] | ||
| + | |}<br> | ||
| + | |||
| + | One set of measurements was used to correlate the dose rate observed by the radiation monitors located in the experimental cell side to the dose rate measured at the entrance to the HRRL accelerator room, Pos_N. The monitor on the experimental cell wall is set to shutdown the accelerator if the monitor measures more than 2 mrad/hr when electrons are delivered to the experimental cell, 5 mrad/hr when photons are delivered. The measurements are shown in the table below. The set of measurements made in May were done when the HRRl had a beamline sending photons into the experimental cell while the measurements in July were done during emittance measurements using a straight beamline dumping the electron into a shielded Faraday cup. Changing the acclerator beam line from one with a 90 degree bend to one that is straight decreased the dose measured in the experimental hall and increased the dose in the accelerator cell. The measurements made in May will be used to estimate the correlation between the dose measured at the exit of the accelerator cell to the monitor located in the experimental cell. | ||
| + | |||
| + | {| border="3" cellpadding="5" cellspacing="0" | ||
| + | |- | ||
| + | || Run|| Energy of beam (MeV)||Peak current of beam (mA)|| Rap rate (Hz) || Experimental Cell Channel 17 (mrad), || Accelerator cell Channel 16, (mrad) || Ratio: Chan16/Chan17 | ||
| + | |||
| + | |- | ||
| + | || May || 16 ||47.6 || 40 || 2.3 || 20.5 <math>\pm</math> 1.0 || 8.9 | ||
| + | |- | ||
| + | || May || 16 || 33.2 || 40 || 1.75 <math>\pm</math> 0.5 || 14.0 <math>\pm</math> 0.5 || 8.0 | ||
| + | |||
| + | |- | ||
| + | || July || 16 || 40 || 40 || 0.1 || 30<math>\pm</math>2||300 | ||
| + | |- | ||
| + | | July || 16 || 40 || 70 || 0.2 || 53<math>\pm</math> 2||265 | ||
| + | |||
| + | |- | ||
| + | |} | ||
| + | |||
| + | |||
| + | The dose at location Pos_O in Figure 4 was measured for several accelerator beam current setting. The measured dose at Pos_O was assumed to transfer to Pos_N once the accelerator is moved. This assumption may be an underestimate given that the wall was observed to be a hot spot. Despite this possiblity, we will estimate the dose one can expect on the experimental cell radiation monitor assuming that the dose measured at Pos_O is what we will measure at Pos_N after moving the HRRL. Figure 5 represents an estimate of the dose which will be observed in the experimental cell using the dose measured at Pos_O when HRRL is run at its maximum electron energy of 16 MeV and at a peak current of 40 mA with a FWHM of 150 ns. Figure 5 suggests the HRRL may be safely operated if we restrict the peak current to 40 mA and the repetition rate to less that 400 Hz. If you assume that the location with the highest radiation level moves to the doorway, then we should restrict the HRRL to a factor of 10 less current/rep rate until a radiation survey is done. | ||
| + | |||
| + | |||
| + | {| border="1" |cellpadding="20" cellspacing="0 | ||
| + | |- | ||
| + | | [[File:Mon_Dose_vs_HRRLNewPos.png | 400 px|thumb|Figure 5. Experimental cell estimated cose rate as a function of the HRRL's repetition rate (for 16 MeV e- beam, 40 mA peak current, 150 ns (FWHM) pulse width).]] | ||
| + | |}<br> | ||
| + | |||
| + | |||
| + | |||
| + | == Simulation results== | ||
| + | |||
| + | A simulation of the HRRL with a Tungsten target was done to determine how much shielding would be required to restore the accelerator to its original footprint as seen at the doorway to the accelerator cell. A Tungsten target was put in place to provide a representation of the accelerator configuration which will be used for the development of the JLab positron source. The simulation suggests that the original radiological footprint can be restored if a 1.2 cm thick lead sheet placed around the accelerator and tungsten target. Below is a description of the simulation. | ||
| + | |||
| + | |||
| + | === Geometry definitions=== | ||
| + | |||
| + | A screen shot of the simulations accelerator cell volume is shown in Figure 6. Standard concrete was used to define the wall material. The event shown represents a 10 MeV electron directed towards wall #2 which intersects a 2mm thick Tungsten target. In this particular event, several photons and 2 charged particles escape the Tungsten converter. Figure 7 illustrates the region of interest, the doorway. All particles which intersected the doorway were recorded for analysis. A coordinate system is defined to have its origin located at the lower left corner of the doorway as seen from outside the accelerator cell. | ||
| + | |||
| + | Sadiq: Is wall #8 in Figure 7 the same as wall #1 in Figure 6? If so relabel wall #8 to be wall #1. | ||
| + | |||
| + | Dr. Forest: Wall#8 is the doorway. Wall#1 is the wall next to doorway. They are different. Doorway was named as wall#8 in simulation. | ||
| + | |||
| + | |||
| + | Should the wall #8 label appear on the blue surface? | ||
| + | |||
| + | |||
| + | {| border="1" |cellpadding="20" cellspacing="0 | ||
| + | |- | ||
| + | | [[Image:hrrl_room_volumes_defined_for_radiation_report_numbered.jpg | 300 px|thumb|Figure 6. Volumes' definitions and coordinate system.]] | ||
| + | | [[Image:wall8_dz_doorway.jpg | 300 px |thumb|Figure 7. Definition of the doorway.]] | ||
| + | |}<br> | ||
| + | |||
| + | === Energy deposited=== | ||
| + | Fig. 8 and Fig. 9 show number of photons and electrons deposited in the doorway before and after shifting the cavity respectively. These Figures show that at new location we will have a hot spot at the corner of doorway around 1 m height. The number of particles (electrons and photons) increased about factor of 10 at new location. | ||
| + | |||
| + | |||
| + | {| border="1" |cellpadding="20" cellspacing="0 | ||
| + | |- | ||
| + | | [[Image:Old_xy.jpg |300px|thumb|Figure 8. Number of particles on the doorway (electrons and photons) before shifting the cavity.]] | ||
| + | | [[Image:New_xy.jpg |300px|thumb|Figure 9. Number of particles on the doorway (electrons and photons) after shifting the cavity.]] | ||
| + | |}<br> | ||
| + | |||
| + | |||
| + | |||
| + | Fig. 10 and Fig. 11 are energy profiles on the doorway before (blue) and after (red) shifting the cavity to new location. The radiation increased about factor of 10 at new location. | ||
| + | |||
| + | |||
| + | {| border="1" |cellpadding="20" cellspacing="0 | ||
| + | |- | ||
| + | | [[Image:Photon_xy.jpg |300px|thumb|Figure 10. Photon energy deposited on the doorway before (blue line) and after (red line) shifting the cavity.]] | ||
| + | | [[Image:Electron_xy.jpg |300px|thumb|Figure 11. Electron energy deposited on the doorway before (blue line) and after red line) shifting the cavity.]] | ||
| + | |}<br> | ||
| + | |||
| + | === Shielding The Radiation === | ||
| + | |||
| + | Cavity was shifted to new location to study the radiation and shielding effect on radiation. We used cylindrical shielding around the cavity and one cap at the upstream end of the cavity. Shielding was increased by the increment of 6 mm. At 2 increments, radiation was reduced to same level as before shifting. | ||
| + | |||
| + | |||
| + | {| border="1" |cellpadding="20" cellspacing="0 | ||
| + | |- | ||
| + | |Increment || <math> E_{\gamma}~MeV </math> || <math> E_{e}~(MeV) </math>|| <math> E_{tot}~MeV</math> || <math> E_{tot}~per~electron~MeV</math> || | ||
| + | |- | ||
| + | | 0 (before move) || 12658.4 || 8493.66 || 21152.1 || 0.00126584 || | ||
| + | |- | ||
| + | | 0 (after move) || 26394.9 || 50108.1 || 76503.1 || 0.00263949 || | ||
| + | |- | ||
| + | | 1 || 17819.1 || 430.89 || 18250 || 0.00178191 || | ||
| + | |- | ||
| + | | 2 || 10600.8 || 293.753 || 10894.5 || 0.00106008 || | ||
| + | |- | ||
| + | |} | ||
| + | |||
| + | sadiq: insert the correct table from below. | ||
| + | |||
| + | ==Conclusion== | ||
| + | |||
| + | A 1.2 cm (1/2 inch) thick layer of Pb ( 2 , 1/4 inch thick lead sheets) around the new accelerator cavity's position will restore the radiation footprint of the original accelerator's position. | ||
| + | |||
| + | We did radiation measurement to estimate the dose rate on the monitor on the experimental cell side after shifting the cavity to new location. We conclude that, at new location for cavity, for condition: electron beam energy of 16 MeV, beam peak current of 40 mA, pulse width full width half max of 150 ns, it is safe to run up to 900 Hz repetition rate. | ||
| + | |||
| + | =Simulation work= | ||
| + | |||
Design a simulation to determine radiation footprint in HRRL cell. | Design a simulation to determine radiation footprint in HRRL cell. | ||
| Line 86: | Line 280: | ||
what is the thicknes of the walls below. | what is the thicknes of the walls below. | ||
| + | |||
| + | No dirt inside walls. | ||
| + | |||
| + | Wall Number 3, 4 and 5 are 1 feet thick. | ||
| + | |||
| + | Ceiling is 5 feet thick. Above that is 1st floor metal structure. | ||
[[File:HRRL_Geom_by_sadiq.jpg | 600 px]] | [[File:HRRL_Geom_by_sadiq.jpg | 600 px]] | ||
| Line 93: | Line 293: | ||
===HRRL Room Top view=== | ===HRRL Room Top view=== | ||
| − | [[File:hrrl_room_walls_numbered.jpg]] | + | [[File:hrrl_room_walls_numbered.jpg | 200 px]] |
| + | |||
| + | Wall is not real wall. Its material is air, this wall is just used as detector to detect particles and photons. | ||
| + | |||
| + | The origin of the coordinate system moved the the other corner of the wall#1 as shown one of the figure in below. | ||
| + | |||
| + | |||
| + | [[File:hrrl_room_wall8.jpg | 200 px]] | ||
| − | |||
| + | [[File:hrrl_room_top.jpg | 200 px]] | ||
===HRRL Room 45 Degree View=== | ===HRRL Room 45 Degree View=== | ||
| − | [[File:hrrl_room_45deg.jpg]] | + | [[File:hrrl_room_45deg.jpg | 200 px]] |
| − | |||
===HRRL Room Side view=== | ===HRRL Room Side view=== | ||
| − | [[File:hrrl_room_side.jpg]] | + | [[File:hrrl_room_side.jpg | 200 px]] |
| − | |||
===HRRL Electron Source and Tungsten Target 45 Degree View=== | ===HRRL Electron Source and Tungsten Target 45 Degree View=== | ||
| − | [[File:hrrl_beam_and_target_45deg.jpg]] | + | [[File:hrrl_beam_and_target_45deg.jpg | 200 px]] |
===HRRL Electron Source and Tungsten Target Top View=== | ===HRRL Electron Source and Tungsten Target Top View=== | ||
| − | [[File:hrrl_beam_and_target_top.jpg]] | + | [[File:hrrl_beam_and_target_top.jpg| 200 px]] |
===HRRL New Electron Source=== | ===HRRL New Electron Source=== | ||
| − | [[File:New_e-_Source_Position.jpg]] | + | [[File:New_e-_Source_Position.jpg | 200 px]] |
== Geant4 Codes == | == Geant4 Codes == | ||
| − | |||
| − | [[File: | + | === GPS e- Source === |
| + | /gps/particle e- | ||
| + | |||
| + | /gps/energy 10. MeV | ||
| + | |||
| + | /gps/pos/type Plane | ||
| + | |||
| + | /gps/pos/shape Circle | ||
| + | |||
| + | /gps/pos/radius 0.6 cm | ||
| + | |||
| + | |||
| + | /gps/pos/sigma_r 3 mm | ||
| + | |||
| + | |||
| + | /gps/pos/sigma_x 3 mm | ||
| + | |||
| + | /gps/pos/sigma_y 3 mm | ||
| + | |||
| + | |||
| + | Old Position, -Z direction: | ||
| + | |||
| + | /gps/pos/centre 380 101.6 -93.68 cm | ||
| + | |||
| + | |||
| + | New Postion, X direction: | ||
| + | |||
| + | /gps/pos/centre 66.5 101.6 93.93 cm | ||
| + | |||
| + | /gps/direction 1 0 0 | ||
| + | |||
| + | === Physics List === | ||
| + | |||
| + | |||
| + | [[File:Physics_List.txt]] | ||
| + | |||
| + | |||
| + | |||
| + | 10 MeV Gamma hit 2 meter D2O target to show neutron from disintegrated deuterium. | ||
| + | |||
| + | Yellow: neutron | ||
| + | |||
| + | Red: electron | ||
| + | |||
| + | Gray: gamma | ||
| + | |||
| + | <pre> | ||
| + | It is better to show the tracking output in | ||
| + | order to see the physics process and particles created. | ||
| + | </pre> | ||
| + | |||
| + | [[File:Neutron.jpg | 200 px]] | ||
| + | |||
| + | === Dectector Construction === | ||
| + | |||
| + | |||
| + | |||
| + | [[File: Detector_Construction.txt]] | ||
| + | |||
| + | |||
| + | |||
| + | == Electron and photon interactions with the target and the walls == | ||
| + | |||
| + | === Electron in Target === | ||
| + | <pre> | ||
| + | ********************************************************************************************************* | ||
| + | * G4Track Information: Particle = e-, Track ID = 8, Parent ID = 2 | ||
| + | ********************************************************************************************************* | ||
| + | |||
| + | |||
| + | #Step# X Y Z KineE dEStep StepLeng TrakLeng Volume Process | ||
| + | 1 1.66401 m 1.01473 m 93.5217 cm 0 eV 147.944 keV29.1396 um 29.1396 um Target eIoni | ||
| + | </pre> | ||
| + | |||
| + | === Electron go into Wall3 === | ||
| + | <pre> | ||
| + | ********************************************************************************************************* | ||
| + | * G4Track Information: Particle = e-, Track ID = 1, Parent ID = 0 | ||
| + | ********************************************************************************************************* | ||
| + | |||
| + | |||
| + | #Step# X Y Z KineE dEStep StepLeng TrakLeng Volume Process | ||
| + | 1 1.64085 m 1.03791 m 93.998 cm 9.76788 MeV198.526 keV97.4316 cm 97.4316 cm World eIoni | ||
| + | |||
| + | #Step# X Y Z KineE dEStep StepLeng TrakLeng Volume Process | ||
| + | 2 1.67863 m 1.03716 m 93.7509 cm 9.73665 MeV7.70861 keV3.7869 cm 1.01218 m World eIoni | ||
| + | |||
| + | #Step# X Y Z KineE dEStep StepLeng TrakLeng Volume Process | ||
| + | 3 2.38158 m 1.04721 m 88.1765 cm 9.53633 MeV 137.3 keV70.5761 cm 1.71795 m World eIoni | ||
| + | |||
| + | #Step# X Y Z KineE dEStep StepLeng TrakLeng Volume Process | ||
| + | 4 4.8856 m 1.06243 m 1.22615 m 9.04023 MeV496.099 keV2.5446 m 4.26254 m World Transportation | ||
| + | |||
| + | #Step# X Y Z KineE dEStep StepLeng TrakLeng Volume Process | ||
| + | 5 5.194 m 1.034 m 1.28563 m 8.91744 MeV122.789 keV31.6299 cm 4.57884 m Wall3 Transportation | ||
| + | |||
| + | #Step# X Y Z KineE dEStep StepLeng TrakLeng Volume Process | ||
| + | 6 7.5 m 95.4945 cm 1.63263 m 8.49278 MeV424.668 keV2.34972 m 6.92856 m OutOfWorld Transportation | ||
| + | </pre> | ||
| + | |||
| + | === Gamma go into Wall3 === | ||
| + | <pre> | ||
| + | ********************************************************************************************************* | ||
| + | * G4Track Information: Particle = gamma, Track ID = 3, Parent ID = 1 | ||
| + | ********************************************************************************************************* | ||
| + | |||
| + | |||
| + | #Step# X Y Z KineE dEStep StepLeng TrakLeng Volume Process | ||
| + | 1 4.8856 m 98.0398 cm 24.6372 cm 78.0395 keV 0 eV 3.08802 m 3.08802 m World Transportation | ||
| + | |||
| + | #Step# X Y Z KineE dEStep StepLeng TrakLeng Volume Process | ||
| + | 2 5.194 m 97.6205 cm 17.6225 cm 78.0395 keV 0 eV 31.6305 cm 3.40432 m Wall3 Transportation | ||
| + | |||
| + | #Step# X Y Z KineE dEStep StepLeng TrakLeng Volume Process | ||
| + | 3 5.97662 m 96.5562 cm -1.78528 mm 0 eV 403 eV 80.2682 cm 4.207 m World phot | ||
| + | |||
| + | </pre> | ||
| + | |||
| + | === Gamma go into Wall4 === | ||
| + | <pre> | ||
| + | |||
| + | ********************************************************************************************************* | ||
| + | * G4Track Information: Particle = gamma, Track ID = 2, Parent ID = 1 | ||
| + | ********************************************************************************************************* | ||
| + | |||
| + | |||
| + | #Step# X Y Z KineE dEStep StepLeng TrakLeng Volume Process | ||
| + | 1 2.98112 m 1.42043 m 1.8796 m 92.4831 keV 0 eV 1.72044 m 1.72044 m World Transportation | ||
| + | |||
| + | #Step# X Y Z KineE dEStep StepLeng TrakLeng Volume Process | ||
| + | 2 3.42618 m 1.53616 m 2.1844 m 92.4831 keV 0 eV 55.1695 cm 2.27214 m Wall4 Transportation | ||
| + | |||
| + | #Step# X Y Z KineE dEStep StepLeng TrakLeng Volume Process | ||
| + | 3 7.5 m 2.59551 m 4.97442 m 92.4831 keV 0 eV 5.05 m 7.32214 m OutOfWorld Transportation | ||
| + | |||
| + | </pre> | ||
| + | |||
| + | [[File: Interaction.txt]] | ||
| + | |||
| + | |||
| + | |||
| + | |||
| + | =Radiation Ratio estimate for Wall 8 2/25/10= | ||
| + | |||
| + | A GEANT4 simulation was used to compare the radiation footprint of the HRRL before and after its relocation. The ratio of radiation incident at the exit of the accelerator room (identified as Wall #8 in the pictures below) was estimated by tracking electrons, photons, and neutrons. | ||
| + | |||
| + | The red line in the figure below indicates the interaction point of an electron from the HRRL accelerator with a Tungsten radiator used to convert the incident electron into e+e- pairs. The proposed location for the HRRL is to move it just below wall #6 and in front of the "Z" axis label.. | ||
| + | |||
| + | |||
| + | [[File:hrrl_room_walls_numbered.jpg | 200 px]] | ||
| + | |||
| + | The drawing below identifies the location of Wall #8. Wall 8 is composed of air, this wall is just used as detector to detect particles and photons. | ||
| + | |||
| + | |||
| + | [[File:hrrl_room_wall8.jpg | 200 px]] | ||
| + | |||
| + | |||
| + | ==Number of particles== | ||
| + | |||
| + | Simulation results by number of particles for 10 million run. | ||
| + | |||
| + | {| border="1" |cellpadding="20" cellspacing="0 | ||
| + | |- | ||
| + | |Particle || Numbers at Old Position [http://inca.iac.isu.edu/~setiniyaz/hrrl_rad_test/old_pos/Gamma/old_pos/] || Numbers at New Position [http://inca.iac.isu.edu/~setiniyaz/hrrl_rad_test/new_pos/Gamma/new_pos/]|| Ration (new:old) | ||
| + | |- | ||
| + | | e- || 697728 || 2397851 || 3.43665583 | ||
| + | |- | ||
| + | | gamma ||375260 || 779381 || 0.481484665 | ||
| + | |} | ||
| + | |||
| + | G4 code for registering particles in wall8. Daughter particles are also registered as long as they are in wall8. | ||
| + | <pre> | ||
| + | if( fTrack->GetVolume()->GetName() =="Wall8" && (fTrack->GetDefinition()->GetPDGEncoding()==22 ||fTrack->GetDefinition()->GetPDGEncoding()==11 ||fTrack->GetDefinition()->GetPDGEncoding()==2212 ||fTrack->GetDefinition()->GetPDGEncoding()==2112 )) | ||
| + | { | ||
| + | if (fTrack->GetDefinition()->GetPDGEncoding()==22 ) //if gamma | ||
| + | { ig++; | ||
| + | outfile | ||
| + | << ig << " 22 " | ||
| + | <<fTrack->GetKineticEnergy() << " " | ||
| + | << fTrack->GetPosition().x()<< " " | ||
| + | << fTrack->GetPosition().y()<< " " | ||
| + | << fTrack->GetPosition().z()<< " " | ||
| + | << fTrack->GetMomentum().x() << " " | ||
| + | << fTrack->GetMomentum().y() << " " | ||
| + | << fTrack->GetMomentum().z() << " "<< G4endl;} | ||
| + | if (fTrack->GetDefinition()->GetPDGEncoding()==11 ) //if e- | ||
| + | {ie++; | ||
| + | outfile | ||
| + | << ie << " 11 " | ||
| + | <<fTrack->GetKineticEnergy() << " " | ||
| + | << fTrack->GetPosition().x()<< " " | ||
| + | << fTrack->GetPosition().y()<< " " | ||
| + | << fTrack->GetPosition().z()<< " " | ||
| + | << fTrack->GetMomentum().x() << " " | ||
| + | << fTrack->GetMomentum().y() << " " | ||
| + | << fTrack->GetMomentum().z() << " "<< G4endl;} | ||
| + | if (fTrack->GetDefinition()->GetPDGEncoding()==2212 ) //if proton | ||
| + | {ip++; | ||
| + | outfile | ||
| + | << ip << " 2212 " | ||
| + | <<fTrack->GetKineticEnergy() << " " | ||
| + | << fTrack->GetPosition().x()<< " " | ||
| + | << fTrack->GetPosition().y()<< " " | ||
| + | << fTrack->GetPosition().z()<< " " | ||
| + | << fTrack->GetMomentum().x() << " " | ||
| + | << fTrack->GetMomentum().y() << " " | ||
| + | << fTrack->GetMomentum().z() << " "<< G4endl;} | ||
| + | if (fTrack->GetDefinition()->GetPDGEncoding()==2112 ) //if neutron | ||
| + | {in++; | ||
| + | outfile | ||
| + | << in << " 2112 " | ||
| + | <<fTrack->GetKineticEnergy() << " " | ||
| + | << fTrack->GetPosition().x()<< " " | ||
| + | << fTrack->GetPosition().y()<< " " | ||
| + | << fTrack->GetPosition().z()<< " " | ||
| + | << fTrack->GetMomentum().x() << " " | ||
| + | << fTrack->GetMomentum().y() << " " | ||
| + | << fTrack->GetMomentum().z() << " "<< G4endl;} | ||
| + | } | ||
| + | |||
| + | </pre> | ||
| + | |||
| + | |||
| + | |||
| + | |||
| + | |||
| + | == Energy profile == | ||
| + | |||
| + | The figures below illustrate the energy spectrum of radiation entering wall #8 (described above) as predicted by a GEANT4 simulation of the HRRL accelerator room. | ||
| + | |||
| + | |||
| + | === Old Position === | ||
| + | |||
| + | ==== Electron ==== | ||
| + | |||
| + | Kinetic energy (Ek) in the unit of MeV below | ||
| + | |||
| + | [[File:Electron_Ek.jpg |300 px]] | ||
| + | [[File:Electron_Ek_0toPoint2.jpg |300 px]] | ||
| + | |||
| + | Position x in the unit of mm below | ||
| + | |||
| + | [[File:Electron_x.jpg|300 px]] | ||
| + | |||
| + | Position y | ||
| + | |||
| + | [[File:Electron_y.jpg|300 px]] | ||
| + | |||
| + | Position z | ||
| + | |||
| + | [[File:Electron_z.jpg|300 px]] | ||
| + | |||
| + | Ek vs x | ||
| + | |||
| + | [[File:Electron_Ek_vs_x.jpg|300 px]] | ||
| + | |||
| + | Ek vs y | ||
| + | |||
| + | [[File:Electron_Ek_vs_y.jpg|300 px]] | ||
| + | |||
| + | Ek vs z | ||
| + | |||
| + | [[File:Electron_Ek_vs_z.jpg|300 px]] | ||
| + | |||
| + | |||
| + | x vs y | ||
| + | |||
| + | [[File:Electron_x_vs_y.jpg|300 px]] | ||
| + | |||
| + | y vs z | ||
| + | |||
| + | [[File:Electron_y_vs_z.jpg|300 px]] | ||
| + | |||
| + | z vs x | ||
| + | |||
| + | [[File:Electron_z_vs_x.jpg|300 px]] | ||
| + | |||
| + | |||
| + | Ek(x>-915mm) | ||
| + | |||
| + | [[File:Electron_Ek_xB-915.jpg|300 px]] | ||
| + | |||
| + | Ek(2133.5mm<x<-915mm) | ||
| + | |||
| + | [[File:Electron_Ek_x-915To-2133.jpg|300 px]] | ||
| + | |||
| + | Ek(x<2133.5mm) | ||
| + | |||
| + | [[File:Electron_Ek_xS-2133.jpg|300 px]] | ||
| + | |||
| + | ====Photon==== | ||
| + | |||
| + | |||
| + | Kinetic energy (Ek) in the unit of MeV below | ||
| + | |||
| + | [[File:Gamma_Ek.jpg |300 px]] | ||
| + | |||
| + | |||
| + | Position x in the unit of mm below | ||
| + | |||
| + | [[File:Gamma_x.jpg|300 px]] | ||
| + | |||
| + | Position y | ||
| + | |||
| + | [[File:Gamma_y.jpg|300 px]] | ||
| + | |||
| + | Position z | ||
| + | |||
| + | [[File:Gamma_z.jpg|300 px]] | ||
| + | |||
| + | Ek vs x | ||
| + | |||
| + | [[File:Gamma_Ek_vs_x.jpg|300 px]] | ||
| + | |||
| + | Ek vs y | ||
| + | |||
| + | [[File:Gamma_Ek_vs_y.jpg|300 px]] | ||
| + | |||
| + | Ek vs z | ||
| + | |||
| + | [[File:Gamma_Ek_vs_z.jpg|300 px]] | ||
| + | |||
| + | |||
| + | |||
| + | x vs y | ||
| + | |||
| + | [[File:Gamma_x_vs_y.jpg|300 px]] | ||
| + | |||
| + | y vs z | ||
| + | |||
| + | [[File:Gamma_y_vs_z.jpg|300 px]] | ||
| + | |||
| + | z vs x | ||
| + | |||
| + | [[File:Gamma_z_vs_x.jpg|300 px]] | ||
| + | |||
| + | |||
| + | Ek(x>-915mm) | ||
| + | |||
| + | [[File:Gamma_Ek_xB-915.jpg|300 px]] | ||
| + | |||
| + | Ek(2133.5mm<x<-915mm) | ||
| + | |||
| + | [[File:Gamma_Ek_x-915To-2133.jpg|300 px]] | ||
| + | |||
| + | Ek(x<2133.5mm) | ||
| + | |||
| + | [[File:Gamma_Ek_xS-2133.jpg|300 px]] | ||
| + | |||
| + | ====Neutron==== | ||
| + | |||
| + | Ek vs x | ||
| + | |||
| + | [[File:Neutron_Ek_vs_x.jpg|300 px]] | ||
| + | |||
| + | |||
| + | ====Proton==== | ||
| + | No proton was seen. | ||
| + | |||
| + | |||
| + | |||
| + | |||
| + | |||
| + | |||
| + | |||
| + | |||
| + | |||
| + | |||
| + | |||
| + | |||
| + | |||
| + | |||
| + | |||
| + | |||
| + | |||
| + | |||
| + | === New Position === | ||
| + | |||
| + | ==== Electron ==== | ||
| + | |||
| + | Kinetic energy (Ek) in the unit of MeV below | ||
| + | |||
| + | [[File:Electron_Ek_New.jpg |300 px]] | ||
| + | |||
| + | [[File:Electron_Ek_0To1_New.jpg |300 px]] | ||
| + | |||
| + | Position x in the unit of mm below | ||
| + | |||
| + | [[File:Electron_x_New.jpg|300 px]] | ||
| + | |||
| + | Position y | ||
| + | |||
| + | [[File:Electron_y_New.jpg|300 px]] | ||
| + | |||
| + | Position z | ||
| + | |||
| + | [[File:Electron_z_New.jpg|300 px]] | ||
| + | |||
| + | Ek vs x | ||
| + | |||
| + | [[File:Electron_Ek_vs_x_New.jpg|300 px]] | ||
| + | |||
| + | Ek vs y | ||
| + | |||
| + | [[File:Electron_Ek_vs_y_New.jpg|300 px]] | ||
| + | |||
| + | Ek vs z | ||
| + | |||
| + | [[File:Electron_Ek_vs_z_New.jpg|300 px]] | ||
| + | |||
| + | |||
| + | x vs y | ||
| + | |||
| + | [[File:Electron_x_vs_y_New.jpg|300 px]] | ||
| + | |||
| + | y vs z | ||
| + | |||
| + | [[File:Electron_y_vs_z_New.jpg|300 px]] | ||
| + | |||
| + | z vs x | ||
| + | |||
| + | [[File:Electron_z_vs_x_New.jpg|300 px]] | ||
| + | |||
| + | |||
| + | Ek(x>-915mm) | ||
| + | |||
| + | [[File:Electron_Ek_xB-915_New.jpg|300 px]] | ||
| + | |||
| + | Ek(2133.5mm<x<-915mm) | ||
| + | |||
| + | [[File:Electron_Ek_x-915To-2133_New.jpg|300 px]] | ||
| + | |||
| + | Ek(x<2133.5mm) | ||
| + | |||
| + | [[File:Electron_Ek_xS-2133_New.jpg|300 px]] | ||
| + | |||
| + | ====Photon==== | ||
| + | |||
| + | |||
| + | Kinetic energy (Ek) in the unit of MeV below | ||
| + | |||
| + | [[File:Gamma_Ek_New.jpg |300 px]] | ||
| + | |||
| + | |||
| + | Position x in the unit of mm below | ||
| + | |||
| + | [[File:Gamma_x_New.jpg|300 px]] | ||
| + | |||
| + | Position y | ||
| + | |||
| + | [[File:Gamma_y_New.jpg|300 px]] | ||
| + | |||
| + | Position z | ||
| + | |||
| + | [[File:Gamma_z_New.jpg|300 px]] | ||
| + | |||
| + | Ek vs x | ||
| + | |||
| + | [[File:Gamma_Ek_vs_x_New.jpg|300 px]] | ||
| + | |||
| + | Ek vs y | ||
| + | |||
| + | [[File:Gamma_Ek_vs_y_New.jpg|300 px]] | ||
| + | |||
| + | Ek vs z | ||
| − | [[File: | + | [[File:Gamma_Ek_vs_z_New.jpg|300 px]] |
| − | |||
| − | |||
| + | x vs y | ||
| + | [[File:Gamma_x_vs_y_New.jpg|300 px]] | ||
| + | y vs z | ||
| + | [[File:Gamma_y_vs_z_New.jpg|300 px]] | ||
| + | z vs x | ||
| + | [[File:Gamma_z_vs_x_New.jpg|300 px]] | ||
| + | |||
| + | |||
| + | Ek(x>-915mm) | ||
| + | |||
| + | [[File:Gamma_Ek_xB-915_New.jpg|300 px]] | ||
| + | |||
| + | Ek(2133.5mm<x<-915mm) | ||
| + | |||
| + | [[File:Gamma_Ek_x-915To-2133_New.jpg|300 px]] | ||
| + | |||
| + | Ek(x<2133.5mm) | ||
| + | |||
| + | [[File:Gamma_Ek_xS-2133_New.jpg|300 px]] | ||
| + | |||
| + | ====Neutron==== | ||
| + | |||
| + | Ek vs x | ||
| + | |||
| + | [[File:Neutron_Ek_vs_x_New.jpg|300 px]] | ||
| + | |||
| + | |||
| + | ====Proton==== | ||
| + | No proton was seen. | ||
| + | |||
| + | =ROOT commands= | ||
| + | |||
| + | |||
| + | The command below will create a program skeleton which you can use to parse the data | ||
| + | |||
| + | <pre> | ||
| + | hredtest->MakeClass(); | ||
| + | .L hredtest.C | ||
| + | hredtest t; | ||
| + | t.Loop(); | ||
| + | Sad2->Draw("Colz"); | ||
| + | </pre> | ||
| + | |||
| + | |||
| + | |||
| + | |||
| + | |||
| + | |||
| + | =HRRL Radiation Simulations with Thin Detectors= | ||
| + | |||
| + | Detectors are created in GEANT4, Detector dz and dx. | ||
| + | |||
| + | Detector dz: a thin detector in z direction (with thickness dz=1 mircron), and same dimension in xy plane with wall8. It gives xy-plane view of radiation. | ||
| + | |||
| + | Detector dx: a thin detector in x direction (with thickness dx=1 mircron), and same dimension in yz plane with wall8. It gives yz-plane view of radiation. | ||
| + | |||
| + | |||
| + | Origin of the coordinate system is moved to new position, shown as in figure below. | ||
| + | |||
| + | [[File:dx_and_dy_detector.jpg]] | ||
| + | |||
| + | |||
| + | [[File:wall8_dx_and_dy_detectors.jpg]] | ||
| + | |||
| + | ==Electron and Photon Mixed== | ||
| + | |||
| + | ===New Position=== | ||
| + | |||
| + | xy-plane view (doorway) | ||
| + | |||
| + | [[File:New_xy.jpg]] | ||
| + | |||
| + | yz-plane view | ||
| + | |||
| + | [[File:New_yz.jpg]] | ||
| + | |||
| + | ===Old Position=== | ||
| + | |||
| + | xy-plane view (doorway) | ||
| + | |||
| + | [[File:Old_xy.jpg]] | ||
| + | |||
| + | yz-plane view | ||
| + | |||
| + | [[File:Old_yz.jpg]] | ||
| + | |||
| + | ==Energy Profile Comparison between Old and New Positions== | ||
| + | |||
| + | New position:red color. | ||
| + | |||
| + | Old position:blue color. | ||
| + | |||
| + | ===Photon=== | ||
| + | |||
| + | |||
| + | Photon: xy-plane view | ||
| + | |||
| + | These are the photons coming through the opening? | ||
| + | Yes, these 2 detectors are very thin (1 micron thick). One is thin on z direction, gives xy-plane view, at the operator side of wall8. Another one is thin on x direction, gives yz-plane view, at the accelerator side of the room. | ||
| + | |||
| + | [[File:Photon_xy.jpg]] | ||
| + | |||
| + | These are the photons coming through the wall? | ||
| + | |||
| + | |||
| + | Photon: yz-plane view | ||
| + | |||
| + | [[File:Photon_yz.jpg]] | ||
| + | |||
| + | ===Electron=== | ||
| + | |||
| + | |||
| + | Electron: xy-plane view | ||
| + | |||
| + | [[File:Electron_xy.jpg]] | ||
| + | |||
| + | |||
| + | Electron: yz-plane view | ||
| + | |||
| + | [[File:Electron_yz.jpg]] | ||
| + | |||
| + | ==Energy/incident electron== | ||
| + | |||
| + | |||
| + | For each graph determine the total energy deposited per incident electron for the two configurations then take the ratio. | ||
| + | |||
| + | |||
| + | ===New Position=== | ||
| + | |||
| + | Electron gun fired 10 million times, and the electron beam energy is 10 MeV. | ||
| + | |||
| + | xy-view: | ||
| + | |||
| + | Total Photon Energy (if(evt.ID==22) Ek_g_t +=evt.Ek;) = 79020.5; Energy deposited per electron is: 79020.5 / 10 000 000 = 0.00790205 MeV/Electron; | ||
| + | |||
| + | Total Electron Energy (if(evt.ID==11) Ek_e_t +=evt.Ek;) = 102820; Energy deposited per electron is: 102820 / 10 000 000 = 0.0102820 MeV/Electron; | ||
| + | |||
| + | Combined: (79020.5 + 102820)/10 000 000 = 0.01818405 | ||
| + | |||
| + | yz-view: | ||
| + | |||
| + | Total Photon Energy (if(evt.ID==22) Ek_g_t +=evt.Ek;) = 332712; Energy deposited per electron is: 332712 / 10 000 000 = 0.0332712 MeV/Electron; | ||
| + | |||
| + | Total Electron Energy (if(evt.ID==11) Ek_e_t +=evt.Ek;) = 232201; Energy deposited per electron is: 232201 / 10 000 000 = 0.0232201 MeV/Electron; | ||
| + | |||
| + | ===Old Position=== | ||
| + | |||
| + | Electron gun fired 10 million times, and the electron beam energy is 10 MeV. | ||
| + | |||
| + | xy-view: | ||
| + | |||
| + | Total Photon Energy (if(evt.ID==22) Ek_g_t +=evt.Ek;) = 12397.2; Energy deposited per electron is: 12397.2 / 10 000 000 = 0.00123972 MeV/Electron; | ||
| + | |||
| + | Total Electron Energy (if(evt.ID==11) Ek_e_t +=evt.Ek;) = 8670.29; Energy deposited per electron is: 8670.29 / 10 000 000 = 0.000867029 MeV/Electron; | ||
| + | |||
| + | Combined: (12397.2 + 8670.29)/10000000 = 0.002106749 | ||
| + | |||
| + | |||
| + | yz-view: | ||
| + | |||
| + | Total Photon Energy (if(evt.ID==22) Ek_g_t +=evt.Ek;) = 286124; Energy deposited per electron is: 286124 / 10 000 000 = 0.0286124 MeV/Electron; | ||
| + | |||
| + | Total Electron Energy (if(evt.ID==11) Ek_e_t +=evt.Ek;) = 78727.9; Energy deposited per electron is: 78727.9 / 10 000 000 = 0.00787279 MeV/Electron; | ||
| + | |||
| + | ===Ratio of new to old position=== | ||
| + | |||
| + | |||
| + | Following table gives <math> \frac{(total~energy~deposited~per~electron)_{new~position}}{(total~energy~deposited~per~electron)_{old ~position}} </math> | ||
| + | {| border="1" |cellpadding="20" cellspacing="0 | ||
| + | |- | ||
| + | | || photon || electron || combined | ||
| + | |- | ||
| + | | xy-view || 0.00790205/0.00123972 = 6.4 || 0.0102820/0.000867029 = 1.2 || 0.01818405/0.002106749= 8.6 | ||
| + | |- | ||
| + | | yz-view || 0.0332712/0.0286124 =1.2 || 0.0232201/0.00787279 = 2.9 || | ||
| + | |} | ||
| + | |||
| + | = Lead Shielding around HRRL in New Positon = | ||
| + | |||
| + | |||
| + | ==Pb Wall is as Tall as Electron Beam== | ||
| + | |||
| + | Lead wall is 3-inch (10.16 cm) thick. | ||
| + | |||
| + | 45 degree view | ||
| + | |||
| + | [[File:PbShield45.jpg]] | ||
| + | |||
| + | |||
| + | |||
| + | Top view | ||
| + | |||
| + | [[File:PbShieldTop.jpg]] | ||
| + | |||
| + | |||
| + | |||
| + | Side view | ||
| + | |||
| + | [[File:PbShieldSide.jpg]] | ||
| + | |||
| + | |||
| + | ===Simulation Results=== | ||
| + | |||
| + | Note: Electron and photon are differentiated. | ||
| + | |||
| + | |||
| + | Door view: | ||
| + | |||
| + | [[File:PbHalf_xy_view.jpg]] | ||
| + | |||
| + | |||
| + | Side Wall view: | ||
| + | |||
| + | [[File:PbHalf_yz_view.jpg]] | ||
| + | |||
| + | |||
| + | = Deposited energy -vs Pb thickness= | ||
| + | |||
| + | Consider draping a lead blanket which covers from the accelerator exit port to the Tungsten converter. We have a few such blankets down in the HRRL. Go see how thick they are and then simulate the thickness with one blanket then with two. | ||
| + | |||
| + | |||
| + | Plot the total energy deposited by photons and separately electrons for at least 3 Pb thicknesses, one of which is 3". | ||
| + | |||
| + | ==Pb Wall is as Tall as Ceiling== | ||
| + | |||
| + | |||
| + | |||
| + | ===Simulation Results=== | ||
| + | |||
| + | |||
| + | Note: Electron and photon are differentiated. | ||
| + | |||
| + | |||
| + | Door view: | ||
| + | |||
| + | [[File:PbFull_xy_view.jpg]] | ||
| + | |||
| + | |||
| + | Side Wall view: | ||
| + | |||
| + | [[File:PbFull_yz_view.jpg]] | ||
| + | |||
| + | |||
| + | |||
| + | |||
| + | = Cylindrical Pb Shielding around Target Increment Test = | ||
| + | |||
| + | |||
| + | The thickness of lead sheets in the accelerator room is around 6 mm. We desire to use this lead sheets as shielding to shield HRRL in new position. So, I run simulation to study the change in radiation as thickness of shielding increase by 1 increment. | ||
| + | |||
| + | |||
| + | [[File:PbShieldIncrementTest.jpg | 300 px]] | ||
| + | |||
| + | Make the units Energy /electron | ||
| + | |||
| + | ==Increment Test == | ||
| + | |||
| + | Lead shielding was increased from 1 16 times of thickness of lead sheet. | ||
| + | |||
| + | |||
| + | ==Increment Test == | ||
| + | |||
| + | Lead shielding was increased from 1 to 16 times of thickness of lead sheet. | ||
| + | |||
| + | |||
| + | Fill in the two rows below | ||
| + | |||
| + | {| border="1" |cellpadding="20" cellspacing="0 | ||
| + | |- | ||
| + | |Increment || <math> E_{\gamma}~MeV </math> || <math> E_{e}~(MeV) </math>|| <math> E_{tot}~MeV</math> || <math> E_{tot}~per~electron~MeV</math> || Contour Plot | ||
| + | |- | ||
| + | | 0 (before move) || 12397.2 || 8670.29 || 21067.49 || 0.002106749 || [[File:Old_xy.jpg | 50 px]] | ||
| + | |- | ||
| + | | 0 (after move)|| 79020.5 || 102820 || 181840.5 || 0.01818405 || [[File:New_xy.jpg | 50 px ]] | ||
| + | |- | ||
| + | | 1 || 67909.8 || 1322.74 || 69232.5|| 0.00692325|| [[File:1.png | 50 px]] | ||
| + | |- | ||
| + | | 2 || 47080.4 || 849.284 || 47929.7|| 0.00479297|| [[File:2.png | 50 px]] | ||
| + | |- | ||
| + | | 3 || 32447.3 || 660.904 || 33108.2 || 0.00331082 || [[File: 3.png | 50 px]] | ||
| + | |- | ||
| + | | 4 || 23381.6 || 488.022 || 23869.7 || 0.00238697 || [[File: 4.png | 50 px]] | ||
| + | |- | ||
| + | | 5 || 16639.2 || 348.788 || 16988 || 0.0016988 || [[File: 5.png | 50 px]] | ||
| + | |- | ||
| + | | 6 || 12052 || 269.449 || 12321.5 || 0.00123215 || [[File: 6.png | 50 px]] | ||
| + | |- | ||
| + | | 7 || 8867.79 || 224.403 || 9092.19 || 0.000909219 || [[File: 7.png | 50 px]] | ||
| + | |- | ||
| + | | 8 || 6256.38 || 155.28 || 6411.66 || 0.000641166 || [[File: 8.png | 50 px]] | ||
| + | |- | ||
| + | | 9 || 4805.09 || 130.132 || 4935.22 || 0.000493522 || [[File: 9.png | 50 px]] | ||
| + | |- | ||
| + | | 10 || 3397.84 || 98.6598 || 3496.5 || 0.00034965 || [[File: 10.png | 50 px]] | ||
| + | |- | ||
| + | | 11 || 2563.9 || 88.4048 || 2652.3 || 0.00026523 || [[File: 11.png | 50 px]] | ||
| + | |- | ||
| + | | 12 || 1845.77 || 72.3448 || 1918.11 || 0.000191811 || [[File: 12.png | 50 px]] | ||
| + | |- | ||
| + | | 13 || 1459.55 || 54.9425 || 1514.49 || 0.000151449 || [[File: 13.png | 50 px]] | ||
| + | |- | ||
| + | | 14 || 1025.4 || 63.0917 || 1088.49 || 0.000108849 || [[File: 14.png | 50 px]] | ||
| + | |- | ||
| + | | 15 || 690.531 || 45.8029 || 736.334 || 0.000736334 || [[File: 15.png | 50 px]] | ||
| + | |- | ||
| + | | 16 || 515.095 || 54.7029 || 569.798 || 0.000569798 || [[File: 16.png | 50 px]] | ||
| + | |- | ||
| + | |} | ||
| + | |||
| + | |||
| + | |||
| + | =Simulation for corrected HRRL and Target position= | ||
| + | |||
| + | |||
| + | After shifting origin of the coordinate system from one corner of the Wall#1 to the other corner, I forgot to shift position of the HRRL and target. Here, I want to correct position of HRRL and target in simulation and run the increment test again. | ||
| + | |||
| + | HRRL will be bolt the wall, so on z-axis it is very simple to place electron source, it is just radius of the HRRL. On x-axis, the length of the HRRL is 5 feet. If we subtract the distance between wall#1 and wall#6, which is 24.1 cm, we will have the position of electron source. This distance 128.3 cm. If we allow 5 cm distance for wires etc, then electron source should be placed 133.3 cm. | ||
| + | |||
| + | The converter should be placed electron beam axis, which will have same z-coordinates as electron beam source in simulation. However, on x-axis, we have 2 [[Q1B]] after HRRL. Each [[Q1B]] has thickness of 24 cm. If we allow spacing of 2 cm between them, we will have 50 cm of distance taken up by these 2 quad sets. We would like to place converter 10 cm after the quads. Converter finally end up at 193.3 cm (133.3cm+50cm+10cm) on x-axis. | ||
| + | |||
| + | |||
| + | |||
| + | {| border="1" |cellpadding="20" cellspacing="0 | ||
| + | |- | ||
| + | |Increment || <math> E_{\gamma}~MeV </math> || <math> E_{e}~(MeV) </math>|| <math> E_{tot}~MeV</math> || <math> E_{tot}~per~electron~MeV</math> || Contour Plot | ||
| + | |- | ||
| + | | 0 (before move) || 12658.4 || 8493.66 || 21152.1 || 0.00126584 || [[File:Corrected_Old_xy.jpg | 50 px]] | ||
| + | |- | ||
| + | | 0 (after move) || 26394.9 || 50108.1 || 76503.1 || 0.00263949 || [[File:Corrected_New_xy.jpg | 50 px ]] | ||
| + | |- | ||
| + | | 1 || 17819.1 || 430.89 || 18250 || 0.00178191 || [[File:Corrected_1.png | 50 px]] | ||
| + | |- | ||
| + | | 2 || 10600.8 || 293.753 || 10894.5 || 0.00106008 || [[File:Corrected_2.png | 50 px]] | ||
| + | |- | ||
| + | | 3 || 6722.33 || 271.369 || 6993.7 || 0.000672233 || [[File: Corrected_3.png | 50 px]] | ||
| + | |- | ||
| + | | 4 || 4393.05 || 214.263 || 4607.31 || 0.000439305 || [[File: Corrected_4.png | 50 px]] | ||
| + | |- | ||
| + | | 5 || 2809.48 || 129.821 || 2939.3 || 0.000280948 || [[File: Corrected_5.png | 50 px]] | ||
| + | |- | ||
| + | | 6 || 1955.28 || 119.253 || 2074.54 || 0.000195528 || [[File: Corrected_6.png | 50 px]] | ||
| + | |- | ||
| + | |} | ||
Latest revision as of 21:22, 7 October 2010
Simulation report
The development of a positron source for JLab using the HRRL requires moving the HRRL to a new location in order to have sufficient room to construct an achomat beam line. Three measurements of the radiation footprint have been done and used to estimate the radiological impact of moving the HRRL. The simulation package Geant4 was used to estimate the radiation footprint that will result if the HRRL accelerator cavity is moved closer to the accelerator room entrance. The simulation indicates that moving HRRL to the proposed position will increase the radiation at the doorway to the accelerator room by a factor of 8.6. The simulation also estimates that a 1.2 cm thick lead shield around the accelerator will reduce the radiation at the door way to its original levels. If we use this prediction to extrapolate the radiation measurements made, then one can estimate safe operation by restricting the HRRL rep rate to below 400 Hz. This restriction can be changed based on radiation footprint measurements made after the HRRL is moved. We request amending the current operating license for the HRRL to restrict it's repetition rate to less than 400 Hz so it may be moved to the proposed location.
Proposed change to Accelerator
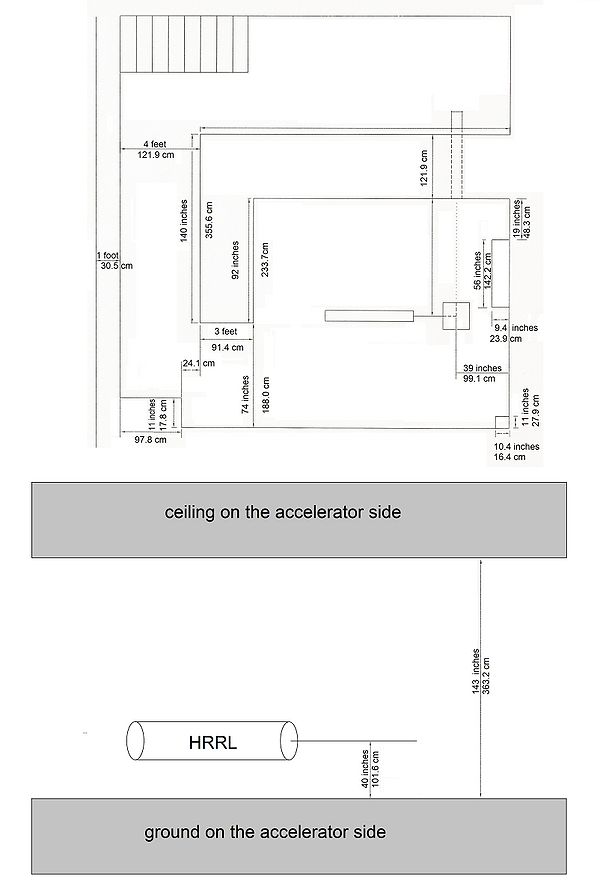
We propose moving the HRRL accelerator cavity from its current location in the center of the room to a corner wall in order to construct a chromatic beam line which will be used in the develop of a positron source for JLab. Below is a picture illustrating the current location of the HRRL cavity and the proposed new location.
This new position will allow us to install enough quads and dipoles to create an achromatic beam of electrons or positrons. A Tungsten converter will be place close to the HRRL cavity and be used to generate positrons. A setup of two quads will be used before the Tungsten converter in order to focus the incident electron beam on the target. A Faraday Cup is place on the zero port line to measure the beam current and optimize beam transmission prior to inserting a Tungsten converter. A system of 3 quads will be used to collect positrons escaping from the downstream side of the Tungsten converter. The first dipole will separate positrons from the primary electron beam. The remaining beam optics are shown in the beam line drawing below.
Radiation Measurements
Several measurements of the HRRL's radiation footprint have been done. The first measurements were performed by M. Balzer and G. Stancari on Feb. 4, 2009 using OSL dosimeters at 15 locations around the accelerator. Two additional measurements were done on May 17, 2010 and July 28, 2010 using Ludlum's ion chamber radiation monitors Model 375/9. The first measurements using OSL dosimeters established general map of the radiation surrounding the HRRL accelerator. The second set of measurements focused on two locations and looked at how well the radiation scales with the accelerator beam properties in order to establish a guide for extrapolating the dose after moving the cavity to the new location. The largest dose rate was observed on a wall at a spot which was at 90 degrees from the center of the accelerator (location 7 shown below). The dose dropped as you moved away from the central region of the accelerator. The OSL measurement at a spot symmetric to that location (location 13) reported a dose that was about an order of magnitude smaller. The second set of measurements focused on location 13 as it will be located in the doorway of the accelerator room after the HRRL is repositioned.
Radiological map using OSL dosimeters
On February 4th, 2009, M. Balzer and G. Stancari used OSL dosimeters to measure the dose at several locations around the HRRL accelerator. The measurements made by 5 dosimeters placed at each of the 15 locations was used to determine the average dose and RMS appearing in the table below. Locations 7 and 15 had the highest dose rates measured of 73 rad/hr and 62 rad/hr respectively. One may have expected that the the downstream location would have a high dose rate. The higher dose rate at location 7 is a little surprising but might be explained by the presence of a collimator in the center of the HRRL accelerator which collimates accelerated electrons before they exit the HRRL. Measurements at locations 11 and 13 were chosen because a measurement at location 13 may be used as a first estimate of the dose at location 11 after the HRRL is moved.
The detectors located at positions marked 11 and 13 measured a dose of 164 mrad/hr and 5828 mrad/hr respectively when the accelerator was running with 15 MeV electron beam energy, 20 mA peak current, 1 kHz repetition rate, and 30 ns pulse width.
|
Lludlum measurements
The radiation dose was measured at the three locations shown in Figure 4 while the HRRL was operated at the "old" position denoted in the Figure. The measurements were made using the 2 Gamma Area Monitor model 45-9 radiation monitors from Lludlum. One monitor is mounted in the upper downstream corner of the experimental cell and the other in the accelerator room. The ion chamber in the accelerator room was moved between the two positions, Pos_O and Pos_N, shown in Figure 4.
One set of measurements was used to correlate the dose rate observed by the radiation monitors located in the experimental cell side to the dose rate measured at the entrance to the HRRL accelerator room, Pos_N. The monitor on the experimental cell wall is set to shutdown the accelerator if the monitor measures more than 2 mrad/hr when electrons are delivered to the experimental cell, 5 mrad/hr when photons are delivered. The measurements are shown in the table below. The set of measurements made in May were done when the HRRl had a beamline sending photons into the experimental cell while the measurements in July were done during emittance measurements using a straight beamline dumping the electron into a shielded Faraday cup. Changing the acclerator beam line from one with a 90 degree bend to one that is straight decreased the dose measured in the experimental hall and increased the dose in the accelerator cell. The measurements made in May will be used to estimate the correlation between the dose measured at the exit of the accelerator cell to the monitor located in the experimental cell.
| Run | Energy of beam (MeV) | Peak current of beam (mA) | Rap rate (Hz) | Experimental Cell Channel 17 (mrad), | Accelerator cell Channel 16, (mrad) | Ratio: Chan16/Chan17 |
| May | 16 | 47.6 | 40 | 2.3 | 20.5 1.0 | 8.9 |
| May | 16 | 33.2 | 40 | 1.75 0.5 | 14.0 0.5 | 8.0 |
| July | 16 | 40 | 40 | 0.1 | 302 | 300 |
| July | 16 | 40 | 70 | 0.2 | 53 2 | 265 |
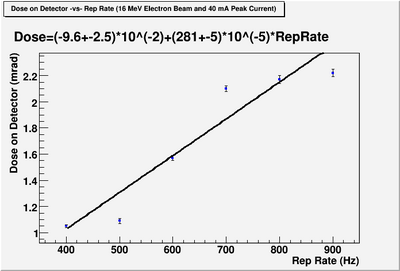
The dose at location Pos_O in Figure 4 was measured for several accelerator beam current setting. The measured dose at Pos_O was assumed to transfer to Pos_N once the accelerator is moved. This assumption may be an underestimate given that the wall was observed to be a hot spot. Despite this possiblity, we will estimate the dose one can expect on the experimental cell radiation monitor assuming that the dose measured at Pos_O is what we will measure at Pos_N after moving the HRRL. Figure 5 represents an estimate of the dose which will be observed in the experimental cell using the dose measured at Pos_O when HRRL is run at its maximum electron energy of 16 MeV and at a peak current of 40 mA with a FWHM of 150 ns. Figure 5 suggests the HRRL may be safely operated if we restrict the peak current to 40 mA and the repetition rate to less that 400 Hz. If you assume that the location with the highest radiation level moves to the doorway, then we should restrict the HRRL to a factor of 10 less current/rep rate until a radiation survey is done.
Simulation results
A simulation of the HRRL with a Tungsten target was done to determine how much shielding would be required to restore the accelerator to its original footprint as seen at the doorway to the accelerator cell. A Tungsten target was put in place to provide a representation of the accelerator configuration which will be used for the development of the JLab positron source. The simulation suggests that the original radiological footprint can be restored if a 1.2 cm thick lead sheet placed around the accelerator and tungsten target. Below is a description of the simulation.
Geometry definitions
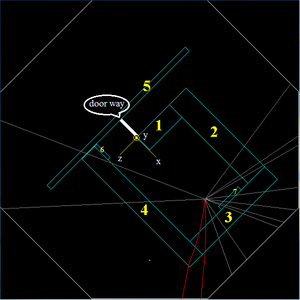
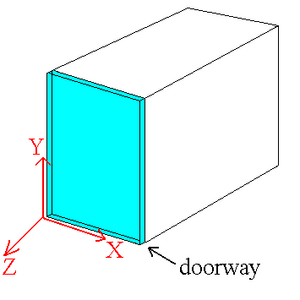
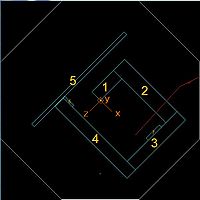
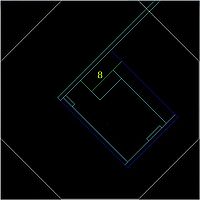
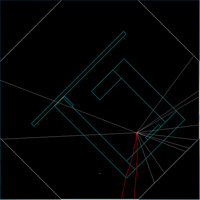
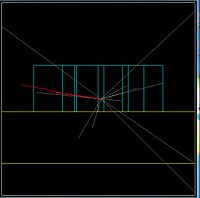
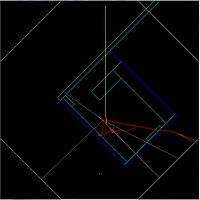
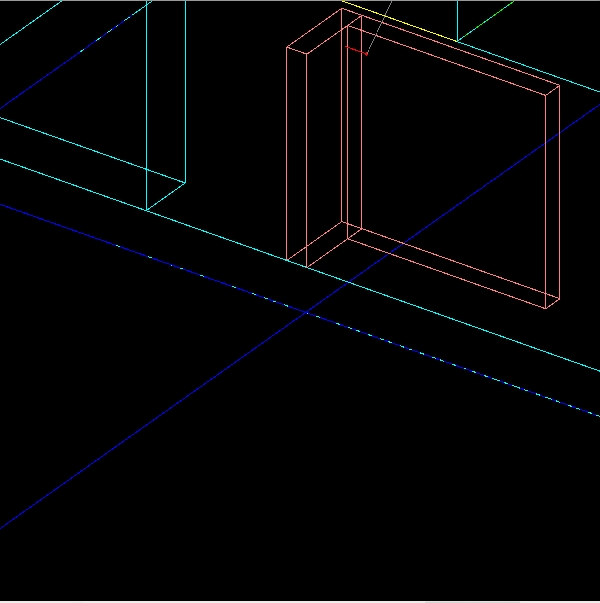
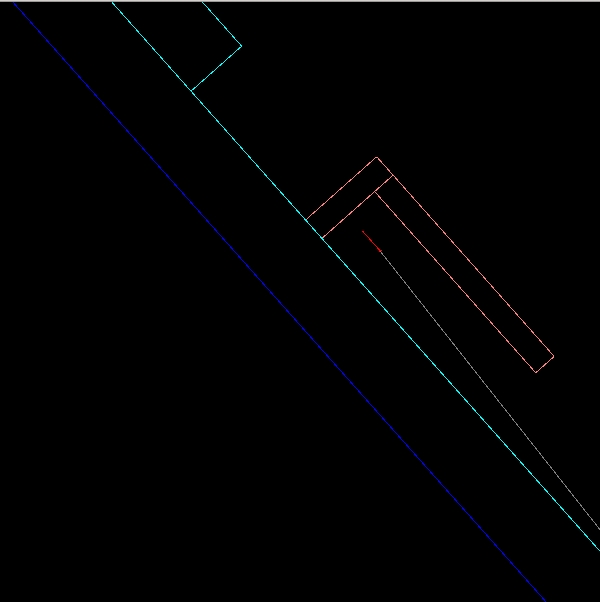
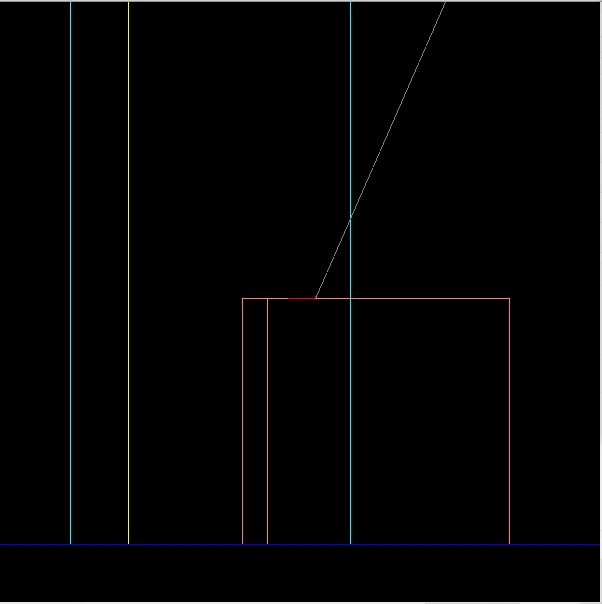
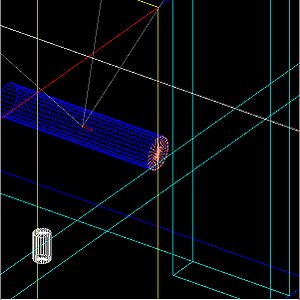
A screen shot of the simulations accelerator cell volume is shown in Figure 6. Standard concrete was used to define the wall material. The event shown represents a 10 MeV electron directed towards wall #2 which intersects a 2mm thick Tungsten target. In this particular event, several photons and 2 charged particles escape the Tungsten converter. Figure 7 illustrates the region of interest, the doorway. All particles which intersected the doorway were recorded for analysis. A coordinate system is defined to have its origin located at the lower left corner of the doorway as seen from outside the accelerator cell.
Sadiq: Is wall #8 in Figure 7 the same as wall #1 in Figure 6? If so relabel wall #8 to be wall #1.
Dr. Forest: Wall#8 is the doorway. Wall#1 is the wall next to doorway. They are different. Doorway was named as wall#8 in simulation.
Should the wall #8 label appear on the blue surface?
Energy deposited
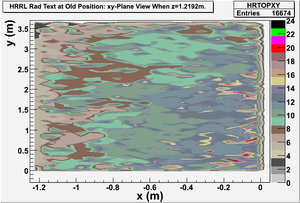
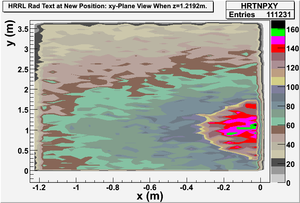
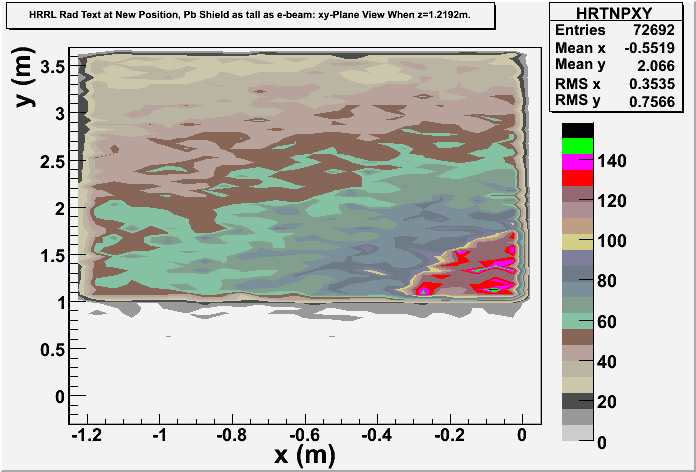
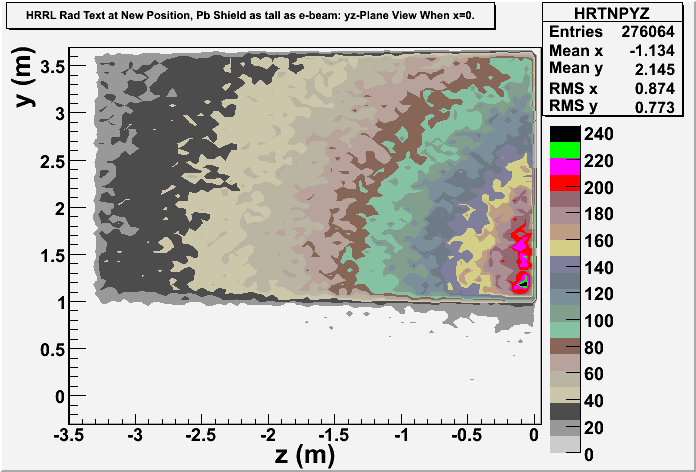
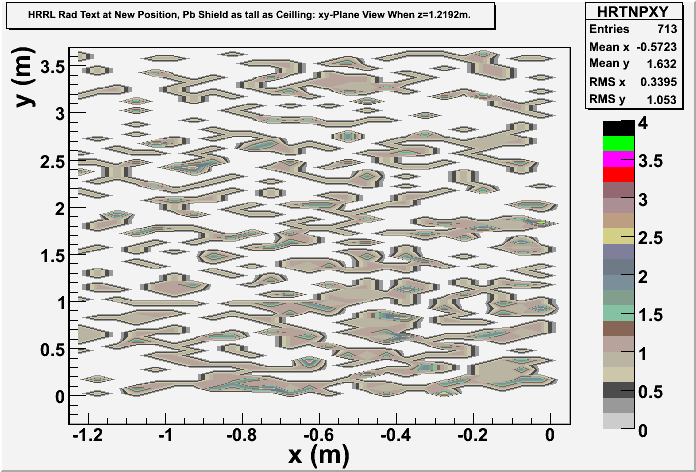
Fig. 8 and Fig. 9 show number of photons and electrons deposited in the doorway before and after shifting the cavity respectively. These Figures show that at new location we will have a hot spot at the corner of doorway around 1 m height. The number of particles (electrons and photons) increased about factor of 10 at new location.
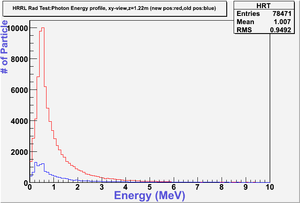
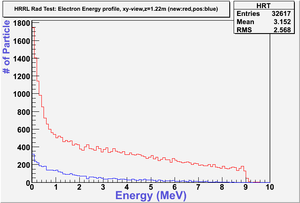
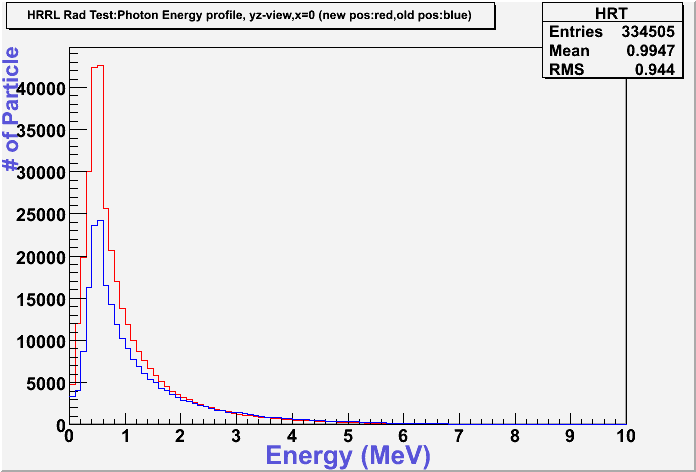
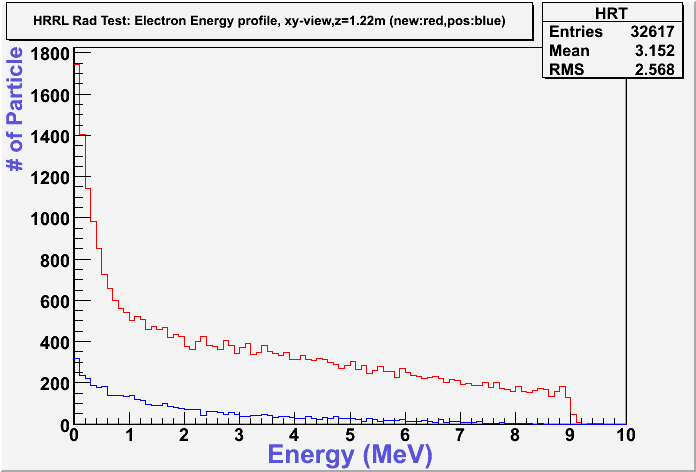
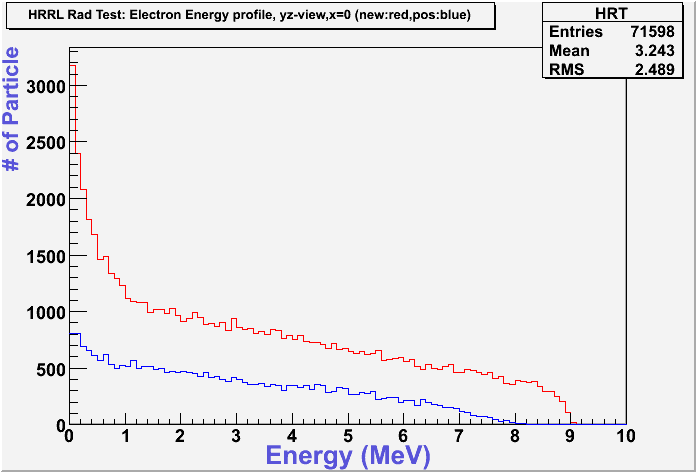
Fig. 10 and Fig. 11 are energy profiles on the doorway before (blue) and after (red) shifting the cavity to new location. The radiation increased about factor of 10 at new location.
Shielding The Radiation
Cavity was shifted to new location to study the radiation and shielding effect on radiation. We used cylindrical shielding around the cavity and one cap at the upstream end of the cavity. Shielding was increased by the increment of 6 mm. At 2 increments, radiation was reduced to same level as before shifting.
| Increment | |||||
| 0 (before move) | 12658.4 | 8493.66 | 21152.1 | 0.00126584 | |
| 0 (after move) | 26394.9 | 50108.1 | 76503.1 | 0.00263949 | |
| 1 | 17819.1 | 430.89 | 18250 | 0.00178191 | |
| 2 | 10600.8 | 293.753 | 10894.5 | 0.00106008 |
sadiq: insert the correct table from below.
Conclusion
A 1.2 cm (1/2 inch) thick layer of Pb ( 2 , 1/4 inch thick lead sheets) around the new accelerator cavity's position will restore the radiation footprint of the original accelerator's position.
We did radiation measurement to estimate the dose rate on the monitor on the experimental cell side after shifting the cavity to new location. We conclude that, at new location for cavity, for condition: electron beam energy of 16 MeV, beam peak current of 40 mA, pulse width full width half max of 150 ns, it is safe to run up to 900 Hz repetition rate.
Simulation work
Design a simulation to determine radiation footprint in HRRL cell.
1.) The ceiling is 4 feet thick
2.) there is PB shiedling between the HRRL accelerator room and the accelerator operator station
3.) the dirt is about 10 feet thick on the wall side where the accelerator is going to be mounted
4.) determine shielding wall thickness for HRRL cavity to reduce dose out the door
5.) Determine shielding for Tungsten converter
Drawing
Get a drawing from facilities documenting the shielding in that cell with dimensions
Denton Dance: x4710, may be able to provide drawings. B119 Beam Lab
Material Definitions
Concrete
Concrete has 6 elements and a density of 2.7 g/cm^3
| Element | Atomic Weight (A) | Atomic Number (Z) | Proportion by Weight |
| 1 | 1.0079 | 1. | 0.004 |
| 2 | 15.9994 | 8. | 0.509 |
| 3 | 26.981539 | 13 | 0.034 |
| 4 | 28.0855 | 14. | 0.345 |
| 5 | 40.078 | 20 | 0.070 |
| 6 | 55.8474 | 26. | 0.038 |
GEANT4 code
a = 1.0079*g/mole;
  G4Element* elH  = new G4Element(name="Hydrogen",symbol="H" , z= 1., a);
  a = 15.9994*g/mole;
  G4Element* elO  = new G4Element(name="Oxygen"  ,symbol="O" , z= 8., a);
a = 26.981539*g/mole;
  G4Element* elAl  = new G4Element(name="Aluminum",symbol="Al" , z= 13., a);
a = 28.0855*g/mole;
  G4Element* elSi  = new G4Element(name="Silicon",symbol="Si" , z= 14., a);
a = 40.078*g/mole;
  G4Element* elCa  = new G4Element(name="Calcium",symbol="Ca" , z= 20., a);
a = 55.8474*g/mole;
  G4Element* elNi  = new G4Element(name="Iron",symbol="Fe" , z= 26., a);


  density =2.7*g/cm3;
  G4Material* Concrete = new G4Material(name="Concrete ",density,ncomponents=6);
  Concrete->AddElement(elH, fractionmass=0.4*perCent);
  Concrete->AddElement(elO, fractionmass=50.9*perCent);
 Concrete->AddElement(elAl, fractionmass=3.4*perCent);
 Concrete->AddElement(elSi, fractionmass=34.5*perCent);
 Concrete->AddElement(elCa, fractionmass=7.0*perCent);
 Concrete->AddElement(elNi, fractionmass=3.8*perCent);
Relative Rates
The first step in the simulation will be to compare relative radiation rates at the exit of the accelerator room. The radiation exiting the accelerator room before and after moving the accelerator will be simulated. Although all particles can be tracked we will mostly be interested in gamma and neutron fluxes through the door. The ratio of before/after moving fluxes for gamma and neutron should be plotted as a function of energy.
Geometry
[HRRL room dimension measured by Jason Swanson]
HRRL Geom by Sadiq
what is the thicknes of the walls below.
No dirt inside walls.
Wall Number 3, 4 and 5 are 1 feet thick.
Ceiling is 5 feet thick. Above that is 1st floor metal structure.
GEANT4 Simulation Setup
HRRL Room Top view
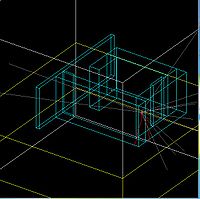
Wall is not real wall. Its material is air, this wall is just used as detector to detect particles and photons.
The origin of the coordinate system moved the the other corner of the wall#1 as shown one of the figure in below.
HRRL Room 45 Degree View
HRRL Room Side view
HRRL Electron Source and Tungsten Target 45 Degree View
HRRL Electron Source and Tungsten Target Top View
HRRL New Electron Source
Geant4 Codes
GPS e- Source
/gps/particle e-
/gps/energy 10. MeV
/gps/pos/type Plane
/gps/pos/shape Circle
/gps/pos/radius 0.6 cm
/gps/pos/sigma_r 3 mm
/gps/pos/sigma_x 3 mm
/gps/pos/sigma_y 3 mm
Old Position, -Z direction:
/gps/pos/centre 380 101.6 -93.68 cm
New Postion, X direction:
/gps/pos/centre 66.5 101.6 93.93 cm
/gps/direction 1 0 0
Physics List
10 MeV Gamma hit 2 meter D2O target to show neutron from disintegrated deuterium.
Yellow: neutron
Red: electron
Gray: gamma
It is better to show the tracking output in
order to see the physics process and particles created.
Dectector Construction
File:Detector Construction.txt
Electron and photon interactions with the target and the walls
Electron in Target
*********************************************************************************************************
* G4Track Information:   Particle = e-,   Track ID = 8,   Parent ID = 2
*********************************************************************************************************


#Step#      X         Y         Z        KineE    dEStep   StepLeng  TrakLeng    Volume     Process
    1 1.66401 m  1.01473 m  93.5217 cm      0 eV 147.944 keV29.1396 um 29.1396 um       Target       eIoni
Electron go into Wall3
*********************************************************************************************************
* G4Track Information:   Particle = e-,   Track ID = 1,   Parent ID = 0
*********************************************************************************************************


#Step#      X         Y         Z        KineE    dEStep   StepLeng  TrakLeng    Volume     Process
    1 1.64085 m  1.03791 m  93.998 cm 9.76788 MeV198.526 keV97.4316 cm 97.4316 cm        World       eIoni

#Step#      X         Y         Z        KineE    dEStep   StepLeng  TrakLeng    Volume     Process
    2 1.67863 m  1.03716 m  93.7509 cm 9.73665 MeV7.70861 keV3.7869 cm 1.01218 m         World       eIoni

#Step#      X         Y         Z        KineE    dEStep   StepLeng  TrakLeng    Volume     Process
    3 2.38158 m  1.04721 m  88.1765 cm 9.53633 MeV 137.3 keV70.5761 cm 1.71795 m         World       eIoni

#Step#      X         Y         Z        KineE    dEStep   StepLeng  TrakLeng    Volume     Process
    4 4.8856 m  1.06243 m  1.22615 m  9.04023 MeV496.099 keV2.5446 m  4.26254 m         World  Transportation

#Step#      X         Y         Z        KineE    dEStep   StepLeng  TrakLeng    Volume     Process
    5  5.194 m   1.034 m  1.28563 m  8.91744 MeV122.789 keV31.6299 cm 4.57884 m         Wall3  Transportation

#Step#      X         Y         Z        KineE    dEStep   StepLeng  TrakLeng    Volume     Process
    6    7.5 m  95.4945 cm 1.63263 m  8.49278 MeV424.668 keV2.34972 m  6.92856 m    OutOfWorld  Transportation
Gamma go into Wall3
*********************************************************************************************************
* G4Track Information:   Particle = gamma,   Track ID = 3,   Parent ID = 1
*********************************************************************************************************


#Step#      X         Y         Z        KineE    dEStep   StepLeng  TrakLeng    Volume     Process
    1 4.8856 m  98.0398 cm 24.6372 cm 78.0395 keV     0 eV 3.08802 m  3.08802 m         World  Transportation

#Step#      X         Y         Z        KineE    dEStep   StepLeng  TrakLeng    Volume     Process
    2  5.194 m  97.6205 cm 17.6225 cm 78.0395 keV     0 eV 31.6305 cm 3.40432 m         Wall3  Transportation

#Step#      X         Y         Z        KineE    dEStep   StepLeng  TrakLeng    Volume     Process
    3 5.97662 m  96.5562 cm -1.78528 mm      0 eV    403 eV 80.2682 cm  4.207 m         World        phot
Gamma go into Wall4
*********************************************************************************************************
* G4Track Information:   Particle = gamma,   Track ID = 2,   Parent ID = 1
*********************************************************************************************************


#Step#      X         Y         Z        KineE    dEStep   StepLeng  TrakLeng    Volume     Process
    1 2.98112 m  1.42043 m  1.8796 m  92.4831 keV     0 eV 1.72044 m  1.72044 m         World  Transportation

#Step#      X         Y         Z        KineE    dEStep   StepLeng  TrakLeng    Volume     Process
    2 3.42618 m  1.53616 m  2.1844 m  92.4831 keV     0 eV 55.1695 cm 2.27214 m         Wall4  Transportation

#Step#      X         Y         Z        KineE    dEStep   StepLeng  TrakLeng    Volume     Process
    3    7.5 m  2.59551 m  4.97442 m  92.4831 keV     0 eV   5.05 m  7.32214 m    OutOfWorld  Transportation
Radiation Ratio estimate for Wall 8 2/25/10
A GEANT4 simulation was used to compare the radiation footprint of the HRRL before and after its relocation. The ratio of radiation incident at the exit of the accelerator room (identified as Wall #8 in the pictures below) was estimated by tracking electrons, photons, and neutrons.
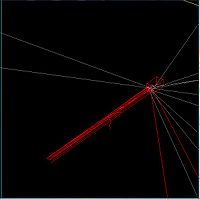
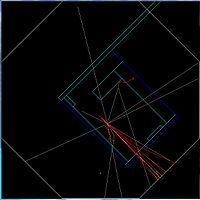
The red line in the figure below indicates the interaction point of an electron from the HRRL accelerator with a Tungsten radiator used to convert the incident electron into e+e- pairs. The proposed location for the HRRL is to move it just below wall #6 and in front of the "Z" axis label..
The drawing below identifies the location of Wall #8. Wall 8 is composed of air, this wall is just used as detector to detect particles and photons.
Number of particles
Simulation results by number of particles for 10 million run.
| Particle | Numbers at Old Position [1] | Numbers at New Position [2] | Ration (new:old) |
| e- | 697728 | 2397851 | 3.43665583 |
| gamma | 375260 | 779381 | 0.481484665 |
G4 code for registering particles in wall8. Daughter particles are also registered as long as they are in wall8.
if(  fTrack->GetVolume()->GetName() =="Wall8"  && (fTrack->GetDefinition()->GetPDGEncoding()==22 ||fTrack->GetDefinition()->GetPDGEncoding()==11 ||fTrack->GetDefinition()->GetPDGEncoding()==2212 ||fTrack->GetDefinition()->GetPDGEncoding()==2112 ))
  	{
	if (fTrack->GetDefinition()->GetPDGEncoding()==22 ) //if gamma
	{     ig++;
	      outfile
	       << ig  << " 22 "
	      <<fTrack->GetKineticEnergy() << " "
	      << fTrack->GetPosition().x()<< " "
	      << fTrack->GetPosition().y()<< " "
	      << fTrack->GetPosition().z()<< " "
	      << fTrack->GetMomentum().x() << " "
	      << fTrack->GetMomentum().y() << " "
	      << fTrack->GetMomentum().z() << " "<< G4endl;}
	if (fTrack->GetDefinition()->GetPDGEncoding()==11 ) //if e-
	{ie++;
		outfile
	      << ie  << " 11 "
	      <<fTrack->GetKineticEnergy() << " "
	      << fTrack->GetPosition().x()<< " "
	      << fTrack->GetPosition().y()<< " "
	      << fTrack->GetPosition().z()<< " "
	      << fTrack->GetMomentum().x() << " "
	      << fTrack->GetMomentum().y() << " "
	      << fTrack->GetMomentum().z() << " "<< G4endl;}
	if (fTrack->GetDefinition()->GetPDGEncoding()==2212 ) //if proton
	{ip++;
		outfile
	      << ip  << " 2212 "
	      <<fTrack->GetKineticEnergy() << " "
	      << fTrack->GetPosition().x()<< " "
	      << fTrack->GetPosition().y()<< " "
	      << fTrack->GetPosition().z()<< " "
	      << fTrack->GetMomentum().x() << " "
	      << fTrack->GetMomentum().y() << " "
	      << fTrack->GetMomentum().z() << " "<< G4endl;}
	if (fTrack->GetDefinition()->GetPDGEncoding()==2112 ) //if neutron
	{in++;
		outfile
	      << in  << " 2112 "
	      <<fTrack->GetKineticEnergy() << " "
	      << fTrack->GetPosition().x()<< " "
	      << fTrack->GetPosition().y()<< " "
	      << fTrack->GetPosition().z()<< " "
	      << fTrack->GetMomentum().x() << " "
	      << fTrack->GetMomentum().y() << " "
	      << fTrack->GetMomentum().z() << " "<< G4endl;}
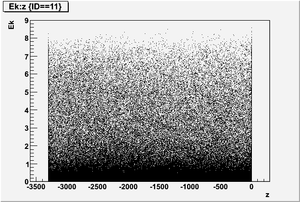
	}
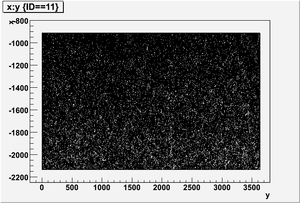
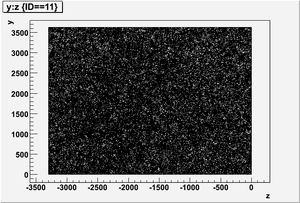
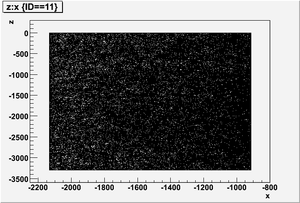
Energy profile
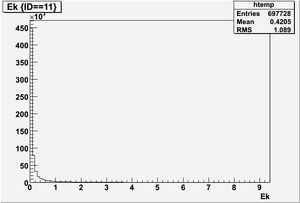
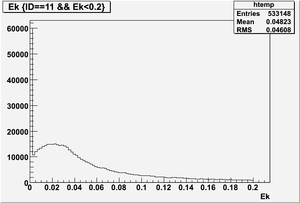
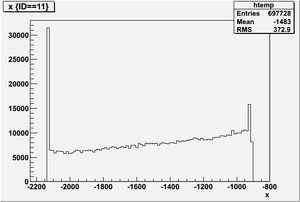
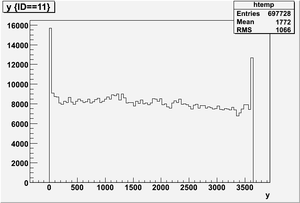
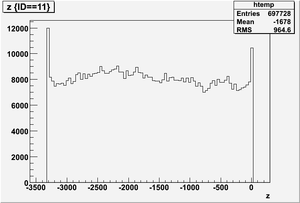
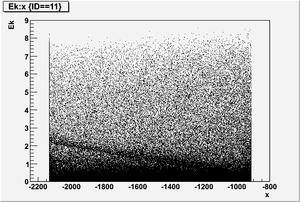
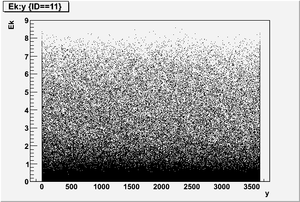
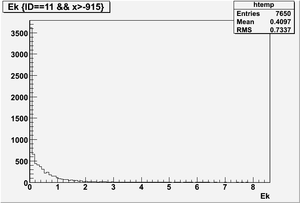
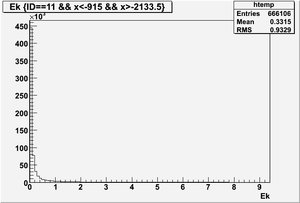
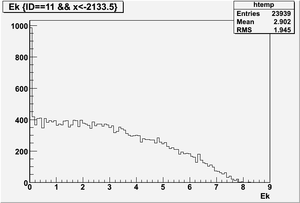
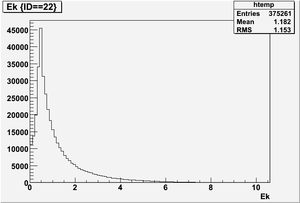
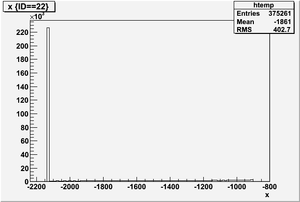
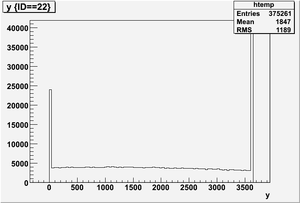
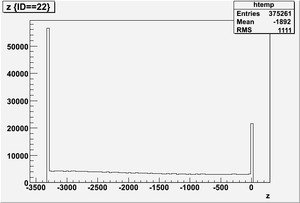
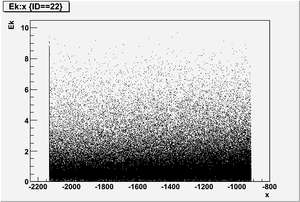
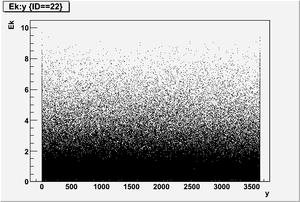
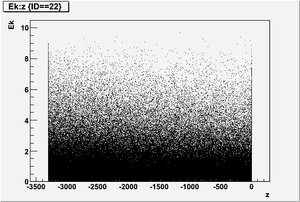
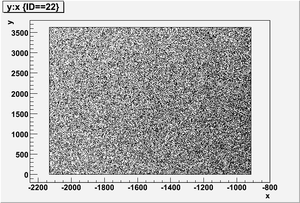
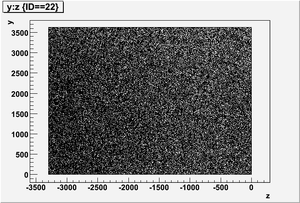
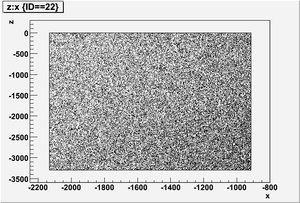
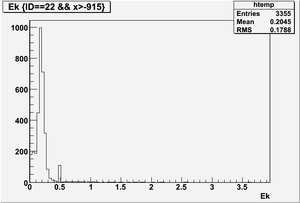
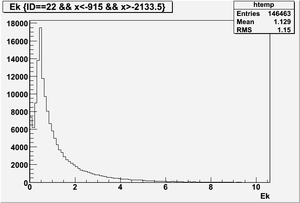
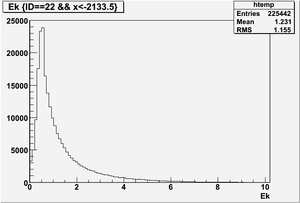
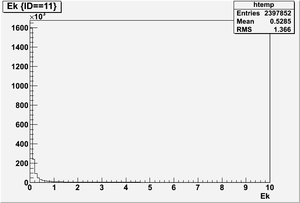
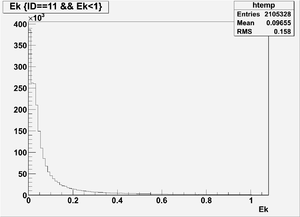
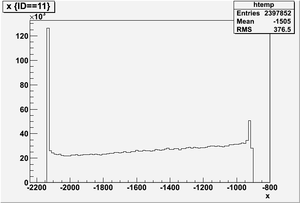
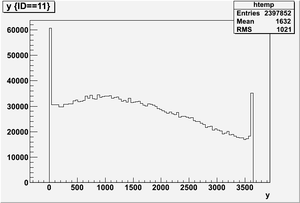
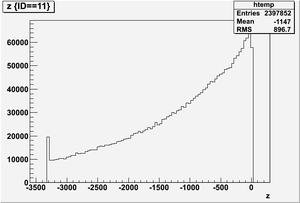
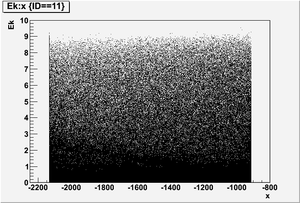
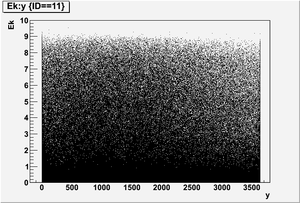
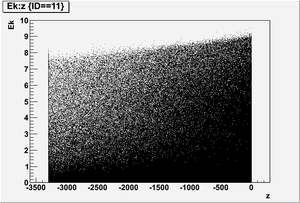
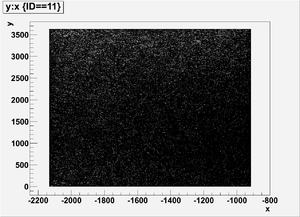
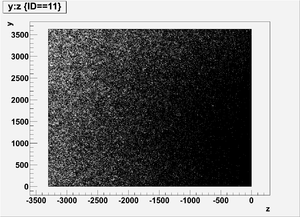
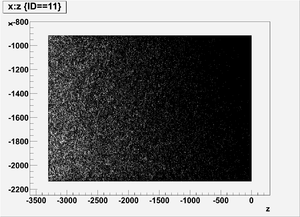
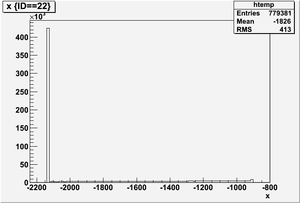
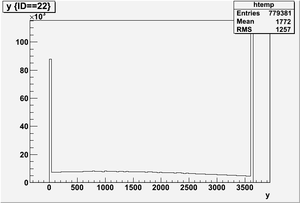
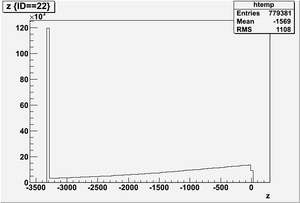
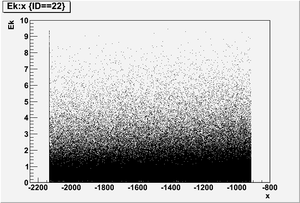
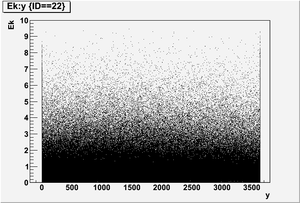
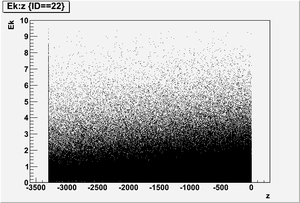
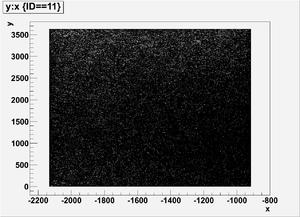
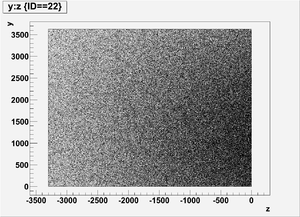
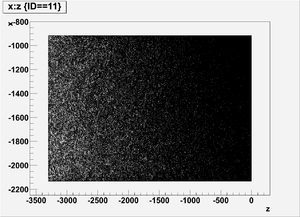
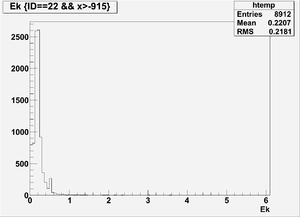
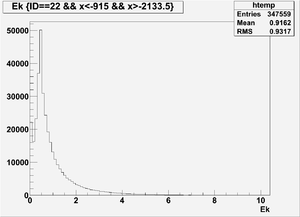
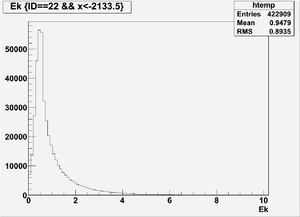
The figures below illustrate the energy spectrum of radiation entering wall #8 (described above) as predicted by a GEANT4 simulation of the HRRL accelerator room.
Old Position
Electron
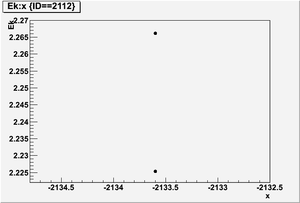
Kinetic energy (Ek) in the unit of MeV below
Position x in the unit of mm below
Position y
Position z
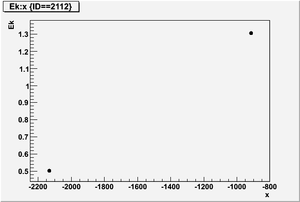
Ek vs x
Ek vs y
Ek vs z
x vs y
y vs z
z vs x
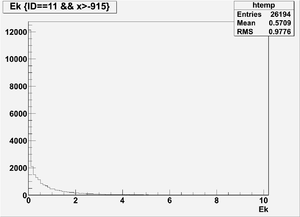
Ek(x>-915mm)
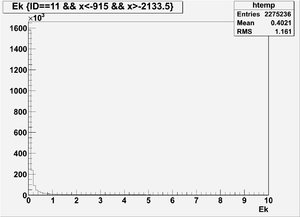
Ek(2133.5mm<x<-915mm)
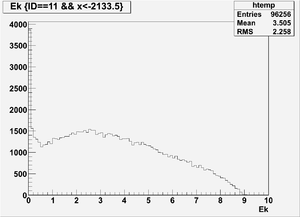
Ek(x<2133.5mm)
Photon
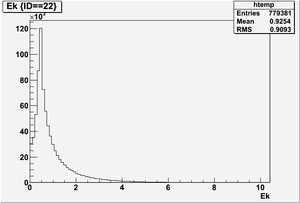
Kinetic energy (Ek) in the unit of MeV below
Position x in the unit of mm below
Position y
Position z
Ek vs x
Ek vs y
Ek vs z
x vs y
y vs z
z vs x
Ek(x>-915mm)
Ek(2133.5mm<x<-915mm)
Ek(x<2133.5mm)
Neutron
Ek vs x
Proton
No proton was seen.
New Position
Electron
Kinetic energy (Ek) in the unit of MeV below
Position x in the unit of mm below
Position y
Position z
Ek vs x
Ek vs y
Ek vs z
x vs y
y vs z
z vs x
Ek(x>-915mm)
Ek(2133.5mm<x<-915mm)
Ek(x<2133.5mm)
Photon
Kinetic energy (Ek) in the unit of MeV below
Position x in the unit of mm below
Position y
Position z
Ek vs x
Ek vs y
Ek vs z
x vs y
y vs z
z vs x
Ek(x>-915mm)
Ek(2133.5mm<x<-915mm)
Ek(x<2133.5mm)
Neutron
Ek vs x
Proton
No proton was seen.
ROOT commands
The command below will create a program skeleton which you can use to parse the data
 hredtest->MakeClass();
.L hredtest.C
 hredtest t;
 t.Loop();
 Sad2->Draw("Colz");
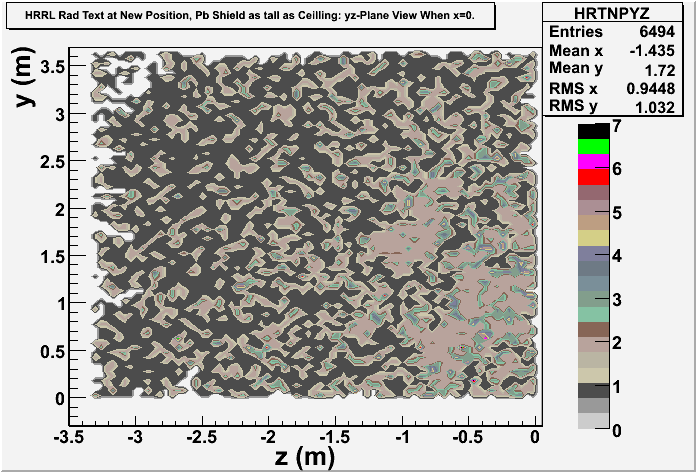
HRRL Radiation Simulations with Thin Detectors
Detectors are created in GEANT4, Detector dz and dx.
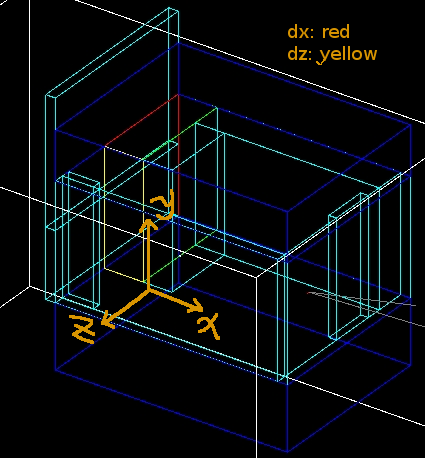
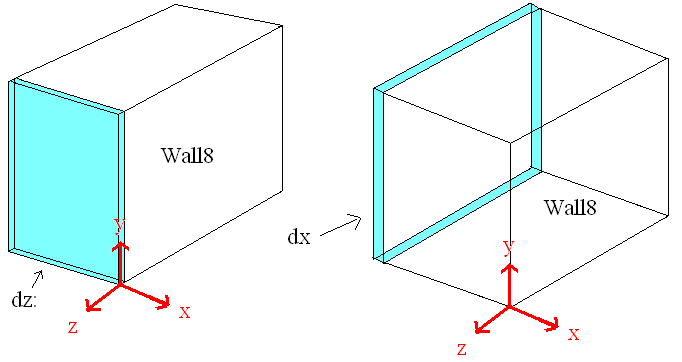
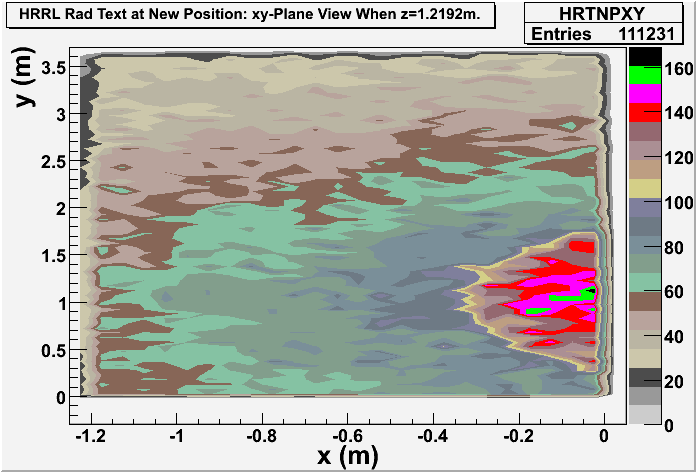
Detector dz: a thin detector in z direction (with thickness dz=1 mircron), and same dimension in xy plane with wall8. It gives xy-plane view of radiation.
Detector dx: a thin detector in x direction (with thickness dx=1 mircron), and same dimension in yz plane with wall8. It gives yz-plane view of radiation.
Origin of the coordinate system is moved to new position, shown as in figure below.
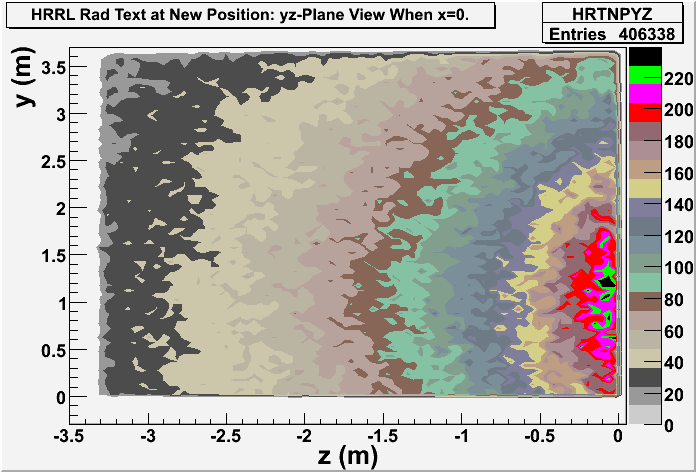
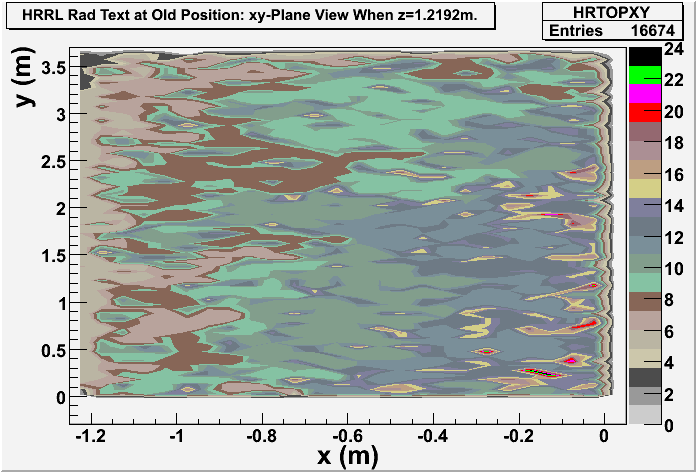
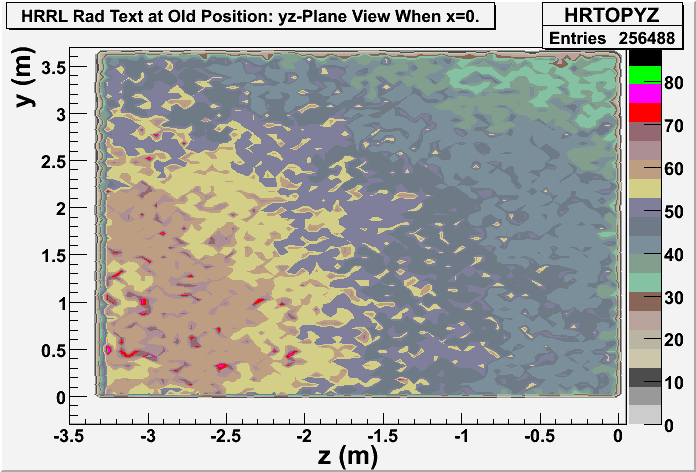
Electron and Photon Mixed
New Position
xy-plane view (doorway)
yz-plane view
Old Position
xy-plane view (doorway)
yz-plane view
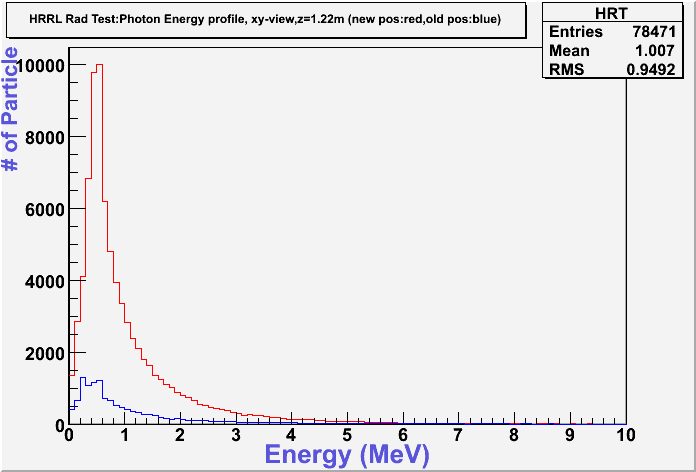
Energy Profile Comparison between Old and New Positions
New position:red color.
Old position:blue color.
Photon
Photon: xy-plane view
 These are the photons coming through the opening?
 Yes, these 2 detectors are very thin (1 micron thick). One is thin on z direction, gives xy-plane view, at the operator side of wall8. Another one is thin on x direction, gives yz-plane view, at the accelerator side of the room.
These are the photons coming through the wall?
Photon: yz-plane view
Electron
Electron: xy-plane view
Electron: yz-plane view
Energy/incident electron
For each graph determine the total energy deposited per incident electron for the two configurations then take the ratio.
New Position
Electron gun fired 10 million times, and the electron beam energy is 10 MeV.
xy-view:
Total Photon Energy (if(evt.ID==22) Ek_g_t +=evt.Ek;) = 79020.5; Energy deposited per electron is: 79020.5 / 10 000 000 = 0.00790205 MeV/Electron;
Total Electron Energy (if(evt.ID==11) Ek_e_t +=evt.Ek;) = 102820; Energy deposited per electron is: 102820 / 10 000 000 = 0.0102820 MeV/Electron;
Combined: (79020.5 + 102820)/10 000 000 = 0.01818405
yz-view:
Total Photon Energy (if(evt.ID==22) Ek_g_t +=evt.Ek;) = 332712; Energy deposited per electron is: 332712 / 10 000 000 = 0.0332712 MeV/Electron;
Total Electron Energy (if(evt.ID==11) Ek_e_t +=evt.Ek;) = 232201; Energy deposited per electron is: 232201 / 10 000 000 = 0.0232201 MeV/Electron;
Old Position
Electron gun fired 10 million times, and the electron beam energy is 10 MeV.
xy-view:
Total Photon Energy (if(evt.ID==22) Ek_g_t +=evt.Ek;) = 12397.2; Energy deposited per electron is: 12397.2 / 10 000 000 = 0.00123972 MeV/Electron;
Total Electron Energy (if(evt.ID==11) Ek_e_t +=evt.Ek;) = 8670.29; Energy deposited per electron is: 8670.29 / 10 000 000 = 0.000867029 MeV/Electron;
Combined: (12397.2 + 8670.29)/10000000 = 0.002106749
yz-view:
Total Photon Energy (if(evt.ID==22) Ek_g_t +=evt.Ek;) = 286124; Energy deposited per electron is: 286124 / 10 000 000 = 0.0286124 MeV/Electron;
Total Electron Energy (if(evt.ID==11) Ek_e_t +=evt.Ek;) = 78727.9; Energy deposited per electron is: 78727.9 / 10 000 000 = 0.00787279 MeV/Electron;
Ratio of new to old position
Following table gives
| photon | electron | combined | |
| xy-view | 0.00790205/0.00123972 = 6.4 | 0.0102820/0.000867029 = 1.2 | 0.01818405/0.002106749= 8.6 |
| yz-view | 0.0332712/0.0286124 =1.2 | 0.0232201/0.00787279 = 2.9 |
Lead Shielding around HRRL in New Positon
Pb Wall is as Tall as Electron Beam
Lead wall is 3-inch (10.16 cm) thick.
45 degree view
Top view
Side view
Simulation Results
Note: Electron and photon are differentiated.
Door view:
Side Wall view:
Deposited energy -vs Pb thickness
Consider draping a lead blanket which covers from the accelerator exit port to the Tungsten converter. We have a few such blankets down in the HRRL. Go see how thick they are and then simulate the thickness with one blanket then with two.
Plot the total energy deposited by photons and separately electrons for at least 3 Pb thicknesses, one of which is 3".
Pb Wall is as Tall as Ceiling
Simulation Results
Note: Electron and photon are differentiated.
Door view:
Side Wall view:
Cylindrical Pb Shielding around Target Increment Test
The thickness of lead sheets in the accelerator room is around 6 mm. We desire to use this lead sheets as shielding to shield HRRL in new position. So, I run simulation to study the change in radiation as thickness of shielding increase by 1 increment.
Make the units Energy /electron
Increment Test
Lead shielding was increased from 1 16 times of thickness of lead sheet.
Increment Test
Lead shielding was increased from 1 to 16 times of thickness of lead sheet.
Fill in the two rows below
Simulation for corrected HRRL and Target position
After shifting origin of the coordinate system from one corner of the Wall#1 to the other corner, I forgot to shift position of the HRRL and target. Here, I want to correct position of HRRL and target in simulation and run the increment test again.
HRRL will be bolt the wall, so on z-axis it is very simple to place electron source, it is just radius of the HRRL. On x-axis, the length of the HRRL is 5 feet. If we subtract the distance between wall#1 and wall#6, which is 24.1 cm, we will have the position of electron source. This distance 128.3 cm. If we allow 5 cm distance for wires etc, then electron source should be placed 133.3 cm.
The converter should be placed electron beam axis, which will have same z-coordinates as electron beam source in simulation. However, on x-axis, we have 2 Q1B after HRRL. Each Q1B has thickness of 24 cm. If we allow spacing of 2 cm between them, we will have 50 cm of distance taken up by these 2 quad sets. We would like to place converter 10 cm after the quads. Converter finally end up at 193.3 cm (133.3cm+50cm+10cm) on x-axis.
