Difference between revisions of "10-31-08 GEM HRRL Photon Runs"
(→Run 2) |
|||
| (109 intermediate revisions by the same user not shown) | |||
| Line 2: | Line 2: | ||
| − | A1 - | + | {| border="3" cellpadding="20" cellspacing="0" |
| − | A2 - | + | | Cell Cable Number || GEM Strip # || Counting House Cable # || List File ADC # |
| − | A3 - | + | |- |
| − | A4 - | + | |A1 || 13 || B1 || 3 |
| − | A6 - | + | |- |
| − | A7 - | + | |A2 || 11 || B2 || |
| − | A8 - | + | |- |
| − | A9 | + | |A3 || Trig || B3 || |
| + | |- | ||
| + | |A4 || 2 || B4 || | ||
| + | |- | ||
| + | |A6 || 16 || B6 || | ||
| + | |- | ||
| + | |A7 || 8 || B7 || | ||
| + | |- | ||
| + | |A8 ||5 || B8 || | ||
| + | |- | ||
| + | |A9 ||NaI || B9 || | ||
| + | |} | ||
| Line 15: | Line 26: | ||
| − | =Run | + | =Run 0= |
GEM Backgrnd.mpa | GEM Backgrnd.mpa | ||
| Line 22: | Line 33: | ||
HRRL : E = 14 MeV, I =0 | HRRL : E = 14 MeV, I =0 | ||
| + | |||
| + | 5 minutes long | ||
| + | |||
| + | =Run 1= | ||
| + | |||
| + | Run1.mpa | ||
| + | |||
| + | GEM HV : VDrif = 3850, VGem = 3550 | ||
| + | |||
| + | HRRL : E = 14 MeV, I =20mA | ||
| + | |||
| + | |||
| + | ADC 1D has clear second peak at channel 150 but ADC1 does not. Lets Observe ADC 1D as a function of position. This corresponds to GEM output strip 13. | ||
5 minutes long | 5 minutes long | ||
| Line 28: | Line 52: | ||
Run2.mpa | Run2.mpa | ||
| + | |||
| + | GEM HV : VDrif = 3550, VGem = 3550 | ||
| + | |||
| + | HRRL : E = 14 MeV, I =20mA | ||
| + | |||
| + | 5 minutes long | ||
| + | |||
| + | |||
| + | I see a second peak on ADC1D but it is at channels 100 and not 150. | ||
| + | |||
| + | =Run 3= | ||
| + | |||
| + | Run3.mpa | ||
| + | |||
| + | GEM HV : VDrif = 3550, VGem = 3550 | ||
| + | |||
| + | HRRL : E = 14 MeV, I =20mA | ||
| + | |||
| + | 3 minutes long | ||
| + | |||
| + | Unplug NaI and peak resumes near 150 channels | ||
| + | |||
| + | =Run 4= | ||
| + | |||
| + | Run4.mpa | ||
| + | |||
| + | GEM HV : VDrif = 3850, VGem = 3550 | ||
| + | |||
| + | HRRL : E = 14 MeV, I =20mA | ||
| + | |||
| + | |||
| + | Now turn the detector on with the beam current on and I see a peak around 150 channels again. | ||
| + | |||
| + | 3 minutes long. OOOPPPs left DAQ running while we moved the detector. Only look at first 3 minutes. | ||
| + | |||
| + | Pin 13 was located 63 cm from the mounting bracket horizontal cross bar. | ||
| + | |||
| + | =Run 5= | ||
| + | |||
| + | Run5.mpa | ||
GEM HV : VDrif = 3850, VGem = 3550 | GEM HV : VDrif = 3850, VGem = 3550 | ||
| Line 34: | Line 98: | ||
| − | + | Now move the detector away from the photons. | |
| + | |||
| + | Pin 13 is a distance of 22 cm from the mounting bar moved 41 cm from its original location at | ||
| + | 63 cm | ||
| + | |||
| + | =Run 6= | ||
| + | |||
| + | Run6.mpa | ||
| + | |||
| + | GEM HV : VDrif = 3850, VGem = 3550 | ||
| + | |||
| + | HRRL : E = 14 MeV, I =20mA | ||
| + | |||
| + | |||
| + | Now move the detector away from the photons. | ||
| + | |||
| + | Pin 13 is a distance of 43 cm from the mounting bar moved 20 cm from its original location at | ||
| + | 63 cm | ||
| + | |||
| + | Start 4:36 | ||
| + | End 4:39 | ||
| + | =Run 7= | ||
| + | |||
| + | Run7.mpa | ||
| + | |||
| + | GEM HV : VDrif = 3850, VGem = 3550 | ||
| + | |||
| + | HRRL : E = 14 MeV, I =20mA | ||
| + | |||
| + | |||
| + | Now move the detector away from the photons. | ||
| + | |||
| + | Pin 13 is a distance of 33 cm from the mounting bar moved 30 cm from its original location at | ||
| + | 63 cm | ||
| + | |||
| + | Start 5:51 | ||
| + | End 5:54 | ||
| + | =Run 8= | ||
| + | |||
| + | Run8.mpa | ||
| + | |||
| + | GEM HV : VDrif = 3850, VGem = 3550 | ||
| + | |||
| + | HRRL : E = 14 MeV, I =20mA | ||
| + | |||
| + | |||
| + | Now move the detector away from the photons. | ||
| + | |||
| + | Pin 13 is a distance of 54 cm from the mounting bar moved 9 cm from its original location at | ||
| + | 63 cm | ||
| + | |||
| + | Start : 5.03 | ||
| + | End : 5:07 | ||
| + | |||
| + | =Analysis= | ||
| + | |||
| + | ==Background -vs -signal== | ||
| + | |||
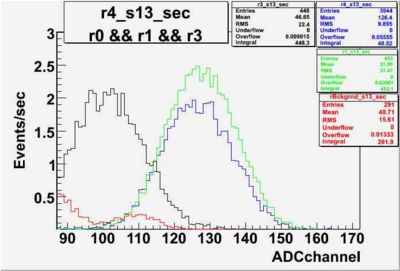
| + | The graph below shows the observed rate from strip 13 of the GEM detector when the ionization signal was turned off. The signal from ionizing radiation was turned off in 2 ways. First the beam current was turned off (Run 0) and the output of the detector was measured while the RF was left on. Next the detector drift high voltage was lowered to the same voltage as the GEM HV (Run 3) in order to reduce the number of ionized electrons traveling to the charge collector for readout. The data from run 1 and run 4 was used illustrate the output of the GEM detector under normal running conditions. | ||
| + | |||
| + | |||
| + | |||
| + | {| border="3" cellpadding="20" cellspacing="0" | ||
| + | |Run Number || DriftHV(Volts) || Incident Photon Energy(MeV) || Current(mA)|| Run Time(seconds) || Histogram || Peak || Rate(per minute) | ||
| + | |- | ||
| + | |Background(0) || 3850 || 14 || 0 || ~300??? ||[[Image:GEM_HRRL_Strip13_runBackgrnd_10-31-08.jpg|100px]] || [[Image:GEM_HRRL_Strip13_runBackgrnd_10-31-08_1.jpg|100px]] || 210.4 ????? | ||
| + | |- | ||
| + | | 1 || 3850 || 14 || 20 || 302.902 || [[Image:GEM_HRRL_Strip13_run1_10-31-08.jpg|100px]] || [[Image:GEM_HRRL_Strip13_run1_10-31-08_1.jpg|100px]] || 3642.8 | ||
| + | |- | ||
| + | | 2 || 3550 || 14 || 20 || 243.588 || [[Image:GEM_HRRL_Strip13_run2_10-31-08.jpg|100px]] || [[Image:GEM_HRRL_Strip13_run2_10-31-08_1.jpg|100px]] || 1290.5 | ||
| + | |- | ||
| + | | 3 || 3550 || 14 || 20 || 110.93 || [[Image:GEM_HRRL_Strip13_run3_10-31-08.jpg|100px]] || [[Image:GEM_HRRL_Strip13_run3_10-31-08_1.jpg|100px]] || 3401.1 | ||
| + | |- | ||
| + | | 4|| 3850 || 14 || 20 || 180 || [[Image:GEM_HRRL_Strip13_run_4_10-31-08.jpg|100px]] || [[Image:GEM_HRRL_Strip13_run_4_10-31-08_1.jpg|100px]] || 2906 | ||
| + | |}<br> | ||
| + | |||
| + | |||
| + | [[Image:Overlay_histogram_of_runs_0_1_2_3.jpg|400px]][[Image:Overlay_histogram_of_runs_0_1_2_3_Peaks.jpg|400px]]<br> | ||
| + | |||
| + | [[Image:Overlay_histogram_of_runs_0_1_3_Peaks.jpg|500px]]<br> | ||
| + | |||
| + | |||
| + | [[Image:Overlayed_histograms_of_runs_0_1_3_4_Peaks.jpg|400px]][[Image:Overlayed_histograms_of_runs_1_4_Peaks.jpg|400px]]<br> | ||
| + | |||
| + | ==Position -vs Rate== | ||
| + | |||
| + | {| border="3" cellpadding="20" cellspacing="0" | ||
| + | | Run Number || Distance From max Rate(cm) || Run Time(seconds) || Strip 13 Rate X 1000(per event <math>\times</math>)||Strip 13 Rate per minute|| Histogram || Histogram(Zoomed In) | ||
| + | |- | ||
| + | | 1|| 0 || 302.902 || 134 || 3642 || [[Image:GEM_HRRL_Strip13_run1_10-31-08.jpg|100px]] || [[Image:GEM_HRRL_Strip13_run1_10-31-08_1.jpg|100px]] | ||
| + | |- | ||
| + | | 5|| 41 || 115.088 || 4.04 || 2868 || [[Image:GEM_HRRL_Strip13_run5_10-31-08.jpg|100px]] || [[Image:GEM_HRRL_Strip13_run5_10-31-08_1.jpg|100px]] [[Image:GEM_HRRL_Strip13_run5_10-31-08_2.jpg|100px]] | ||
| + | |- | ||
| + | | 6|| 20 || 255.833 || 143.3 || 2910 || [[Image:GEM_HRRL_Strip13_run6_10-31-08.jpg|100px]] || [[Image:GEM_HRRL_Strip13_run6_10-31-08_1.jpg|100px]] | ||
| + | |- | ||
| + | | 7|| 30 || 172.042 || 155.5 || 2934 || [[Image:GEM_HRRL_Strip13_run7_10-31-08.jpg|100px]] || [[Image:GEM_HRRL_Strip13_run7_10-31-08_1.jpg|100px]] | ||
| + | |- | ||
| + | | 8|| 9 || 250.657 || 183.1 || 3612 || [[Image:GEM_HRRL_Strip13_run8_10-31-08.jpg|100px]] || [[Image:GEM_HRRL_Strip13_run8_10-31-08_1.jpg|100px]] | ||
| + | |}<br> | ||
| + | |||
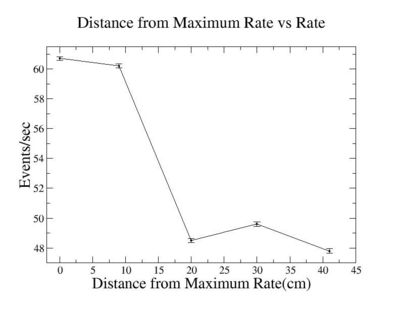
| + | The rate is above 60 Hz suggesting that the sampling ADC must have been measuring events outside the 60 Hz beam pulse. The rate fluctuations beyond the 20 cm distance may indicate instabilities in the beam. | ||
| + | |||
| + | [[Image:GEM_HRRL_Strip13_Result_10-31-08_distance_from_maximum_rate_vs_rate_events_per_second.jpg|400px]]<br> | ||
| + | |||
| + | =Summary= | ||
| + | |||
| + | The above measurements indicate that the GEM detector responds to ionization radiation generated when a 14 MeV HRRL electron beam produces bremsstrahlung photons in a 1 mm beam exit window which are then collimator using a 4" wide lead brick wall with 1 mm thick shims place in between 2 lead bricks in order to produce a horizontal fan of photons. It was also clear that the detector rate decreases when moved away from the collimated photon beam. A clear separation was possible between the RF noise pickup on the detector and an ionzation signal when using the fast timing amplifier from ORTEC (Model 474, Maximum Gain setting X20). | ||
| + | |||
| + | Needs for the next test: | ||
| + | |||
| + | 1.) A collimated electron beam using the 1 mm diameter aluminum brick as the primary collimator and the finger scintillator as the electron trigger | ||
| + | |||
| + | |||
| + | 2.) A translation stage from the IAC to remotely move the GEM detector and test its position dependence. | ||
| − | + | 3.) At least 9 ADC channels to measure the strip output. The CAEN ADCs in the VME DAQ system should have the sensitivity to measure the GEM output without the large amount of amplification used in the runs above. | |
| − | [ | + | [[GEM HRRL Photons]] |
Latest revision as of 07:52, 7 December 2008
The Goal today is to observe position dependence of photons on the GEM detector
| Cell Cable Number | GEM Strip # | Counting House Cable # | List File ADC # |
| A1 | 13 | B1 | 3 |
| A2 | 11 | B2 | |
| A3 | Trig | B3 | |
| A4 | 2 | B4 | |
| A6 | 16 | B6 | |
| A7 | 8 | B7 | |
| A8 | 5 | B8 | |
| A9 | NaI | B9 |
B1 -> ADC1A
Run 0
GEM Backgrnd.mpa
GEM HV : VDrif = 3850, VGem = 3550
HRRL : E = 14 MeV, I =0
5 minutes long
Run 1
Run1.mpa
GEM HV : VDrif = 3850, VGem = 3550
HRRL : E = 14 MeV, I =20mA
ADC 1D has clear second peak at channel 150 but ADC1 does not. Lets Observe ADC 1D as a function of position. This corresponds to GEM output strip 13.
5 minutes long
Run 2
Run2.mpa
GEM HV : VDrif = 3550, VGem = 3550
HRRL : E = 14 MeV, I =20mA
5 minutes long
I see a second peak on ADC1D but it is at channels 100 and not 150.
Run 3
Run3.mpa
GEM HV : VDrif = 3550, VGem = 3550
HRRL : E = 14 MeV, I =20mA
3 minutes long
Unplug NaI and peak resumes near 150 channels
Run 4
Run4.mpa
GEM HV : VDrif = 3850, VGem = 3550
HRRL : E = 14 MeV, I =20mA
Now turn the detector on with the beam current on and I see a peak around 150 channels again.
3 minutes long. OOOPPPs left DAQ running while we moved the detector. Only look at first 3 minutes.
Pin 13 was located 63 cm from the mounting bracket horizontal cross bar.
Run 5
Run5.mpa
GEM HV : VDrif = 3850, VGem = 3550
HRRL : E = 14 MeV, I =20mA
Now move the detector away from the photons.
Pin 13 is a distance of 22 cm from the mounting bar moved 41 cm from its original location at 63 cm
Run 6
Run6.mpa
GEM HV : VDrif = 3850, VGem = 3550
HRRL : E = 14 MeV, I =20mA
Now move the detector away from the photons.
Pin 13 is a distance of 43 cm from the mounting bar moved 20 cm from its original location at 63 cm
Start 4:36 End 4:39
Run 7
Run7.mpa
GEM HV : VDrif = 3850, VGem = 3550
HRRL : E = 14 MeV, I =20mA
Now move the detector away from the photons.
Pin 13 is a distance of 33 cm from the mounting bar moved 30 cm from its original location at 63 cm
Start 5:51 End 5:54
Run 8
Run8.mpa
GEM HV : VDrif = 3850, VGem = 3550
HRRL : E = 14 MeV, I =20mA
Now move the detector away from the photons.
Pin 13 is a distance of 54 cm from the mounting bar moved 9 cm from its original location at 63 cm
Start : 5.03 End : 5:07
Analysis
Background -vs -signal
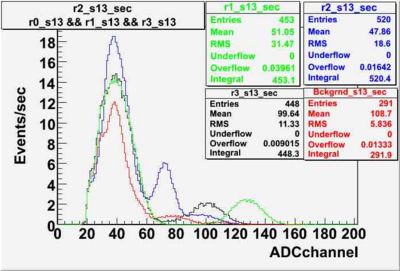
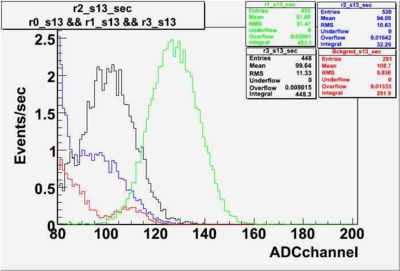
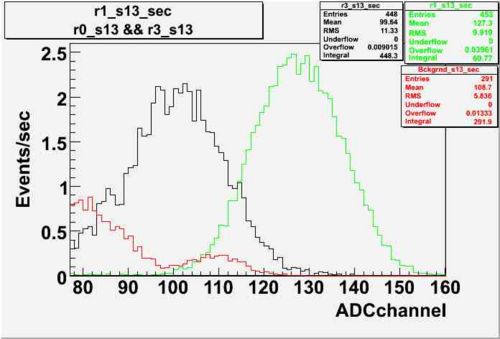
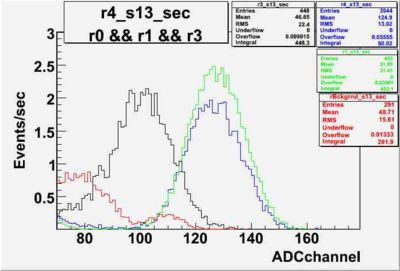
The graph below shows the observed rate from strip 13 of the GEM detector when the ionization signal was turned off. The signal from ionizing radiation was turned off in 2 ways. First the beam current was turned off (Run 0) and the output of the detector was measured while the RF was left on. Next the detector drift high voltage was lowered to the same voltage as the GEM HV (Run 3) in order to reduce the number of ionized electrons traveling to the charge collector for readout. The data from run 1 and run 4 was used illustrate the output of the GEM detector under normal running conditions.
Position -vs Rate
The rate is above 60 Hz suggesting that the sampling ADC must have been measuring events outside the 60 Hz beam pulse. The rate fluctuations beyond the 20 cm distance may indicate instabilities in the beam.
Summary
The above measurements indicate that the GEM detector responds to ionization radiation generated when a 14 MeV HRRL electron beam produces bremsstrahlung photons in a 1 mm beam exit window which are then collimator using a 4" wide lead brick wall with 1 mm thick shims place in between 2 lead bricks in order to produce a horizontal fan of photons. It was also clear that the detector rate decreases when moved away from the collimated photon beam. A clear separation was possible between the RF noise pickup on the detector and an ionzation signal when using the fast timing amplifier from ORTEC (Model 474, Maximum Gain setting X20).
Needs for the next test:
1.) A collimated electron beam using the 1 mm diameter aluminum brick as the primary collimator and the finger scintillator as the electron trigger
2.) A translation stage from the IAC to remotely move the GEM detector and test its position dependence.
3.) At least 9 ADC channels to measure the strip output. The CAEN ADCs in the VME DAQ system should have the sensitivity to measure the GEM output without the large amount of amplification used in the runs above.


