Difference between revisions of "Kalyan 23 May 08"
Jump to navigation
Jump to search
| (5 intermediate revisions by the same user not shown) | |||
| Line 1: | Line 1: | ||
| − | ==1== | + | =Table of Results= |
| − | =2 | + | |
| + | {| align="center" border="1" | ||
| + | |- | ||
| + | | || Deformation (mm) | ||
| + | |- | ||
| + | | Sector 1 || E Max || D Max || X Max || Y Max || Z Max | ||
| + | |- | ||
| + | | Hinges in the down stream side || 0.196 || 0.221 || 0.195 || 0.126|| -0.088 | ||
| + | |- | ||
| + | | Hinges in the up stream side || 0.198 || 0.222 || 0.192 || 0.137 ||-0.088 | ||
| + | |} | ||
| + | |||
| + | =Hinges on the downstream side= | ||
| + | |||
| + | |||
| + | The report generated by ANSYS is available: [[Image:Analysis_O_slice_1.pdf]] | ||
| + | |||
| + | |||
| + | |||
| + | |||
| + | {| align="center" | ||
| + | |- | ||
| + | |[[Image:R3_3D_viewpoint.jpg| 400 px]]||[[Image:R3_3D_Analysis_slice_O_1.png| 350 px]]||[[Image:R3_3D_Analysis_slice_O_1d.png| 600 px]] | ||
| + | |} | ||
| + | |||
| + | {| | ||
| + | |[[Image:R3_3D_Analysis_slice_O_1x.png| 410 px]]||[[Image:R3_3D_Analysis_slice_O_1y.png| 410 px]]||[[Image:R3_3D_Analysis_slice_O_1z.png| 410 px]] | ||
| + | |||
| + | |} | ||
| + | |||
| + | Figure 1: Images of Deflection for Sector 1 with hinges to the down stream side in D,X,Y,Z Directions respectively | ||
| + | |||
| + | =Hinges on the upstream side= | ||
| + | |||
| + | The report generated by ANSYS is available: [[Image:Analysis_O_slice_1a.pdf]] | ||
| + | |||
| + | |||
| + | {| align="center" | ||
| + | |- | ||
| + | |[[Image:R3_3D_viewpointa.jpg| 400 px]]||[[Image:R3_3D_Analysis_slice_O_1a.png| 350 px]]||[[Image:R3_3D_Analysis_slice_O_1da.png| 600 px]] | ||
| + | |} | ||
| + | |||
| + | {| | ||
| + | |[[Image:R3_3D_Analysis_slice_O_1xa.png| 410 px]]||[[Image:R3_3D_Analysis_slice_O_1ya.png| 410 px]]||[[Image:R3_3D_Analysis_slice_O_1za.png| 410 px]] | ||
| + | |||
| + | |} | ||
| + | |||
| + | Figure 2: Images of Deflection for Sector 1 with hinges to the upstream side in D,X,Y,Z Directions respectively | ||
| + | |||
| + | |||
| + | [http://www.iac.isu.edu/mediawiki/index.php/Progress_reports Go back to PROGRESS REPORTS] | ||
| + | |||
| + | [http://www.iac.isu.edu/mediawiki/index.php/R3 Go back to R3] | ||
Latest revision as of 10:23, 20 May 2008
Table of Results
| Deformation (mm) | |||||
| Sector 1 | E Max | D Max | X Max | Y Max | Z Max |
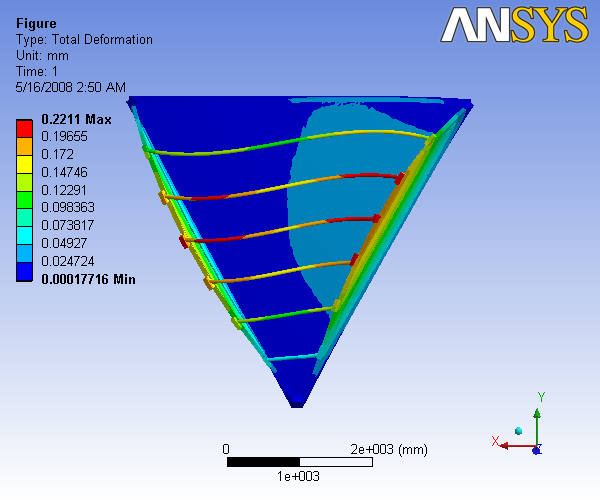
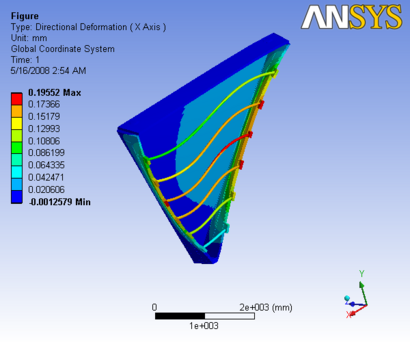
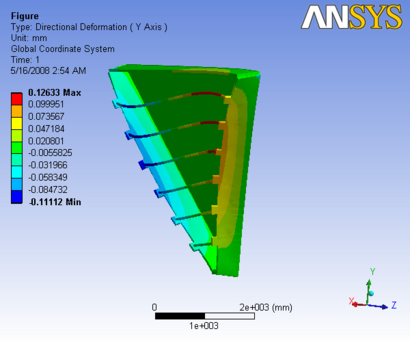
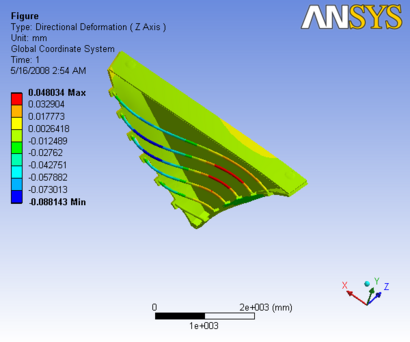
| Hinges in the down stream side | 0.196 | 0.221 | 0.195 | 0.126 | -0.088 |
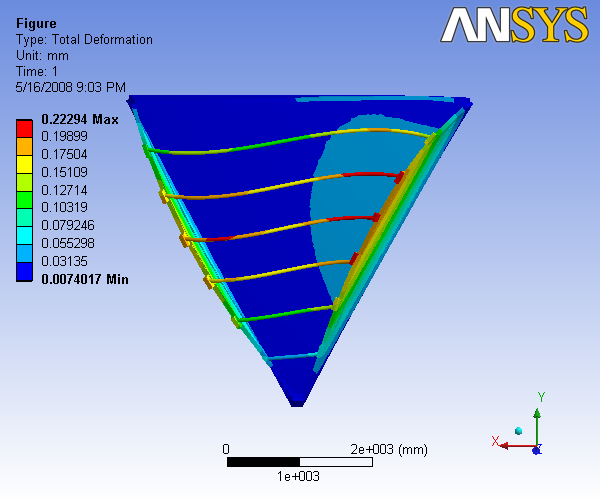
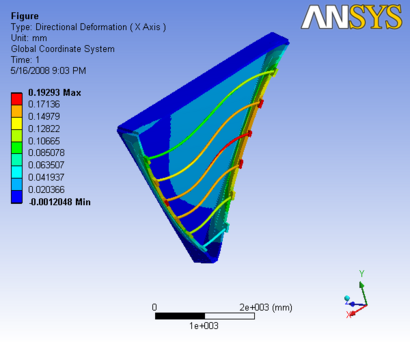
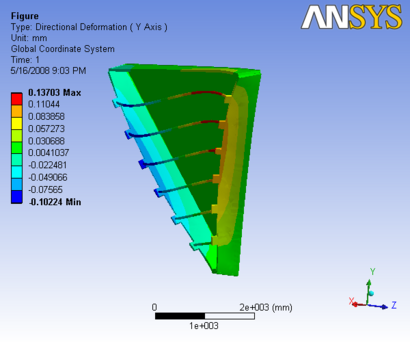
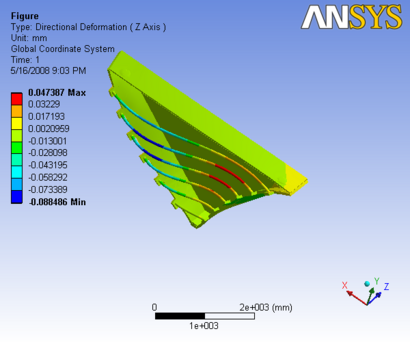
| Hinges in the up stream side | 0.198 | 0.222 | 0.192 | 0.137 | -0.088 |
Hinges on the downstream side
The report generated by ANSYS is available: File:Analysis O slice 1.pdf
 |
 |
|
 |
 |
|
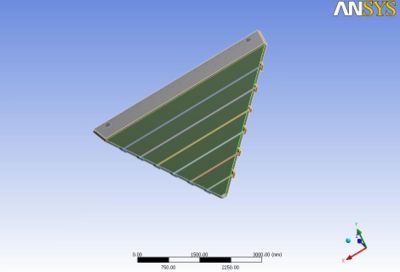
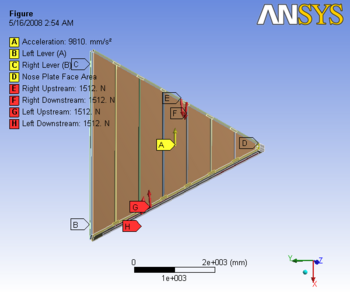
Figure 1: Images of Deflection for Sector 1 with hinges to the down stream side in D,X,Y,Z Directions respectively
Hinges on the upstream side
The report generated by ANSYS is available: File:Analysis O slice 1a.pdf
 |
 |
|
 |
 |
|
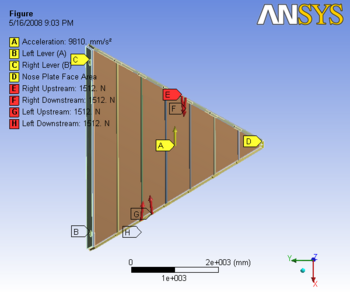
Figure 2: Images of Deflection for Sector 1 with hinges to the upstream side in D,X,Y,Z Directions respectively