Difference between revisions of "R3DC Report 2-08"
| (680 intermediate revisions by the same user not shown) | |||
| Line 1: | Line 1: | ||
=Introduction= | =Introduction= | ||
| − | + | The Region 3 Drift Chamber (R3 DC) conceptual design for the Hall-B 12-GeV upgrade (CLAS12) is described below. One of the design objectives is to achieve nearly full acceptance, in the lab frame, for relativistic forward-boosted final-state particles while maintaining a momentum resolution of 0.5 to 1% for a 5-GeV charged particle. | |
| + | Six identical R3 DCs are presently located 4.7 meters from the target and together will have a <math>2\pi</math> azimuthal coverage and presently span from 5 to 45 degrees in polar angle as measured from the direction of the electron beam. The central plane through the R3 DC will be tilted 25 degrees from a perpendicular to the beam line towards the target. The shadow of the toroidal coils will result in a minimum gap of 16 cm between each R3 DC and will hinder reconstructing the trajectory of scattered particles in that region. This space will house the readout boards, attendant electronics, cabling, etc. The active area for each R3 DC will then be [60 - ?] in azimuth, | ||
| − | The | + | The R3 DC design for CLAS12 is based on the successful hexagonal cell structure of the current CLAS R3 DC. The design criteria is delineated below: |
| − | + | #Smaller cell size of 2.07 cm to accommodate a luminosity of <math>10^{35} /(cm^2 s^1)</math> and maintain an accidental occupancy of less the 4% for high tracking efficiency.. | |
| − | |||
| − | #Smaller cell size of 2.07 cm to accommodate a luminosity of | ||
#Sense wires will be increased to 30 um from the current 20 um diameter. This means that the wire will require a higher tension to offset droop and electrostatic forces. | #Sense wires will be increased to 30 um from the current 20 um diameter. This means that the wire will require a higher tension to offset droop and electrostatic forces. | ||
#All wires in each superlayer will lie in a plane instead of on a cylindrical surface. The staggered by one half cell or “brick wall pattern” of the hexagonal cells will be maintained for each successive layer. | #All wires in each superlayer will lie in a plane instead of on a cylindrical surface. The staggered by one half cell or “brick wall pattern” of the hexagonal cells will be maintained for each successive layer. | ||
| − | #To enhance the azimuthal (φ) resolution, each superlayer will be +/- stereo, i.e. the pitch will be + | + | #To enhance the azimuthal (φ) resolution, each superlayer will be +/- stereo, i.e. the pitch will be +6 degrees in the six layers of the first superlayer and the pitch will be -6 degrees for the second superlayer array of six wire planes. The current R3 DC has 0 and 6 degree pitch respectively for the two superlayers. |
#There will be a total of 4928 wires of which 1344 (check this) will be sense wires. | #There will be a total of 4928 wires of which 1344 (check this) will be sense wires. | ||
| − | # | + | #The endplates will be oriented at 60 degrees with respect to one another. Precisely holes will be drilled into each endplate with tolerance of better than 100 um for the placement of the drift chamber wires. Feed through assemblies are placed in these holes to precisely position the sense, field, and guard wires. The expected overall position accuracy will be 250 um per layer, with a wire location accuracy of 200 um. |
#The deflection along the length of the endplates may not exceed 50 um. | #The deflection along the length of the endplates may not exceed 50 um. | ||
#The R3 DCs will be supported from only two points at the outer backplane. This makes the R3 DCs self supporting. | #The R3 DCs will be supported from only two points at the outer backplane. This makes the R3 DCs self supporting. | ||
| Line 20: | Line 19: | ||
=R3 Description= | =R3 Description= | ||
==Geometry== | ==Geometry== | ||
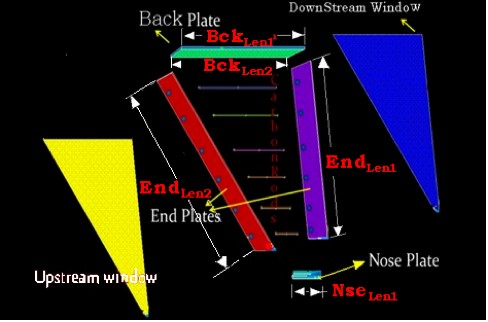
| − | An exploded view of a single R3 sector is shown below. The back plate, nose plate, and two | + | An exploded view of a single R3 sector is shown below. The back plate, nose plate, and two endplates (see Figure 2.1) represent the key components to the main ionization chamber structure. The back plate is approximately 5 meters long and will likely have two mount points on the backplate to support and position the drift chambers. The nose plate, which is more than half of a meter long, will hold a ball joint that mounts to a hexagonal ring and constrains the chamber location at a third point. The drift chamber wires are fixed by the endplates and spanning between the endplates are carbon-fiber rods located in the gap near the chamber entrance. These rods reduce endplate deflection arising from the pull from the wire tension, the weight of the chamber, and the differential gas pressure between the chamber and the experimental hall. The front face of the chamber has a thin window so as to present mimimal mass in the path of the charged particles and hence reduce the attendant multiple scattering. The exit window of the chamber is constructed out of ''Hexcel'', a composite |
| − | + | honeycomb material, clad with a thin sheet of carbon fiber. This window is so designed as reduce endplate deflections near the back of the chamber. Figure 1.2 shows the side view of a single sector; six of these sectors are oriented around a beam pipe, as shown in Figure 2.3. | |
| + | |||
| − | [[Image:R3BreakOutDiagram.jpg]][[Image:R3AllSectors.jpg]] | + | {| align="center" border="0" |
| + | |- | ||
| + | |[[Image:R3BreakOutDiagram.jpg]] || | ||
| + | {| border="1" |cellpadding="20" cellspacing="0 | ||
| + | |- | ||
| + | |label || Distance (mm) | ||
| + | |- | ||
| + | | <math>Bck_{Len1}</math> || 5004.92 | ||
| + | |- | ||
| + | | <math>Bck_{Len2}</math> || 4840.04 | ||
| + | |- | ||
| + | | <math>End_{Len1}</math> || 4830.17 | ||
| + | |- | ||
| + | | <math>End_{Len2}</math> || 4665.1 | ||
| + | |- | ||
| + | | <math>Nse_{Len1}</math> || 614 | ||
| + | |} | ||
| + | |- | ||
| + | | Figure 2.1: The general features of a R3 Drift Chamber. The chamber wires strung between the endplates are not depicted. The relevant variables for the figurs are tabulation in the Parameter Tables. | ||
| + | |} | ||
| + | |||
| + | |||
| + | {| align="center" border="0" | ||
| + | |- | ||
| + | |[[Image:R3_SideView.jpg | 400 px]] || | ||
| + | {| border="1" |cellpadding="20" cellspacing="0 | ||
| + | |- | ||
| + | |label || value | ||
| + | |- | ||
| + | | <math>D_1</math> || 4765.6 mm | ||
| + | |- | ||
| + | | <math>\theta_1</math> || 5 degrees | ||
| + | |- | ||
| + | | <math>\theta_2</math> || 45 degrees | ||
| + | |- | ||
| + | | <math>\theta_3</math> || 25 degrees | ||
| + | |} | ||
| + | |- | ||
| + | | Figure 2.2: A side view of a R3 drift chamber. The distance from the target center to the first sense wire is labeled <math>D_1</math>. The min and max acceptance angles are labeled <math>\theta_1</math> and <math>\theta_2</math> respectively. The tilt angle with respect to a normal to the beam line is labeled <math>\theta_3</math>. | ||
| + | |} | ||
| + | |||
| + | <br> | ||
| + | |||
| + | {| align="center" border="0" | ||
| + | |- | ||
| + | |[[Image:R3AllSectors.jpg]] || [[Image:R3_Gap.jpg]] | ||
| + | |- | ||
| + | | Figure 2.3: View in the direction of the beamline; this shows the symmetrical azimuthal arrangement of the six R3 chambers. | ||
| + | |} | ||
| + | |||
| + | |||
| + | [http://www.jlab.org/~mestayer/upgrade/dclayout.xls Mestayer's Geometry Excel Spreadsheet] | ||
==Material Specifications== | ==Material Specifications== | ||
| − | {| border="1" |cellpadding="20" cellspacing="0 | + | Physical properties germane to the materials used to construct the R3 dirft chambers are shown below in Table 1. Endplates for the R3 drift chambers in the previous 6 GeV CLAS detector were fabricated by gluing thin (0.048 inch) stainless steel sheets onto both sides of a 2-inch Polyeurethane foam. The current design expects to use the same structure for the endplates. The use of carbon fiber rods to minimize end plate deflections is another design feature boldly borrowed from the previous 6-GeV CLAS detector design. Aluminum is included below as a cadidate material for capping the edges of the endplates. |
| + | |||
| + | |||
| + | Table 1. Material Properties of R3 Components. | ||
| + | |||
| + | {| border="1" |cellpadding="20" cellspacing="0 | ||
|- | |- | ||
|Material || Youngs Modulus|| Density | |Material || Youngs Modulus|| Density | ||
| Line 35: | Line 91: | ||
| Polyeurethane Foam FR-3700|| <math>1.4 \times 10^8</math> || 240 | | Polyeurethane Foam FR-3700|| <math>1.4 \times 10^8</math> || 240 | ||
|- | |- | ||
| − | | Stainless Steel|| <math>2.1 \times 10^{11}</math> || | + | | Stainless Steel|| <math>2.1 \times 10^{11}</math> || 8030 |
|- | |- | ||
| − | | | + | | Carbon Fiber Rods|| <math>1.5 \times 10^{11}</math> || 580 |
|- | |- | ||
| − | | | + | | Aluminum||<math> 7\times 10^{10}</math> || 2700 |
| + | |} | ||
| + | |||
| + | == Approximate Chamber mass == | ||
| + | |||
| + | |||
| + | Table 2. Chamber mass | ||
| + | |||
| + | {| border="1" |cellpadding="20" cellspacing="0 | ||
| + | |- | ||
| + | |Part || Dimensions|| || || Density (<math>\frac{kg}{m^3}</math>)|| Mass (kg) || Mass (lbs) | ||
| + | |- | ||
| + | | End Plate Polyeurethane Foam FR-3700||5 m || 0.5 m || 0.05 m||240 || 30 || | ||
| + | |- | ||
| + | | End Plate Stainless Steel ||5 m ||0.5 m || 0.001 m||8030 || 20 kg | ||
| + | |- | ||
| + | | Back Plate Aluminum || 5m || 0.5 m || 0.051 || 2700 || 344 kg | ||
| + | |- | ||
| + | | Nose Plate Aluminum || 0.5m || 0.15 m || 0.1 || 2700 || 20 kg | ||
| + | |} | ||
| + | |||
| + | |||
| + | Total mass for end plates and Back plate made from Poly+SS composite = 120 kg | ||
| + | Total mass for composite end plate and aluminum Back plate = 464 kg | ||
| + | Aluminum frame around poly is 20 mm inner width (5 m x 0.5 m x 0.05 m) = | ||
| + | |||
| + | ==End Plates and Nose Plate Drawings== | ||
| + | |||
| + | Preliminary drawings of the end plates (Figure 2.4) and nose plate (Figure 2.5) are shown below. The end plate and nose plate are two critical parts of the chamber. The end plate will provide the support to constrain the detector wires in space whereas the nose plate will determine the tilt angle of the detector and provide a mounting connection. | ||
| + | |||
| + | {| align="center" border="0" | ||
| + | |- | ||
| + | |[[Image:EndPlateDrawing_2-08.jpg | 600 px]][[Image:New_EndPlateDrawing_4-08.jpg | 600 px]] | ||
| + | |- | ||
| + | | Figure 2.4: A preliminary End plate design for R3 Drift Chamber. | ||
|} | |} | ||
| − | == | + | |
| − | [[Image:NosePlateDrawing_2-08.jpg | 400 px]] | + | {| align="center" border="0" |
| + | |- | ||
| + | |[[Image:NosePlateDrawing_2-08.jpg | 400 px]] | ||
| + | |||
| + | |- | ||
| + | | Figure 2.5: A preliminary Nose plate design for R3 Drift Chamber. | ||
| + | |} | ||
=Endplate Deflection= | =Endplate Deflection= | ||
| + | ==Wire tension == | ||
| + | |||
| + | The drift chamber wires are oriented at 6 degrees with respect to the horizontal, as shown in the Figure 3.1. Wires which slope downward from left to right make an angle of <math>\theta_2 = 90^{\circ}-30^{\circ}-6^{\circ} = 54^{\circ}</math> with respect to a perpendicular to the endplate and have a force component along the perpendicular of <math>T_{1} = T \sin(54^{\circ})</math>. Wires which slope upward from left to right make an angle with repect to the perpendicular to the endplate of <math>\theta_3 = 90^{\circ} + 30^{\circ} - 6^{\circ} = 114^{\circ}</math>. If ''T'' represents the tension in the wire, then the component of this force perpendicular to the endplate is <math>T_{2}=T \sin(180^{\circ}-\theta_3) = T \sin(66^{\circ})</math>. The net force perpendicular to the endplate will be <math>T( \sin(66^{\circ}) + \sin(54^{\circ}))</math>. There are 112 sense wires in each of the 12 wire layers (2 super layers with 6 wire layers each)[Mestayer07]. Each sense wire is 30 microns in diameter and tensioned using a 20.7 g weight. There are 28 Field wire layers 140 microns in diameter with each wire tensioned at 63 grams and 4 guard wire layers 140 micron in diameter with each wire tensioned at 185 grams. The total tension from all wires on the endplate will be | ||
| + | |||
| + | |||
| + | <math>112 \left ( 12 \cdot 0.0207 kg + 28 \cdot 0.063 kg + 4 \cdot 0.185 kg \right ) \times 9.8 m/s^2 = 3024 N = 680 lbs</math>. | ||
| + | |||
| + | Therefore, | ||
| + | |||
| + | :<math>T_1 = \frac{3024}{2} \sin(54^{\circ}) =1223 N</math> | ||
| + | |||
| + | :<math>T_2 = \frac{3024}{2} \sin(66^{\circ}) =1381 N</math> | ||
| + | |||
| + | and | ||
| + | |||
| + | :<math>T_{perp} = T_1+T_2 = 2604 N</math> = perpendicular force on an endplate | ||
| + | |||
| + | {| align="center" border="0" | ||
| + | |- | ||
| + | |[[Image:TensionForceComponents.jpg]] | ||
| + | || | ||
| + | {| border="1" |cellpadding="20" cellspacing="0 | ||
| + | |- | ||
| + | |label || Value (Degrees) | ||
| + | |- | ||
| + | | <math>\theta</math> || 30 | ||
| + | |- | ||
| + | | <math>\theta_1</math> || 6 | ||
| + | |- | ||
| + | | <math>\theta_2</math> || 90 - <math>\theta</math> - <math>\theta_1</math> | ||
| + | |- | ||
| + | | <math>\theta_3</math> || 90 + <math>\theta</math> - <math>\theta_1</math> | ||
| + | |} | ||
| + | |- | ||
| + | | Figure 3.1: Sketch identifying the direction of the sense wire tension in terms of the <math>\theta</math> and <math>\theta_1</math>. | ||
| + | |} | ||
| + | |||
| + | |||
| + | <br> | ||
| + | |||
==Point Load Deflection== | ==Point Load Deflection== | ||
| − | The force on an endplate due only to the tension from the 4,928 wires is about 5700 N | + | A simple back-of-the-envelope calculation for deflection was performed assuming aluminum endplates and a point-load force (representing the distributed force from the wires into a single load). The force on an endplate due only to the tension from the 4,928 wires is about 5700 N /2. A simple calculation based on the definition of Young's modulus can yield an order-of-magnitude-level estimate for the deflection of an aluminum endplate in which the wires exert a force perpendicular to the endplate. The deflection <math>y</math> of the endplate in terms of Young's Modulus <math>(Y)</math> is given by the equation: |
:<math>Y \equiv \frac{F}{4wy} \left( \frac{l}{t}\right )^3</math> | :<math>Y \equiv \frac{F}{4wy} \left( \frac{l}{t}\right )^3</math> | ||
| Line 54: | Line 190: | ||
:<math>Y = 7 \times 10^{10}N/m^2 \equiv</math> Young's Modulus for Aluminum | :<math>Y = 7 \times 10^{10}N/m^2 \equiv</math> Young's Modulus for Aluminum | ||
| − | :<math>F = | + | :<math>F = 2850 N \equiv</math>point force/load |
:<math>w =0.526 m \equiv</math> width of the endplate | :<math>w =0.526 m \equiv</math> width of the endplate | ||
:<math>y \equiv</math> deflection of endplate due to point force | :<math>y \equiv</math> deflection of endplate due to point force | ||
| Line 60: | Line 196: | ||
:<math>t = 0.05 m \equiv</math> thickness of the endplate | :<math>t = 0.05 m \equiv</math> thickness of the endplate | ||
| − | + | By substituting in the above values and solvign the equation, a deflection of 7 mm is expected for a 5 cm thick aluminum endplate. If a 5 cm thick stainless steel <math>(Y=2.1 \times 10^{11} N/m^2 )</math> endplate were used, the deflection would decrease from 7 mm to 2.5 mm (due to the linear dependence of the deflection on the Young's Modulus). The previous work performed by Kevin Folkman at the IAC came to a similar conclusion. | |
==Distributed Load Deflection== | ==Distributed Load Deflection== | ||
| − | The endplate deflection | + | The endplate deflection calculations were refined to a more realistic case in which the load is distributed evenly along the endplate. The tension of the wires on the endplate was divided into three regions; W1,W2, and W3. As shown in Figure 3.3.1, the load W3 corresponds to a region along the endplate in which wires from both super layers are creating a load on the endplate. Loads W1 and W2 represent regions in which only a single super layer is causing a load. The endplate is "simply" supported in order to calculate the deflection. The term "simply supported" implies that one side (left side of an endplate for this case) may rotate but not translate (resulting in two reaction forces) whereas the other side (the right side of and endplate for this case) is supported such that it may rotate and translate (resulting in a single, normal reaction force). Figure 7 labels the loads as well as distances over which the loads are applied on the end plate. A total force of 340 lbs exerted by the drift chamber wires is decomposed into its components according to the angle made by the wire on the endplate. |
| − | [[Image:EndPlateDeflectionHandCalc.jpg]] | + | {| align="center" border="0" |
| − | + | |- | |
| + | |[[Image:EndPlateDeflectionHandCalc.jpg]] | ||
| + | || | ||
| + | {| border="1" |cellpadding="20" cellspacing="0 | ||
|- | |- | ||
|Label|| value | |Label|| value | ||
| Line 81: | Line 220: | ||
| e|| 273.88 mm | | e|| 273.88 mm | ||
|- | |- | ||
| − | | <math>W_1</math>|| 0. | + | | <math>W_1</math>|| 0.3=1223/(C+B) N/mm |
|- | |- | ||
| − | | <math>W_2</math>|| 0. | + | | <math>W_2</math>|| 0.61 N/mm |
|- | |- | ||
| − | | <math>W_3</math>|| 0. | + | | <math>W_3</math>|| 0.32 =1381/(C+D)N/mm |
|} | |} | ||
| + | |- | ||
| + | |Figure 3.3.1: A diagram of the loads on a simply supported endplate. The table to the right gives the load values and distances. | ||
| + | |} | ||
| + | |||
| + | |||
| + | |||
| + | The following calculations are in accordance to a standard approach covered in all undergraduate "Mechanics of Materials" engineering courses. This method is based on integrating the elastic curve equation for a beam. The equation of the elastic curve relates deflection (y) to Moments (M) at given linear locations along the beam (x): | ||
| + | |||
| + | |||
| + | :<math>\frac{d^2y}{dx^2} = \frac{M(x)}{E I_A}</math> | ||
| + | |||
| + | |||
| + | where <math>E</math> represents Young's Modulus and <math>I_A</math> is the Area Momentum of Inertia. The Area Moment of Inertis <math>(I_A)</math> is defined as the second moment of an area about a given axis: | ||
| + | |||
| + | |||
| + | :<math>I_{A,x} = \int x^2 dA =</math> Area moment of inertia about the x-axis. | ||
| + | |||
| − | + | The mass moment of Inertia is defined as: | |
| − | The | ||
| − | # The end plate is made of homogenous uniform elastic material with a Young's Modulus of E=210 x | + | |
| + | :<math>I= \int r^2 dM = \rho I_A</math> | ||
| + | |||
| + | |||
| + | In order to perform these calcuations, the following assumption were made: | ||
| + | |||
| + | # The end plate is made of homogenous uniform elastic material with a Young's Modulus of <math>E=210 x 10^23 N/mm^2</math> (Stainless Steel). | ||
# The horizontal component of the loading is completely neglected. | # The horizontal component of the loading is completely neglected. | ||
# The deflection in the x-direction is negligible. | # The deflection in the x-direction is negligible. | ||
| − | # The end plate is rectangular in shape with a width of 526 mm and thickness of 50.8 mm resulting moment of inertia ( | + | # The end plate is rectangular in shape with a width of 526 mm and thickness of 50.8 mm resulting area moment of inertia (<math>I_A</math>) =5746.4 <math>mm^4</math>. |
# The loading provided by wire tensions are equivalent to a uniformly distributed load. | # The loading provided by wire tensions are equivalent to a uniformly distributed load. | ||
# The maximum deflection occurs along the length which is represented by <math>c</math> in the diagram. | # The maximum deflection occurs along the length which is represented by <math>c</math> in the diagram. | ||
| Line 101: | Line 262: | ||
# The effects of the endplate weight are ignored. | # The effects of the endplate weight are ignored. | ||
| − | The moments | + | The moments experienced along the endplate may be divided into 5 separate equations, each equation valid only for its corresponding region: |
| + | |||
:<math>M_a = -\frac{W_1 \cdot b + W_2 \cdot c + W_3 \cdot d}{2} \cdot x</math> | :<math>M_a = -\frac{W_1 \cdot b + W_2 \cdot c + W_3 \cdot d}{2} \cdot x</math> | ||
| Line 109: | Line 271: | ||
:<math>M_e = -\frac{W_1 \cdot b + W_2 \cdot c + W_3 \cdot d}{2} \cdot (a+b+c+d+ x) + W_1 \cdot b \left ( \frac{b}{2} +c+d+x \right) + W_2\cdot c \left ( \frac{c}{2} + d+x \right) + W_3 \cdot d \left (\frac{d}{2} +x \right)</math> | :<math>M_e = -\frac{W_1 \cdot b + W_2 \cdot c + W_3 \cdot d}{2} \cdot (a+b+c+d+ x) + W_1 \cdot b \left ( \frac{b}{2} +c+d+x \right) + W_2\cdot c \left ( \frac{c}{2} + d+x \right) + W_3 \cdot d \left (\frac{d}{2} +x \right)</math> | ||
| − | where <math>x</math> represents the . | + | where <math>x</math> represents the linear distance along the endplate. If we assume that the largest magnitude of deflection occurs in region c, then we may integrate the above 2nd order elastic curve equation once and determine the critical point which represents the point of maximum deflection ( contra flexure). |
| + | |||
| + | :<math>\int \frac{dy}{dx}dy = \frac{dy}{dx} = \int M_c dx</math> | ||
| + | |||
| + | := <math>-\frac{W_1 \cdot b + W_2 \cdot c + W_3 \cdot d}{2} \cdot (ax+bx+x^2/2) + W_1 \cdot b \left ( \frac{bx}{2} +x^2/2 \right) + \frac{W_2 \cdot x^3}{6} +C_{integration}</math> | ||
| − | The deflection | + | where <math>C_{integration} =</math> a constant of integration. Integrating the equation a 2nd time will result in an equation for the amount of the deflection. The constants of integration my be found by applying boundary conditions at points where the deflection is zero (at the ends or <math>x=0</math> and <math>x=L</math>). |
| − | + | Setting <math>\frac{dy}{dx}</math> to zero and solving for x gives the linear distance corresponding to the point of maximum deflection of x = 1654.96 mm. In other words, the maximum deflection occurs 1654.96 mm from region <math>b</math> of the endplate or <math>1654.96 + b + a = 1850.2</math> mm from the right hand side of the endplate. Substituting the value of x above results in a maximum deflection of 2.2 mm. Note, this deflection is only slightly smaller than that found with a point load assumption and a stainless steel endplate (2.2 mm compared to 2.5 mm, respectively). | |
| + | |||
| + | ==Distributed Load FEA== | ||
| − | + | A Finite Element Analysis (FEA) was performed on the same stainless steel endplate design using the commercially available computer software ANSYS. For this analysis, the loading shown previously in the "Distrubuted Load" section was used. The maximum deflection observed from the FEA was 2.14 mm, as shown in Figure 3.4.1; this value differs from the hand calculation by only 3%. In addition to validating the FEA analysis with hand calculations, the above results also reveal the challenge of reducing the endplate deflection using stiffer materials due to an essentially linear dependence of the deflection on the Young's Modulus. The cubic dependence of the deflection on the thickness <math>(t)</math> of the endplate, however, can be used to reach the minimum endplate deflection criteria of 50 <math>\mu m</math>, in addition to the us of stiffer material. Increasing the endplate thickness, however, comes at the cost of increasing the end plate mass. As a result, composite materials were considered in order to minimize weight. The performance of these composite materials is shown in the 3-D model section of this report. | |
| − | :<math> | + | {| align="center" border="0" |
| + | |- | ||
| + | |[[Image:EndPlateDeflection_5cmx53cmx4m_ThickStainlessSteel.jpg]] | ||
| + | |- | ||
| + | | Figure 3.4.1: ANSYS FEA results for deflection of a stainless steel endplate design for a distrubed loading. | ||
| + | |} | ||
| + | |||
| + | ==Composite End Plate == | ||
| + | === Effective Young's Modulus <math>Y_{eff}</math>=== | ||
| + | The R3 endplates used in the CLAS 6 GeV detector were comprised of a polyeurethane foam core 50.8 mm thick (2 inches) with 1.2 mm thick (0.048 inch) stainless steel sheets epoxied to each side, as shown in Figure 3.5.1. | ||
| + | {| align="center" border="0" | ||
| + | |- | ||
| + | |[[Image:EndPlateMaterialDimensions.jpg]] | ||
| + | |- | ||
| + | | Figure 3.5.1: Polyeurethane foam/stainless steel composite endplate construction and dimensions. | ||
| + | |} | ||
| − | |||
| − | + | An effective Young's Modulus (<math>Y_{eff}</math>) was used in the FEA model in order to simplify the model. The effective Young's Modulus for this endplate, weighted by the volume of each plate, is | |
| − | + | :<math>Y_{eff} = \frac{V_p Y_p + V_s Y_s }{V_{tot}}</math> | |
| − | + | where | |
| − | |||
| − | :<math> | + | :<math>Y_p = 1.4 \times 10^8 N/m^2</math> |
| + | :<math>Y_s = 2.1 \times 10^{11} N/m^2</math> | ||
| + | :<math>V_p = L \times W \times 2</math> inches | ||
| + | :<math>V_s = L \times W \times 0.096</math> inches | ||
| − | |||
| − | + | Therefore, the effective Young's Modulus was found to be: | |
| − | == | + | : <math>Y_{eff} = \frac{2(1.4 \times 10^8) +0.096(2.1 \times 10^{11})}{2.096} = 9.75 \times 10^{9} N/m^2</math> |
| − | + | === FEA Deflection Results=== | |
| + | The effective Young's Modulus of <math>9.75 \times 10^9 N/m^2</math> was used to determine the deflection of the endplate due to a distributed load (see Figure 3.5.2). Results indicate a maximum transverse deflection of 32.4 mm which is larger than that observed with the stainless steel material. However, when gravity is included, the composite material will deflect less due to its lower density. | ||
| − | [[Image: | + | {| align="center" border="0" |
| + | |- | ||
| + | |[[Image:DtotNoRods.jpg]] | ||
| + | || | ||
| + | {| align="center" border="1" | ||
| + | |- | ||
| + | | Configuration || X max || Y max || Z max || D max | ||
| + | |- | ||
| + | | || (mm) || (mm) || (mm)|| (mm) | ||
| + | |- | ||
| + | | No rods ||.67 || 32.4|| .04 || 32.4 | ||
| + | |} | ||
| + | |- | ||
| + | | Figure 3.5.2: FEA predicted deflections for the polyeurethane foam/stainless steel composite endplate. | ||
| + | |} | ||
=Carbon Rod Buckling= | =Carbon Rod Buckling= | ||
| + | |||
| + | A support brace composed of carbon rods was considered in order to reduce the larger deflections of composite endplates compared to endplates made from stainless steel. These rods would be used on the front side of the R3 drift chamber and span between the two endplates. The use of 1" diameter hollow carbon fiber rods with 2 mm thick walls in the 6 GeV R3 design did not appear to appreciably impact the tracking capabilities of the drift chamber. The deflection of these carbon fiber rods was modeled as a separate part in ANSYS and compared with hand calculation. | ||
| + | |||
==Compression== | ==Compression== | ||
| Line 150: | Line 351: | ||
:<math>F =</math> Compression force exerted along the end of the rod | :<math>F =</math> Compression force exerted along the end of the rod | ||
| − | :<math>L =</math> length of the rod = 2.8 m | + | :<math>L =</math> length of the rod = 2.8 m for the longest rod |
:<math>A =</math> cross sections area of the rod = <math>\pi (25 mm)^2</math> | :<math>A =</math> cross sections area of the rod = <math>\pi (25 mm)^2</math> | ||
: <math>\Delta L =</math> rod compression distance = <math>50 \times 10^{-6}</math> | : <math>\Delta L =</math> rod compression distance = <math>50 \times 10^{-6}</math> | ||
| Line 159: | Line 360: | ||
:<math>F = \frac{YA \Delta L }{L} = \frac{1.5 \times 10^{11} N/m^2 (\pi 0.000625 m^2) 50 \times 10^{-6} m } {2.8 m}= 5259N</math> | :<math>F = \frac{YA \Delta L }{L} = \frac{1.5 \times 10^{11} N/m^2 (\pi 0.000625 m^2) 50 \times 10^{-6} m } {2.8 m}= 5259N</math> | ||
| − | The total force along the whole endplate from just the drift chamber wire tension amount to | + | The total force along the whole endplate from just the drift chamber wire tension amount to less than 3000 N which is less than a factor of 2 smaller than the force needed to compress a single carbon rod used to brace the endplates. Therefore, placing at least 6 carbon rod braces in the drift chamber should provide substantial support for the endplates. |
==Buckling Load Threshold== | ==Buckling Load Threshold== | ||
| − | The load at which a carbon fiber rod will start to buckle is given by Euler's formula ( | + | The load at which a carbon fiber rod will start to buckle is given by Euler's formula (defined in any undergraduate "Mechanics of Materials" textbook). Figure 4.2.1 depicts the load configuration on the rod for this calculation. |
| + | {| align="center" border="0" | ||
| + | |- | ||
| + | |[[Image:EulersBucklingDiagramWequation.jpg]] | ||
| + | |- | ||
| + | | Figure 4.2.1: Sketch showing the definition of Euler's buckling load threshold. | ||
| + | |} | ||
| + | |||
| + | |||
| + | <math>F_{cr}</math> represent the critical force needed to cause the rod to begin to buckle. Young's Modulus for a carbon fiber rod is 1.5 x 10^11 N/<math>m^2</math> and the longest rod's half length (L for the above equation) is 1.4 m. The Area Moment of inertia about the end of a hollow cylinder of inner radius<math> (R_i)</math> and outer radius <math>(R_o)</math> can be found from: | ||
| + | |||
| + | :<math>I_{A,z}= \int_{Ri}^{Ro} r^2 \pi r dr = \frac{\pi}{4} \left( Ro^4 -Ri^4\right) </math> | ||
| + | |||
| + | ::<math>=\frac{\pi}{4} \left( (0.0254)^4 -(0.0244)^4\right) = 4.85 * 10^-8 m^4</math> | ||
| + | |||
| + | The buckling force is found to be 36,646N, an order of magnitude larger than the predicted endplate forces. | ||
| + | |||
| + | |||
| + | The above buckling threshold calculation was performed using ANSYS. The results are shown in Figure 4.2.2 and predict a threshold force of 36989 N compared to the 36646 N value found from hand calculations. ANSYS also predicts that the rod will deflect almost 2 mm if the buckling load is reached, no deflection due to buckling will occur before the load level is reached. | ||
| + | |||
| + | |||
| + | {| align="center" border="0" | ||
| + | |- | ||
| + | |[[Image:CarbonRodBuckling_AnsysCalc1.jpg]] | ||
| + | |- | ||
| + | | Figure 4.2.2. FEA of the maximum (threshold) force needed to cause a carbon rod to buckle. | ||
| + | |} | ||
| + | |||
| + | ==Actual Buckling FEA== | ||
| + | |||
| + | In the previous FEA results, both ends of the carbon rods were constrained from moving from x and y directions and does not account for the deflection of the endplates. If the endplates deflect the ends of the carbon rods will be compressed. The buckling load in this case is observed to be 54720.5N as shown below in Figure 4.3.1. In the event that the buckling load is reached, ANSYS predicts a deflection of at least 11 mm will occur. It should also be noted that the buckling does not have a preferred direction making it possible for the middle of the rod to bend in any direction. | ||
| + | |||
| + | {| align="center" border="0" | ||
| + | |- | ||
| + | |[[Image:CarbonRodBuckling_AnsysCalc2.jpg]] | ||
| + | |- | ||
| + | | Figure 4.3.1. FEA of the maximum (threshold) force needed to cause a carbon rod to buckle with the real constraints. | ||
| + | |} | ||
| + | =FEA Analysis of a sample sector= | ||
| + | |||
| + | The ideal case orientation is used for a basic understanding of the loads and their effective results on the sector. This case has to be considered as a study case and there is no resemblance to any of the 6 six sector orientations. | ||
| + | |||
| + | {| align="center" border="0" | ||
| + | |- | ||
| + | |[[Image:sector_orientation2.jpg| 500 px]] | ||
| + | |- | ||
| + | | Figure 5.1: Sector orientation and display of ideal case orientation | ||
| + | |} | ||
| + | |||
| + | |||
| + | |||
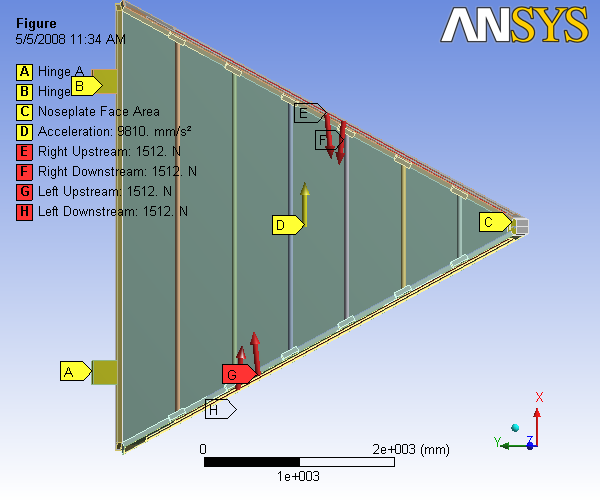
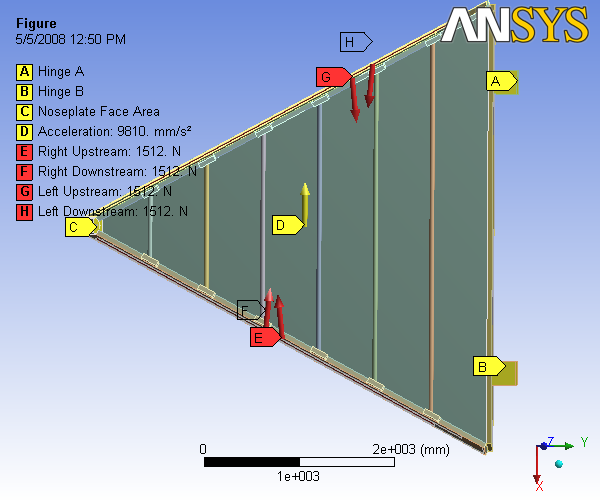
| + | This Sector is constrained in 3 regions | ||
| + | |||
| + | A. Left Hinge - Constrained on Y and Z directions and free to move in X direction | ||
| + | |||
| + | B. Right Hinge - Constrained on X and Z directions and free to move in Y direction | ||
| + | |||
| + | C. Nose Plate front face - Constrained on X and Z directions and free to move in Y direction | ||
| + | |||
| + | Wire tensions of 1512N is applied on the all the 4 hole regions at 6 degrees to the horizontal as defined earlier, which pulls the end plates inward. | ||
| + | |||
| + | An Upward acceleration is given to the sector, which applies a downward gravity force to the sector. | ||
| + | |||
| + | |||
| + | {| align="center" border="0" | ||
| + | |- | ||
| + | |[[Image:R3_3D_Analysis_slice_4.3.jpg| 700 px]] | ||
| + | |- | ||
| + | | Figure 5.2: Loads and boundary conditions for the FEA 3-D model. This image was taken from the ANSYS FEA program. | ||
| + | |} | ||
| + | |||
| + | ==Description of Analysis sets== | ||
| + | |||
| + | Four sets of analysis were done with this ideal orientation of the slice. Each Set in turn has 3 different analysis. so, a total of 12 cases of analysis were carried out in this section. | ||
| + | |||
| + | Analysis set 1 - Just the basic frame with No Carbon Rods and No hexcel sheet | ||
| + | |||
| + | Analysis Set 2 - Carbon Fiber rods were introduced to the geometry on the upstream side | ||
| + | |||
| + | Analysis Set 3 - Carbon Fiber rods were removed on the upstream side and Hexcel Backing sheet was introduced on the downstream side of the sector. | ||
| + | |||
| + | Analysis set 4 - Both the carbon fiber rods and the hexcel backing sheet were modeled at the same time on upstream and downstream side of the sector respectively. | ||
| + | |||
| + | As mentioned above, every analysis set has 3 cases referenced as .1, .2 and .3 succeeding the analysis set number. For example, Case 2 for analysis set 3 will be mentioned as 3.2 | ||
| + | |||
| + | Case 1 - Just the gravity Loading with no wire tensions applied in their respective sets | ||
| + | |||
| + | Case 2 - Just the wire tensions were applied with no gravity loading in their respective sets | ||
| + | |||
| + | Case 3 - Both Gravity and wire tensions are applied in their respective sets. | ||
| + | |||
| + | So, analysis 3.2 has hexcel sheet on the downstream side and there are no carbon fiber rods on the upstream side and wire tensions are the only load with no gravity loading. | ||
| + | |||
| + | == Table of Results== | ||
| + | |||
| + | The results for the deflection in mm are displayed in the following table. A yes in the table means the presence of the header in the geometry and simulation while a No is the opposite. | ||
| + | |||
| + | E max can be understood as the maximum total deflection in mm on the end plate at any point | ||
| + | |||
| + | D max is the maximum total deflection in mm on the whole slice. | ||
| + | |||
| + | X max is the maximum X directional deflection in mm on the whole sector. A negative sign resembles the deflection to the left side. | ||
| + | |||
| + | Y max is the maximum Y directional deflection in mm on the whole sector. A negative sign resembles the deflection in downward direction. | ||
| + | |||
| + | Z max is the maximum Z directional deflection in mm. A negative sign resembles the deflection away from the target center | ||
| + | |||
| + | E max can be considered as the point of interest as D max can be on any point like on the carbon fiber rod or the backing plate, which are of the least interest to know at this point of time. | ||
| + | |||
| + | |||
| + | {| align="center" border="1" | 1200 px | ||
| + | |- | ||
| + | | Deflection ||Gravity||Wire Tensions ||Rods||Hexcel||E max(mm)|| D max(mm) || X max(mm) || Y max(mm) || Z max(mm) | ||
| + | |- | ||
| + | | Analysis 1.1 ||Yes||No||No||No||0.973||0.973||0.557||-0.838 || -0.131 | ||
| + | |- | ||
| + | | Analysis 1.2 ||No||Yes||No||No||3.202||3.202||-2.895||1.530 || -0.048 | ||
| + | |- | ||
| + | | Analysis 1.3 ||Yes||Yes||No||No||2.555||2.555||2.393||0.897 || 0.085 | ||
| + | |- | ||
| + | | Analysis 2.1 ||Yes||No||Yes||No||0.871||0.1.119||0.208||-1.119 || -0.211 | ||
| + | |- | ||
| + | | Analysis 2.2 ||No||Yes||Yes||No||0.689||0.689||0.538||0.334 || 0.653 | ||
| + | |- | ||
| + | | Analysis 2.3 ||Yes||Yes||Yes||No||0.880||1.132||0.579||-1.131 || 0.596|| | ||
| + | |- | ||
| + | | Analysis 3.1 ||Yes||No||No||yes||0.036||0.036||0.014||-0.032 || 0.024|| | ||
| + | |- | ||
| + | | Analysis 3.2 ||No||Yes||No||yes||0.103||0.115||0.089||0.050 || -0.052|| | ||
| + | |- | ||
| + | | Analysis 3.3 ||Yes||Yes||No||yes||0.080||0.090||0.089||-0.042 || -0.054|| | ||
| + | |- | ||
| + | | Analysis 4.1 ||Yes||No||Yes||yes||0.047||0.106||-0.010||-0.105 || 0.029|| | ||
| + | |- | ||
| + | | Analysis 4.2 ||No||Yes||Yes||yes||0.020||0.022||0.019||0.015 || -0.014|| | ||
| + | |- | ||
| + | | Analysis 4.3 ||Yes||Yes||Yes||yes||0.054||0.096||0.017||0.013 || 0.036|| | ||
| + | |} | ||
| + | |||
| + | ==Analysis== | ||
| + | |||
| + | Analysis is carried out step by step in an incremental order by comparing results and effects of each geometric addition. | ||
| + | Analysis set 4.3 is the final analysis set which is more of consideration. So, the pictures related to the set 4.3 is displayed and discussed here. However, data related to all the remaining 11 sets will be placed on the appendices section after the summary section. each section will have a pdf file which is the report file generated at the time of analysis and are available at their respective sections for future reference. | ||
| + | |||
| + | ===Analysis 4.3=== | ||
| + | |||
| + | Analysis 4.3 Includes the Carbon fiber rods and hexcel backing sheet. Both Gravity and wire loads were applied. | ||
| + | |||
| + | The report generated by ANSYS is available: [[Image:Analysis_slice_4.3.pdf]] | ||
| + | {| align="center" | ||
| + | |- | ||
| + | [[Image:R3_3D_Analysis_slice_4.3d.jpg| 700 px]] | ||
| + | |} | ||
| + | |||
| + | {| | ||
| + | |[[Image:R3_3D_AAnalysis_slice_4.3x.jpg| 410 px]]||[[Image:R3_3D_Analysis_slice_4.3y.jpg| 410 px]]||[[Image:R3_3D_Analysis_slice_4.3z.jpg| 410 px]] | ||
| + | |||
| + | |} | ||
| + | |||
| + | Figure 5.3.1.1: Images of Deflection for Analysis 4.3 in D,X,Y,Z Directions respectively | ||
| + | |||
| + | =FEA Analysis to find the maximum deformation in each orientation= | ||
| + | |||
| + | ==Description== | ||
| + | |||
| + | Due to the effect of the gravity the Maximum deformation at the end plates is observed at the sectors 1 and 4. This analysis is an effort to minimize this deformation by interchanging the hinge constraints in both the cases. | ||
| + | |||
| + | |||
| + | {| align="center" border="1" | ||
| + | |- | ||
| + | | ||Analysis || Sector Orientation || Hinge A constraint || Hinge B Constraint || Nose Plate | ||
| + | |- | ||
| + | | Sector 1 || Analysis 1.1 || 1 || Y,Z || X,Z || X,Z | ||
| + | |- | ||
| + | | || Analysis 1.2 || 1 || X,Z || Y,Z || Y,Z | ||
| + | |- | ||
| + | | Sector 4 || Analysis 4.1 || 4 || Y,Z || X,Z || X,Z | ||
| + | |- | ||
| + | | || Analysis 4.2 || 4 || X,Z || Y,Z || Y,Z | ||
| + | |} | ||
| + | |||
| + | |||
| + | Sector 1 and Sector 4 respectively | ||
| + | |||
| + | [[Image:R3_Analysis_sector_1.png| 600 px]] [[Image:R3_Analysis_sector_4.png| 600 px]] | ||
| + | |||
| + | == Table of results== | ||
| + | |||
| + | |||
| + | {| align="center" border="1" | ||
| + | |- | ||
| + | | || || Deformation (mm) | ||
| + | |- | ||
| + | | ||Analysis || E Max || D Max || X Max || Y Max || Z Max | ||
| + | |- | ||
| + | | Sector 1 || Analysis 1.1 || 0.041 || 0.041 || -0.038 || 0.026 ||0.016 | ||
| + | |- | ||
| + | | || Analysis 1.2 || 0.110 || 0.110 || -0.107 || -0.037 ||0.045 | ||
| + | |- | ||
| + | | Sector 4 || Analysis 4.1 || 0.056 || 0.056 || 0.051 || 0.031 || 0.027 | ||
| + | |- | ||
| + | | || Analysis 4.2 || 0.107 || 0.107 || 0.107 || 0.032 || -0.043 | ||
| + | |} | ||
| + | |||
| + | |||
| + | After looking at the results, analysis 1.1 and analysis 4.1 were observed with the least deflections for sector 1 and sector 4 respectively. So, these results were refined by | ||
| + | |||
| + | |||
| + | 1. Refining the mesh size. | ||
| + | |||
| + | 2. Sandwiching the Hexcel backing sheet with carbon fiber slices. | ||
| + | |||
| + | 3. Removing the hinges and applying the constraints over the hinge area. | ||
| + | |||
| + | 4. Making single parts for each end plates. | ||
| + | |||
| + | |||
| + | {| align="center" border="1" | ||
| + | |- | ||
| + | | || || Deformation (mm) | ||
| + | |- | ||
| + | | ||Analysis || E Max || D Max || X Max || Y Max || Z Max | ||
| + | |- | ||
| + | | Sector 1 || Analysis 1.1 Refined || 0.043 || 0.043 || -0.040 || 0.027 || 0.027 | ||
| + | |- | ||
| + | | Sector 4 || Analysis 4.1 Refined || 0.040 || 0.040 || 0.036|| 0.027 || 0.019 | ||
| + | |} | ||
| + | |||
| + | == Sector 1 == | ||
| + | |||
| + | ===Analysis 1.1=== | ||
| + | |||
| + | The report generated by ANSYS is available: [[Image:Analysis_sector_1.1.pdf]] | ||
| + | |||
| + | {| align="center" | ||
| + | |- | ||
| + | |[[Image:R3_3D_Analysis_sector_1.1d.png| 700 px]] | ||
| + | |} | ||
| + | |||
| + | {| | ||
| + | |[[Image:R3_3D_Analysis_sector_1.1x.png| 410 px]]||[[Image:R3_3D_Analysis_sector_1.1y.png| 410 px]]||[[Image:R3_3D_Analysis_sector_1.1z.png| 410 px]] | ||
| + | |||
| + | |} | ||
| + | |||
| + | Figure 1.1: Images of Deflection for Analysis 1.1 in D,X,Y,Z Directions respectively | ||
| + | |||
| + | |||
| + | ===Analysis 1.2=== | ||
| + | |||
| + | The report generated by ANSYS is available: [[Image:Analysis_sector_1.2.pdf]] | ||
| + | |||
| + | {| align="center" | ||
| + | |- | ||
| + | |[[Image:R3_3D_Analysis_sector_1.2d.png| 700 px]] | ||
| + | |} | ||
| + | |||
| + | {| | ||
| + | |[[Image:R3_3D_Analysis_sector_1.2x.png| 410 px]]||[[Image:R3_3D_Analysis_sector_1.2y.png| 410 px]]||[[Image:R3_3D_Analysis_sector_1.2z.png| 410 px]] | ||
| + | |||
| + | |} | ||
| + | |||
| + | Figure 1.2: Images of Deflection for Analysis 1.1 in D,X,Y,Z Directions respectively | ||
| + | |||
| + | ==Sector 4== | ||
| + | |||
| + | ===Analysis 4.1=== | ||
| + | |||
| + | The report generated by ANSYS is available: [[Image:Analysis_sector_4.1.pdf]] | ||
| + | |||
| + | {| align="center" | ||
| + | |- | ||
| + | |[[Image:R3_3D_Analysis_sector_4.1d.png| 700 px]] | ||
| + | |} | ||
| + | |||
| + | {| | ||
| + | |[[Image:R3_3D_Analysis_sector_4.1x.png| 410 px]]||[[Image:R3_3D_Analysis_sector_4.1y.png| 410 px]]||[[Image:R3_3D_Analysis_sector_4.1z.png| 410 px]] | ||
| + | |||
| + | |} | ||
| + | |||
| + | Figure 4.1: Images of Deflection for Analysis 4.1 in D,X,Y,Z Directions respectively | ||
| + | |||
| + | ===Analysis 4.2=== | ||
| + | |||
| + | The report generated by ANSYS is available: [[Image:Analysis_sector_4.2.pdf]] | ||
| + | |||
| + | {| align="center" | ||
| + | |- | ||
| + | |[[Image:R3_3D_Analysis_sector_4.2d.png| 700 px]] | ||
| + | |} | ||
| + | |||
| + | {| | ||
| + | |[[Image:R3_3D_Analysis_sector_4.2x.png| 410 px]]||[[Image:R3_3D_Analysis_sector_4.2y.png| 410 px]]||[[Image:R3_3D_Analysis_sector_4.2z.png| 410 px]] | ||
| + | |||
| + | |} | ||
| + | |||
| + | Figure 4.2: Images of Deflection for Analysis 4.2 in D,X,Y,Z Directions respectively | ||
| + | |||
| + | ==Refined Results== | ||
| + | |||
| + | ===Analysis Refined 1.1=== | ||
| + | |||
| + | The report generated by ANSYS is available: [[Image:Analysis_refined_sector_1.1.pdf]] | ||
| + | |||
| + | {| align="center" | ||
| + | |- | ||
| + | |[[Image:R3_3D_Analysis_refined_sector_1.1d.png| 700 px]] | ||
| + | |} | ||
| + | |||
| + | {| | ||
| + | |[[Image:R3_3D_Analysis_refined_sector_1.1x.png| 410 px]]||[[Image:R3_3D_Analysis_refined_sector_1.1y.png| 410 px]]||[[Image:R3_3D_Analysis_refined_sector_1.1z.png| 410 px]] | ||
| + | |||
| + | |} | ||
| − | + | Figure 4.1: Images of Deflection for Refined Analysis 1.1 in D,X,Y,Z Directions respectively | |
| + | ===Analysis Refined 4.1=== | ||
| − | + | The report generated by ANSYS is available: [[Image:Analysis_refined_sector_4.1.pdf]] | |
| − | + | {| align="center" | |
| − | + | |- | |
| − | + | |[[Image:R3_3D_Analysis_refined_sector_4.1d.png| 700 px]] | |
| + | |} | ||
| − | + | {| | |
| − | [[Image: | + | |[[Image:R3_3D_Analysis_refined_sector_4.1x.png| 410 px]]||[[Image:R3_3D_Analysis_refined_sector_4.1y.png| 410 px]]||[[Image:R3_3D_Analysis_refined_sector_4.1z.png| 410 px]] |
| − | + | |} | |
| + | |||
| + | Figure 4.1: Images of Deflection for Refined Analysis 4.1 in D,X,Y,Z Directions respectively | ||
=Summary= | =Summary= | ||
| + | |||
| + | =Appendices= | ||
| + | === Endplate Deflection with Carbon Rods === | ||
| + | |||
| + | Preliminary FEA efforts were performed to determine the impact of including carbon fiber rods on the endplate deflection. This model was only for a single endplate and not the full 3-D Analysis. Figure A1a shows the reference case of a composite endplate deflection undergoing loading from the wires without carbon fiber rods. Figure A1b shows the deflection of the endplate with the six fiber rods included as rigid boundary constraints. Since the rods are only mounted on the upstream side of the endplate, the maximum deflection is then observed on the downstream side. | ||
| + | |||
| + | {| align="center" border="0" | ||
| + | |- | ||
| + | |[[Image:DtotNoRods.jpg]] || |[[Image:DtotWithRods.jpg]] | ||
| + | |- | ||
| + | |} | ||
| + | |||
| + | {| align="center" border="1" | ||
| + | |- | ||
| + | | Configuration || X max || Y max || Z max || D max | ||
| + | |- | ||
| + | | || (mm) || (mm) || (mm)|| (mm) | ||
| + | |- | ||
| + | | No rods ||.67 || 32.4|| .04 || 32.4 | ||
| + | |- | ||
| + | | With rods || .01 || 0.29 || 0.16|| .29 | ||
| + | |} | ||
| + | |||
| + | |||
| + | Figure A1: (a, left) FEA predicted deflections for the composite endplate for a reference condition of wire loading witihout carbon fiber rods. (b, right) FEA predicted deflections when carbon fiber rods are included. | ||
| + | |||
| + | |||
| + | Only the dark and light blue regions near the carbon fiber rods appear to have deflections below the <math>50 \mu m</math> specification. The maximum deflection appears to be on the back (downstream) edge of the end plate. The use of a composite material, with an effective Young's Modulus that is a factor of 20 smaller than stainless steel, resulted in deflections which were only a factor of 16 larger while decreasing the mass of the end plate by a factor of at least 16. Carbon fiber rods along the front of the drift chamber will decrease the maximum deflection to about 300 <math>\mu m</math> which is a factor of 6 too large. | ||
| + | |||
| + | == Remaining sets of analysis from Section 5.3== | ||
| + | ===Analysis 1=== | ||
| + | |||
| + | ====Analysis 1.1==== | ||
| + | |||
| + | Analysis 1.1 Includes just the gravity loading with no wire loads, no carbon fiber rods and with no Hexcel backing sheet. | ||
| + | |||
| + | The report generated by ANSYS is available: [[Image:Analysis_slice_1.1.pdf]] | ||
| + | {| align="center" | ||
| + | |- | ||
| + | |[[Image:R3_3D_Analysis_slice_1.1.jpg| 400 px]]||[[Image:R3_3D_Analysis_slice_1.1d.jpg| 700 px]] | ||
| + | |} | ||
| + | |||
| + | {| | ||
| + | |[[Image:R3_3D_AAnalysis_slice_1.1x.jpg| 410 px]]||[[Image:R3_3D_Analysis_slice_1.1y.jpg| 410 px]]||[[Image:R3_3D_Analysis_slice_1.1z.jpg| 410 px]] | ||
| + | |||
| + | |} | ||
| + | |||
| + | Figure A1.1: Images of Deflection for Analysis 1.1 in D,X,Y,Z Directions respectively | ||
| + | |||
| + | ====Analysis 1.2==== | ||
| + | |||
| + | Analysis 1.2 Includes Just the Wire loads with no gravity, no carbon fiber rods and with no Hexcel backing sheet. | ||
| + | |||
| + | The report generated by ANSYS is available: [[Image:Analysis_slice_1.2.pdf]] | ||
| + | {| align="center" | ||
| + | |- | ||
| + | |[[Image:R3_3D_Analysis_slice_1.2.jpg| 400 px]]||[[Image:R3_3D_Analysis_slice_1.2d.jpg| 700 px]] | ||
| + | |} | ||
| + | |||
| + | {| | ||
| + | |[[Image:R3_3D_AAnalysis_slice_1.2x.jpg| 410 px]]||[[Image:R3_3D_Analysis_slice_1.2y.jpg| 410 px]]||[[Image:R3_3D_Analysis_slice_1.2z.jpg| 410 px]] | ||
| + | |||
| + | |} | ||
| + | |||
| + | Figure A1.2: Images of Deflection for Analysis 1.2 in D,X,Y,Z Directions respectively | ||
| + | |||
| + | ====Analysis 1.3==== | ||
| + | |||
| + | Analysis 1.3 Includes both gravity and wire loading with no carbon fiber rods and with no Hexcel backing sheet. | ||
| + | |||
| + | The report generated by ANSYS is available: [[Image:Analysis_slice_1.3.pdf]] | ||
| + | {| align="center" | ||
| + | |- | ||
| + | |[[Image:R3_3D_Analysis_slice_1.3.jpg| 400 px]]||[[Image:R3_3D_Analysis_slice_1.3d.jpg| 700 px]] | ||
| + | |} | ||
| + | |||
| + | {| | ||
| + | |[[Image:R3_3D_AAnalysis_slice_1.3x.jpg| 410 px]]||[[Image:R3_3D_Analysis_slice_1.3y.jpg| 410 px]]||[[Image:R3_3D_Analysis_slice_1.3z.jpg| 410 px]] | ||
| + | |||
| + | |} | ||
| + | |||
| + | Figure A1.3: Images of Deflection for Analysis 1.3 in D,X,Y,Z Directions respectively | ||
| + | |||
| + | ===Analysis 2=== | ||
| + | |||
| + | ====Analysis 2.1==== | ||
| + | |||
| + | Analysis 2.1 Includes the gravity loading for the basic sector with Carbon Fiber rods attached on the upstream side of the sector with no wire loads and with no Hexcel backing sheet. | ||
| + | |||
| + | The report generated by ANSYS is available: [[Image:Analysis_slice_2.1.pdf]] | ||
| + | {| align="center" | ||
| + | |- | ||
| + | |[[Image:R3_3D_Analysis_slice_2.1.jpg| 400 px]]||[[Image:R3_3D_Analysis_slice_2.1d.jpg| 700 px]] | ||
| + | |} | ||
| + | |||
| + | {| | ||
| + | |[[Image:R3_3D_AAnalysis_slice_2.1x.jpg| 410 px]]||[[Image:R3_3D_Analysis_slice_2.1y.jpg| 410 px]]||[[Image:R3_3D_Analysis_slice_2.1z.jpg| 410 px]] | ||
| + | |||
| + | |} | ||
| + | |||
| + | Figure A2.1: Images of Deflection for Analysis 2.1 in D,X,Y,Z Directions respectively | ||
| + | |||
| + | ====Analysis 2.2==== | ||
| + | |||
| + | Analysis 2.2 Includes Just the Wire loads to the sector with carbon fiber rods on the upstream side of the sector with no gravity and with no Hexcel backing sheet. | ||
| + | |||
| + | The report generated by ANSYS is available: [[Image:Analysis_slice_2.2.pdf]] | ||
| + | {| align="center" | ||
| + | |- | ||
| + | |[[Image:R3_3D_Analysis_slice_2.2.jpg| 400 px]]||[[Image:R3_3D_Analysis_slice_2.2d.jpg| 700 px]] | ||
| + | |} | ||
| + | |||
| + | {| | ||
| + | |[[Image:R3_3D_AAnalysis_slice_2.2x.jpg| 410 px]]||[[Image:R3_3D_Analysis_slice_2.2y.jpg| 410 px]]||[[Image:R3_3D_Analysis_slice_2.2z.jpg| 410 px]] | ||
| + | |||
| + | |} | ||
| + | |||
| + | Figure A2.2: Images of Deflection for Analysis 2.2 in D,X,Y,Z Directions respectively | ||
| + | |||
| + | ====Analysis 2.3==== | ||
| + | |||
| + | Analysis 2.3 Includes both gravity and wire loading with carbon fiber rods and with no Hexcel backing sheet. | ||
| + | |||
| + | The report generated by ANSYS is available: [[Image:Analysis_slice_2.3.pdf]] | ||
| + | {| align="center" | ||
| + | |- | ||
| + | |[[Image:R3_3D_Analysis_slice_2.3.jpg| 400 px]]||[[Image:R3_3D_Analysis_slice_2.3d.jpg| 700 px]] | ||
| + | |} | ||
| + | |||
| + | {| | ||
| + | |[[Image:R3_3D_AAnalysis_slice_2.3x.jpg| 410 px]]||[[Image:R3_3D_Analysis_slice_2.3y.jpg| 410 px]]||[[Image:R3_3D_Analysis_slice_2.3z.jpg| 410 px]] | ||
| + | |||
| + | |} | ||
| + | |||
| + | Figure A2.3: Images of Deflection for Analysis 2.3 in D,X,Y,Z Directions respectively | ||
| + | |||
| + | ===Analysis 3=== | ||
| + | |||
| + | ====Analysis 3.1==== | ||
| + | |||
| + | Analysis 3.1 Includes just the gravity loading with no wire loads, no carbon fiber rods and with Hexcel backing sheet on the downstream side of the flow. | ||
| + | |||
| + | The report generated by ANSYS is available: [[Image:Analysis_slice_3.1.pdf]] | ||
| + | {| align="center" | ||
| + | |- | ||
| + | |[[Image:R3_3D_Analysis_slice_3.1.jpg| 400 px]]||[[Image:R3_3D_Analysis_slice_3.1d.jpg| 700 px]] | ||
| + | |} | ||
| + | |||
| + | {| | ||
| + | |[[Image:R3_3D_AAnalysis_slice_3.1x.jpg| 410 px]]||[[Image:R3_3D_Analysis_slice_3.1y.jpg| 410 px]]||[[Image:R3_3D_Analysis_slice_3.1z.jpg| 410 px]] | ||
| + | |||
| + | |} | ||
| + | |||
| + | Figure A3.1: Images of Deflection for Analysis 3.1 in D,X,Y,Z Directions respectively | ||
| + | |||
| + | ====Analysis 3.2==== | ||
| + | |||
| + | Analysis 3.2 Includes Just the Wire loads, with Hexcel backing sheet on the downstream side of the flow with no gravity and no carbon fiber rods. | ||
| + | |||
| + | The report generated by ANSYS is available: [[Image:Analysis_slice_3.2.pdf]] | ||
| + | {| align="center" | ||
| + | |- | ||
| + | |[[Image:R3_3D_Analysis_slice_3.2.jpg| 400 px]]||[[Image:R3_3D_Analysis_slice_3.2d.jpg| 700 px]] | ||
| + | |} | ||
| + | |||
| + | {| | ||
| + | |[[Image:R3_3D_AAnalysis_slice_3.2x.jpg| 410 px]]||[[Image:R3_3D_Analysis_slice_3.2y.jpg| 410 px]]||[[Image:R3_3D_Analysis_slice_3.2z.jpg| 410 px]] | ||
| + | |||
| + | |} | ||
| + | |||
| + | Figure A3.2: Images of Deflection for Analysis 3.2 in D,X,Y,Z Directions respectively | ||
| + | |||
| + | ====Analysis 3.3==== | ||
| + | |||
| + | Analysis 3.3 Includes both gravity and wire loading with Hexcel backing sheet and with no carbon fiber rods. | ||
| + | |||
| + | The report generated by ANSYS is available: [[Image:Analysis_slice_3.3.pdf]] | ||
| + | {| align="center" | ||
| + | |- | ||
| + | |[[Image:R3_3D_Analysis_slice_3.3.jpg| 400 px]]||[[Image:R3_3D_Analysis_slice_3.3d.jpg| 700 px]] | ||
| + | |} | ||
| + | |||
| + | {| | ||
| + | |[[Image:R3_3D_AAnalysis_slice_3.3x.jpg| 410 px]]||[[Image:R3_3D_Analysis_slice_3.3y.jpg| 410 px]]||[[Image:R3_3D_Analysis_slice_3.3z.jpg| 410 px]] | ||
| + | |||
| + | |} | ||
| + | |||
| + | Figure A3.3: Images of Deflection for Analysis 3.3 in D,X,Y,Z Directions respectively | ||
| + | |||
| + | ===Analysis 4=== | ||
| + | |||
| + | ====Analysis 4.1==== | ||
| + | |||
| + | Analysis 4.1 Includes just the gravity loading to the whole sector under the influence of carbon fiber rods and hexcel backing sheet with no wire tensions. | ||
| + | |||
| + | The report generated by ANSYS is available: [[Image:Analysis_slice_4.1.pdf]] | ||
| + | {| align="center" | ||
| + | |- | ||
| + | |[[Image:R3_3D_Analysis_slice_4.1.jpg| 400 px]]||[[Image:R3_3D_Analysis_slice_4.1d.jpg| 700 px]] | ||
| + | |} | ||
| + | |||
| + | {| | ||
| + | |[[Image:R3_3D_AAnalysis_slice_4.1x.jpg| 410 px]]||[[Image:R3_3D_Analysis_slice_4.1y.jpg| 410 px]]||[[Image:R3_3D_Analysis_slice_4.1z.jpg| 410 px]] | ||
| + | |||
| + | |} | ||
| + | |||
| + | Figure A4.1: Images of Deflection for Analysis 4.1 in D,X,Y,Z Directions respectively | ||
| + | |||
| + | ====Analysis 4.2==== | ||
| + | |||
| + | Analysis 4.2 Includes Just the Wire loads on the end plates with carbon carbon fiber rods and Hexcel backing sheet as supports on the upstream side and the downstream side of the flow with no gravity. | ||
| + | |||
| + | The report generated by ANSYS is available: [[Image:Analysis_slice_4.2.pdf]] | ||
| + | {| align="center" | ||
| + | |- | ||
| + | |[[Image:R3_3D_Analysis_slice_4.2.jpg| 400 px]]||[[Image:R3_3D_Analysis_slice_4.2d.jpg| 700 px]] | ||
| + | |} | ||
| + | |||
| + | {| | ||
| + | |[[Image:R3_3D_AAnalysis_slice_4.2x.jpg| 410 px]]||[[Image:R3_3D_Analysis_slice_4.2y.jpg| 410 px]]||[[Image:R3_3D_Analysis_slice_4.2z.jpg| 410 px]] | ||
| + | |||
| + | |} | ||
| + | |||
| + | Figure A4.2: Images of Deflection for Analysis 4.2 in D,X,Y,Z Directions respectively | ||
| + | |||
| + | == Old 3-D Analysis == | ||
| + | |||
| + | The term "3-D Analysis" refers to an analysis based on a model that includes both endplates, a nose plate, a bottom plate, several carbon fiber rods, and a Hexcel backing plate. The deflection calculation was performed using several permutations involving the wire tension, the presence of gravity, the use of carbon fiber rods, the Hexcel backing plate as well as the impact of a ball joint in the drift chamber nose plate. The analysis begins with the simplest case in which only the impact of gravitational forces on the endplate deflection is evaluated for an ionization chamber structure modeled without carbon rods, a Hexcel backing plate, nor a ball joint. The analysis then considers the case in which wires are strung between the endplates and the impact of adding carbon fiber rods, the Hexcell sheet, and the ball joint on the endplate deflection. Figure 5.1 shows the 3-D model with labels indicating the location of the loadings included in the FEA program. The impact of the differential gas pressure between the chamber and atmosphere is not reported in this document. Table 5.2.1 quantifies the predicted endplate deflection for several design configurations illustrated here and in the Appendix. Below is a list describing in detail the applied loading and boundary conditions. | ||
| + | |||
| + | *The Hinge 1 labeled A is fixed in all degrees of freedom. | ||
| + | *The Hinge 2 labeled B is fixed in 2 degrees of freedom (DOF) and 1 DOF is allowed to move horizontal. | ||
| + | *The wire tensions labeled C, D, E, and F are for all four wire super layers (two per endplate). | ||
| + | *Ball joint labeled G below the Nose plate. | ||
| + | *Acceleration labeled H is showing upwards, showing the gravity is opposite to it. This gravity vector is applied at an imaginary direction, as shown in Figure 14. The real orientations are different to what is shown here. To obtain the real orientations, the chamber has to be rotated clockwise at 30, 90, 150, 210, 270, 330 degrees, respectively, along z-axis (being the axis of rotation) to consider all the six orientations. | ||
| + | |||
| + | |||
| + | {| align="center" border="0" | ||
| + | |- | ||
| + | |[[Image:loads.jpg| 600 px]] | ||
| + | |- | ||
| + | | Figure 5.1: Loads and boundary conditions for the FEA 3-D model. This image was taken from the ANSYS FEA program. | ||
| + | |} | ||
| + | |||
| + | |||
| + | === Description of Analysis Sets === | ||
| + | |||
| + | Each analysis set included a specific component added to the model to slowly increase its complexity. These analysis sets are: | ||
| + | |||
| + | # Gravity only loading. | ||
| + | # Wire loads and the effect of the ball joint, located on the nose plate. | ||
| + | # Wire loading with carbon fiber rods included. | ||
| + | # Wire loading with the Hexcel backing sheet included. | ||
| + | # Wire loading with both the carbon fiber rods and Hexcel backing sheet included. | ||
| + | # Gravity only loading with both the carbon fiber rods and Hexcel backing sheet included. | ||
| + | |||
| + | Critical points to remember about the analysis sets includes: | ||
| + | |||
| + | * Analysis set 1 and 6 are just self-weight analysis with no external loading. | ||
| + | * The nose Plate, endplates, back plate, and hinges are made of the sandwiched polyurethane foam/stainless steel composite material. | ||
| + | * The downstream-side sheet (backign) is made of Hexcel honeycomb material (sandwiched between two carbon fiber sheets). | ||
| + | * The Young's Modulus of both the endplates and the Hexcel backing are obtained by the effective Young's Modulus calculation method. | ||
| + | * The compressive modulus of the Hexcel backing is observed to be different along the length and width. As are result, the Young's Modulus is calculated in both directions and the least of them is considered for calculations (more conservative approach). | ||
| + | |||
| + | === Table of Results === | ||
| + | |||
| + | Table 5.2.1 gives a summary of the analysis sets along with the resulting deflections. Column "D Max" is the maximum total deflection (vector) observed in the model; in some sets, this is observed in the carbon fiber rods and not necessarily in the endplates. Since the maximum total deflection is the result of importance, Column "E max" gives this value for the endplates. | ||
| + | |||
| + | |||
| + | Table 5.2.1: Summary of 3-D Analysis Results from ANSYS. | ||
| + | |||
| + | {| align="center" border="1" | 1200 px | ||
| + | |- | ||
| + | | Deflection ||Wire Tension||Rods||Hexcel||Mylar||Gravity||Ball Joint||Gas Pressure||D max(mm)|| X max(mm) || Y max(mm) || Z max(mm) || E max(mm) | ||
| + | |- | ||
| + | | Analysis 1.1 ||No||No||No||No||Yes||No||No||1.5315 || 0.0034|| 0.1791|| 0.0731|| 1.2 | ||
| + | |- | ||
| + | | Analysis 1.2 ||No||No||No||No||Yes||yes||No||0.219 || 2.11e-5|| 0.1795|| 0.0318||0.219 | ||
| + | |- | ||
| + | | Analysis 2.1 ||Yes||No||No||No||No||No||No||19.935 || 17.495|| 9.5869|| 0.4435||19.935 | ||
| + | |- | ||
| + | | Analysis 2.2 ||Yes||No||No||No||No||Yes||No||19.952 || 17.391|| 9.8084|| 0.4442||19.95 | ||
| + | |- | ||
| + | | Analysis 2.3 ||Yes||No||No||No||Yes||Yes||No||18.593 || 16.27|| 9.014|| 0.4813||18.593 | ||
| + | |- | ||
| + | | Analysis 3.1 ||Yes||Yes||No||No||No||No||No||1.5104 || 1.033|| 0.2855|| 0.0675||1.17 | ||
| + | |- | ||
| + | | Analysis 3.2 ||Yes||Yes||No||No||No||Yes||No||1.158 || 1.0266|| 0.5869|| 0.0534||1.15 | ||
| + | |- | ||
| + | | Analysis 3.3 ||Yes||Yes||No||No||Yes||Yes||No||1.038 || 0.9392|| 0.3618|| 0.1018||1.03 | ||
| + | |- | ||
| + | | Analysis 4.1 ||Yes||No||Yes||No||No||No||No||0.2904 || 0.146|| 0.2479|| 0.0044||0.29 | ||
| + | |- | ||
| + | | Analysis 4.2 ||Yes||No||Yes||No||No||Yes||No||0.2891 || 0.1538|| 0.251|| 0.0166||0.289 | ||
| + | |- | ||
| + | | Analysis 4.3 ||Yes||No||Yes||No||Yes||Yes||No||0.301 || 0.156|| 0.264|| 0.0153||0.3 | ||
| + | |- | ||
| + | | Analysis 5.1 ||Yes||Yes||Yes||No||No||No||No||0.1231 || 0.0216|| 0.0099|| 0.0031||0.09 | ||
| + | |- | ||
| + | | Analysis 5.2 ||Yes||Yes||Yes||No||No||Yes||No||0.0209 || 0.0157|| 0.0116|| 0.0027||0.016 | ||
| + | |- | ||
| + | | Analysis 5.3 ||Yes||Yes||Yes||No||Yes||Yes||No||0.0647 || 0.0078|| 0.0105|| 0.0122||0.021 | ||
| + | |- | ||
| + | | Analysis 6.1 ||No||Yes||Yes||No||Yes||No||No||0.5851 || 0.051|| 0.0052|| 0.0082||0.52 | ||
| + | |- | ||
| + | | Analysis 6.2 ||No||Yes||Yes||No||Yes||Yes||No||0.0738 || 0.0008|| 0.0017|| 0.0098||0.008 | ||
| + | |} | ||
| + | |||
| + | Key observations from these results include: | ||
| + | |||
| + | *The Analysis started with a basic frame made of the composite material (foam and stainless steel). Due to the major effects of gravity on the chamber, this composite material produced good results with respect to self-weight deflection due to its ery low density and considerably high Young's Modulus. | ||
| + | |||
| + | *Analysis set 1 is just the analysis with gravity effects with no external loading. The very first analysis (1.1) is with hinge constraints and no ball joint. The max deflection is about 1.53 mm. By adding a ball joint (1.2) reduced the deflection to 0.22 mm. With this gravity orientation, the chamber is resting its weight on the ball joint. This tells us that the ball joint is very supportive in reducing the max deflection in every case. | ||
| + | |||
| + | *Analysis set 2 adds wire tensions to the end plates with and without the ball joint, with and without gravity. The max deflections observed are approximately 19 mm. | ||
| + | |||
| + | *Analysis set 3 is a step further in trying to reduce the deflection by adding six carbon fiber rods to the upstream side of the chamber. The endplate deflection is reduced to about 1.2 mm. | ||
| + | |||
| + | *Analysis set 4 includes the effects of the hexcel backing sheet without carbon fiber rods. Under the same conditions, the deflection is reduced from 19 mm (without Hexcel) to 0.3 mm. | ||
| + | |||
| + | *Analysis set 5 is a combination of sets 3 and 4 (the inclusion of both carbon fiber rods and the Hexcel backing sheet). Without the ball joint, the maximum total deflection of the endplates was 0.09 mm, whereas by adding the ball joint, the deflection is further reduced to 0.016 mm. | ||
| + | |||
| + | *Analysis set 6 includes gravity effects only with both the carbon fiber rods and the Hexcel backing sheet. | ||
| + | |||
| + | The next step in the analysis process (currently underway) is to include the mylar front sheet and the effects of a possitive gas pressure on both the deformation of the mylar as well as the added loading to the endplates. | ||
| + | |||
| + | ===Analysis === | ||
| + | |||
| + | ====Analysis 1==== | ||
| + | Analysis 1 is an effort to understand the effects of gravity in its orientation with 2 different kinds of constraints | ||
| + | =====Analysis 1.1===== | ||
| + | Analysis 1.1 describes the effects of gravity on the frame when hinge 1 and hinge 2 are active with no active ball joint at the nose plate. Wire tensions are not applied i.e no external loading. In this model hexcel sheet and carbon rods are not included. | ||
| + | A Report of the analysis is available at [[Image:Analysis_1.1.pdf]] | ||
| + | |||
| + | |||
| + | As the nose is free to move, the Maximum Total Deflection is observed at the nose and the deflection is gradually reduced towards the hinge side. Due to self weight, the deflection in X-direction is close to zero at those hinges and maximum in the negative side of x. The Y-deflection is more at the middle of the end plates in opposite directions. The Z-deflection is more at the nose plate as the chamber is observed to be tilted towards the Target center in the negative Z-side. | ||
| + | |||
| + | {| align="center" border="0" | ||
| + | |- | ||
| + | |[[Image:R3_3D_Analysis1.1d.jpg| 700px]] | ||
| + | |} | ||
| + | {| | ||
| + | |- | ||
| + | |||
| + | |- | ||
| + | |[[Image:R3_3D_Analysis1.1x.jpg| 410 px]]||[[Image:R3_3D_Analysis1.1y.jpg| 410 px]]||[[Image:R3_3D_Analysis1.1z.jpg| 410 px]] | ||
| + | |||
| + | |} | ||
| + | |- | ||
| + | | Figure A.2: Images of Deflection for Analysis 1.1 in D,X,Y,Z Directions respectively | ||
| + | |||
| + | =====Analysis 1.2===== | ||
| + | Analysis 1.1 describes the effects of gravity on the frame when hinge 1, hinge 2 and ball joint are active. Wire tensions are not applied i.e no external loading. In this model also, hexcel sheet and carbon rods are not included. | ||
| + | A Report of the analysis is available at [[Image:Analysis_1.2.pdf]] | ||
| + | |||
| + | In this case The nose plate is supported with a ball joint under the nose plate. so, It is like the chamber is made to rest on the ball joint with supported hinges on the top. | ||
| + | so, the total deformation at the nose plate and the hinges is observed to be minimum and the end plates gave an impression as they sag in the middle. Other than that, the base plate on the top also sagged below due to its own self weight. Due to gravity effects, the X-direction deflection is observed to be maximum almost at the center of the endplates. The Y-deflection gave an impression as it is symmetric in the way the end plates are bowed outward. Z-deformation is maximum in the direction away away from the target center at the middle of the back plate. The back plate on each piece will not be mounted parallel to the ground. so, the deflection is in the positive z direction. | ||
| + | {| align="center" border="0" | ||
| + | |- | ||
| + | |[[Image:R3_3D_Analysis1.2d.jpg| 700 px]] | ||
| + | |} | ||
| + | {| | ||
| + | |- | ||
| + | |[[Image:R3_3D_Analysis1.2x.jpg| 410 px]]||[[Image:R3_3D_Analysis1.2y.jpg| 410 px]]||[[Image:R3_3D_Analysis1.2z.jpg| 410 px]] | ||
| + | |||
| + | |} | ||
| + | |- | ||
| + | | Figure A.3: Images of Deflection for Analysis 1.2 in D,X,Y,Z Directions respectively | ||
| + | |||
| + | ====Analysis 2==== | ||
| + | This is the step of analysis where the wire tensions are applied to the basic frame where the carbon rods and hexcel sheet is not modeled for the analysis. | ||
| + | =====Analysis 2.1===== | ||
| + | A Report of the analysis is available at [[Image:Analysis_2.1.pdf]] | ||
| + | |||
| + | In this analysis, the deformation is pretty much dominated by the wire tensions. Now the end plates are bowed inward and the base plate has minimum deflection. whatsoever, The nose plate side is slightly pulled towards the target side even without the gravity effects and it can be observed in the Z-deformation image. Overall, the deformation is too huge and is approximately about 20mm. the maximum deformation is observed at the end plates. | ||
| + | {| align="center" border="0" | ||
| + | |- | ||
| + | |[[Image:R3_3D_Analysis2.1d.jpg| 700 px]] | ||
| + | |||
| + | |} | ||
| + | {| | ||
| + | |[[Image:R3_3D_Analysis2.1x.jpg| 410 px]]||[[Image:R3_3D_Analysis2.1y.jpg| 410 px]]||[[Image:R3_3D_Analysis2.1z.jpg| 410 px]] | ||
| + | |} | ||
| + | |- | ||
| + | | Figure A.4: Images of Deflection for Analysis 2.1 in D,X,Y,Z Directions respectively | ||
| + | |||
| + | =====Analysis 2.2===== | ||
| + | A Report of the analysis is available at [[Image:Analysis_2.2.pdf]] | ||
| + | |||
| + | The deformations observed with the ball joint is pretty close to the deformations observed without a ball joint. however, the deformations are slightly lesser than previous especially at the nose plate with the extra constraint of the ball joint. The maximum deflection is observed along the end plates. | ||
| + | {| align="center" | ||
| + | |- | ||
| + | |[[Image:R3_3D_Analysis2.2d.jpg| 700 px]] | ||
| + | |} | ||
| + | {| | ||
| + | |[[Image:R3_3D_Analysis2.2x.jpg| 410 px]]||[[Image:R3_3D_Analysis2.2y.jpg| 400 px]]||[[Image:R3_3D_Analysis2.2z.jpg| 400 px]] | ||
| + | |} | ||
| + | |- | ||
| + | | Figure A.5: Images of Deflection for Analysis 2.2 in D,X,Y,Z Directions respectively | ||
| + | |||
| + | =====Analysis 2.3===== | ||
| + | A Report of the analysis is available at [[Image:Analysis_2.3.pdf]] | ||
| + | |||
| + | In this case the addition of gravity reduced the magnitude of deflection. With out the wire tensions, under gravity the end plates are bowed outward about 2mm in analysis 0.2 and with the wire tensions under no gravity, they are deflected inwards for about 19.5mm in analysis 2.2. Now by putting both the cases together, the deformation is a compromise of both and it is observed as 18.6mm bowing inwards. The maximum deflection is observed along the end plates. | ||
| + | {| align="center" | ||
| + | |- | ||
| + | |[[Image:R3_3D_Analysis2.3d.jpg| 700 px]] | ||
| + | |} | ||
| + | {| | ||
| + | |[[Image:R3_3D_Analysis2.3x.jpg| 410 px]]||[[Image:R3_3D_Analysis2.3y.jpg| 410 px]]||[[Image:R3_3D_Analysis2.3z.jpg| 410 px]] | ||
| + | |} | ||
| + | |- | ||
| + | | Figure A.6: Images of Deflection for Analysis 2.3 in D,X,Y,Z Directions respectively | ||
| + | |||
| + | ====Analysis 3==== | ||
| + | |||
| + | Addition of carbon rods reduced the deflection to a very great extent, from 19-20mm to about 1.5-1.0mm. | ||
| + | The maximum deflection is observed on the middle sections of the carbon rods. They are bowed outwards. the end plate towards the carbon rod side is almost zero and the non carbon rod side of the end plate has 0.8-1.15mm. With the ball joint and the influence of gravity, they are some slight deformations on the back plate towards the gravity. However the role of carbon rods made things quite clear by reducing the deflection the greatest extent. | ||
| + | |||
| + | =====Analysis 3.1===== | ||
| + | This analysis is carried with no ball joint and no gravity effects. Six carbon rods were modeled to the upstream side of the chamber. The maximum deformation is observed at one of the mid sections of the carbon rods. As this analysis is without the gravity effects and the nose plate is not constrained with the ball joint, we can see a major deflection at the nose plate. however, the end plates were deflected to about 1.2mm at the non carbon rod end. | ||
| + | A Report of the analysis is available at [[Image:Analysis_3.1.pdf]] | ||
| + | |||
| + | {| align="center" | ||
| + | |- | ||
| + | |[[Image:R3_3D_Analysis3.1d.jpg| 700 px]] | ||
| + | |||
| + | |} | ||
| + | {| | ||
| + | |[[Image:R3_3D_Analysis3.1x.jpg| 410 px]]||[[Image:R3_3D_Analysis3.1y.jpg| 410 px]]||[[Image:R3_3D_Analysis3.1z.jpg| 410 px]] | ||
| + | |||
| + | |} | ||
| + | |- | ||
| + | | Figure A.7: Images of Deflection for Analysis 3.1 in D,X,Y,Z Directions respectively | ||
| + | |||
| + | =====Analysis 3.2===== | ||
| + | |||
| + | Here, the ball joint reduced the ability of the chamber to move. The maximum deformation is observed at the nose carbon rod edge of the end plate. The maximum deformation is observed to be about 1.15mm. this deflection is more of a factor of the wire tensions. | ||
| + | A Report of the analysis is available at [[Image:Analysis_3.2.pdf]] | ||
| + | |||
| + | |||
| + | {| align="center" | ||
| + | |- | ||
| + | |[[Image:R3_3D_Analysis3.2d.jpg| 700 px]] | ||
| + | |} | ||
| + | {| | ||
| + | |[[Image:R3_3D_Analysis3.2x.jpg| 410 px]]||[[Image:R3_3D_Analysis3.2y.jpg| 410 px]]||[[Image:R3_3D_Analysis3.2z.jpg| 410 px]] | ||
| + | |} | ||
| + | |- | ||
| + | | Figure A.8: Images of Deflection for Analysis 3.2 in D,X,Y,Z Directions respectively | ||
| + | |||
| + | =====Analysis 3.3===== | ||
| + | This analysis with the gravity and ball joint, gives an expected shape of deformation. The maximum deformation is observed at the mid sections of the top carbon rods and the edges of the end plates. The nose plate has a little deflection of about 0.2mm. The deformation at the hinge section is almost zero. The gravity loads actually helped in reducing the deformation at this orientation. | ||
| + | A Report of the analysis is available at [[Image:Analysis_3.3.pdf]] | ||
| + | {| align="center" | ||
| + | |- | ||
| + | |[[Image:R3_3D_Analysis3.3d.jpg| 700 px]] | ||
| + | |} | ||
| + | {| | ||
| + | |[[Image:R3_3D_Analysis3.3x.jpg| 410 px]]||[[Image:R3_3D_Analysis3.3y.jpg| 410 px]]||[[Image:R3_3D_Analysis3.3z.jpg| 410 px]] | ||
| + | |} | ||
| + | |- | ||
| + | | Figure A.9: Images of Deflection for Analysis 3.3 in D,X,Y,Z Directions respectively | ||
| + | |||
| + | ====Analysis 4==== | ||
| + | |||
| + | Analysis set 4 is with the hexcel sheet and with no carbon rods. hexcel sheet is mounted on the downstream side of the flow. As expected hexcel sheet reduced the deflection even better than the carbon rods, From 19mm to 0.3mm. The max deflection is observed at the non hexcel sheet side on the end plates. Symmetric deflection is observed. However, the hexcel sheet is bowed inward i.e towards the wire inside the chamber by about. 0.025mm. This can be observed in the Z-deformation images. presence of the ball joint didnt make a lot of difference. | ||
| + | |||
| + | =====Analysis 4.1===== | ||
| + | This analysis revealed the importance of hexcel sheet and it reduced the deformation even better than carbon rods. | ||
| + | The drawing shows the symmetric deformation with the maximum value at the non hexcel edge of the end plate. The deformation observed on the hexcel sheet is very minimal and that very minimal value is towards the wire in the chamber. | ||
| + | A Report of the analysis is available at [[Image:Analysis_4.1.pdf]] | ||
| + | {| align="center" | ||
| + | |- | ||
| + | |[[Image:R3_3D_Analysis4.1d.jpg| 700 px]] | ||
| + | |} | ||
| + | {| | ||
| + | |[[Image:R3_3D_Analysis4.1x.jpg| 410 px]]||[[Image:R3_3D_Analysis4.1y.jpg| 410 px]]||[[Image:R3_3D_Analysis4.1z.jpg| 410 px]] | ||
| + | |} | ||
| + | |- | ||
| + | | Figure A.10: Images of Deflection for Analysis 4.1 in D,X,Y,Z Directions respectively | ||
| + | |||
| + | =====Analysis 4.2===== | ||
| + | The presence of ball joint didnt effect the location of maximum deformation at all. It is still observed at the edges of the end plate. The value is about 0.28mm | ||
| + | A Report of the analysis is available at [[Image:Analysis_4.2.pdf]] | ||
| + | {| align="center" | ||
| + | |[[Image:R3_3D_Analysis4.2d.jpg| 700 px]] | ||
| + | |} | ||
| + | {| | ||
| + | ||[[Image:R3_3D_Analysis4.2x.jpg| 410 px]]||[[Image:R3_3D_Analysis4.2y.jpg| 410 px]]||[[Image:R3_3D_Analysis4.2z.jpg| 410 px]] | ||
| + | |} | ||
| + | |- | ||
| + | | Figure A.11: Images of Deflection for Analysis 4.2 in D,X,Y,Z Directions respectively | ||
| + | |||
| + | =====Analysis 4.3===== | ||
| + | The gravity effect at this orientation increased the max deformation along the end plates by about 0.02mm. The maximum deformation is still at the edges of the end plate. | ||
| + | A Report of the analysis is available at [[Image:Analysis_4.3.pdf]] | ||
| + | {| align="center" | ||
| + | |- | ||
| + | |[[Image:R3_3D_Analysis4.3d.jpg| 700 px]] | ||
| + | |} | ||
| + | {| | ||
| + | |[[Image:R3_3D_Analysis4.3x.jpg| 410 px]]||[[Image:R3_3D_Analysis4.3y.jpg| 410 px]]||[[Image:R3_3D_Analysis4.3z.jpg| 410 px]] | ||
| + | |} | ||
| + | |- | ||
| + | | Figure A.12: Images of Deflection for Analysis 4.3 in D,X,Y,Z Directions respectively | ||
| + | |||
| + | ====Analysis 5==== | ||
| + | |||
| + | The Individual addition of both carbon rods and hexcel sheet in the geometry greatly reduced the maximum deformation. Now, in this analysis Both of them are modeled at the same time. | ||
| + | In the very first analysis, without the ball joint, the maximum deflection is observed at the nose plate as it is free to move. however, after adding ball joint, the deflection is observed to be 20 microns at one of the carbon rod bowing away from the wires. The max deflection at the edge of the end plate is about 16 microns. Gravity increased the deflection at the carbon rod and made a very slight change on the deflection at the back plate and along the edge of the end plate. | ||
| + | |||
| + | =====Analysis 5.1===== | ||
| + | This analysis has both carbon rods and the hexcel sheet to reduce the deformation. This model is not constrained at the ball joint and the gravity wasn't modeled. So, the maximum deformation is observed at the nose plate which is about 123 microns. The deformation is observed to be reducing to the back plate side along the end plate. The carbon rods were slightly bowed out in the upward direction. | ||
| + | |||
| + | A Report of the analysis is available at [[Image:Analysis_5.1.pdf]] | ||
| + | {| align="center" | ||
| + | |[[Image:R3_3D_Analysis5.1d.jpg| 700 px]] | ||
| + | |} | ||
| + | {| | ||
| + | |[[Image:R3_3D_Analysis5.1x.jpg| 410 px]]||[[Image:R3_3D_Analysis5.1y.jpg| 410 px]]||[[Image:R3_3D_Analysis5.1z.jpg| 410 px]] | ||
| + | |} | ||
| + | |- | ||
| + | | Figure A.13: Images of Deflection for Analysis 5.3 in D,X,Y,Z Directions respectively | ||
| + | |||
| + | =====Analysis 5.2===== | ||
| + | The deformation shape is completely changed with the addition of the ball joint. The deformation lost its symmetric values. The maximum total deformation is observed at the carbon rods. The longest carbon rod at the very top is observed to hold the maximum deformation of about 20 microns. However, the maximum deformation observed along the end plate is about 16 microns. | ||
| + | A Report of the analysis is available at [[Image:Analysis_5.2.pdf]] | ||
| + | {| align="center" | ||
| + | |- | ||
| + | |[[Image:R3_3D_Analysis5.2d.jpg| 700 px]] | ||
| + | |} | ||
| + | {| | ||
| + | |[[Image:R3_3D_Analysis5.2x.jpg| 410 px]]||[[Image:R3_3D_Analysis5.2y.jpg| 410 px]]||[[Image:R3_3D_Analysis5.2z.jpg| 410 px]] | ||
| + | |} | ||
| + | |- | ||
| + | | Figure A.14: Images of Deflection for Analysis 5.2 in D,X,Y,Z Directions respectively | ||
| + | |||
| + | |||
| + | =====Analysis 5.3===== | ||
| + | |||
| + | Analysis 5.3 considers the end plate deflection due to the wire tension and gravity for a chamber which includes carbon rods and a Hexcel backing plate. The impact of having a ball joint and enclosing the front of the chamber with a mylar sheet is not included in this analysis. With the addition of gravity, the deformation is observed to retain the symmetric shape. Even the back plate is deformed and the bending is observed along the gravity vector. The deformation at the nose plate is about 7 microns. When gravity is included, the maximum deformation is observed at the very top carbon rod like in every other gravity case. The maximum deformation observed along the end plate is about 21 microns. Figure 5.2.1.1 shows the ANSYS FEA results for this analysis. The remaining configurations are shown in the appendices section (8) at the end of this report. Every section is described with the supporting images of deflection and a complete report available in pdf at their individual sections | ||
| + | |||
| + | The report generated by ANSYS is available: [[Image:Analysis_5.3.pdf]] | ||
| + | {| align="center" | ||
| + | |- | ||
| + | |[[Image:R3_3D_Analysis5.3d.jpg| 700 px]] | ||
| + | |} | ||
| + | |||
| + | {| | ||
| + | |[[Image:R3_3D_Analysis5.3x.jpg| 410 px]]||[[Image:R3_3D_Analysis5.3y.jpg| 410 px]]||[[Image:R3_3D_Analysis5.3z.jpg| 410 px]] | ||
| + | |||
| + | |} | ||
| + | |||
| + | Figure 5.2.1.1: Images of Deflection for Analysis 5.3 in D,X,Y,Z Directions respectively | ||
| + | |||
| + | ====Analysis 6==== | ||
| + | |||
| + | This analysis is just to verify the gravity effects with no external loading. The results are very straight forward that the max deflection is at the nose plate when there is no ball joint, and with the ball joint the max deflection is at the top carbon rod as it is the longest of all the carbon rods and is heavier than the other carbon rods. The max deflection is at the center of that carbon rod. | ||
| + | |||
| + | =====Analysis 6.1===== | ||
| + | Gravity with no ball joint and with no external loading. The maximum deformation is observed at the nose plate and the deformation is observed to be linearly reducing towards the hinges. | ||
| + | A Report of the analysis is available at [[Image:Analysis_6.1.pdf]] | ||
| + | {| align="center" | ||
| + | |[[Image:R3_3D_Analysis6.1d.jpg| 700 px]] | ||
| + | |} | ||
| + | {| | ||
| + | |[[Image:R3_3D_Analysis6.1x.jpg| 410 px]]||[[Image:R3_3D_Analysis6.1y.jpg| 410 px]]||[[Image:R3_3D_Analysis6.1z.jpg| 410 px]] | ||
| + | |} | ||
| + | |- | ||
| + | | Figure A.15: Images of Deflection for Analysis 6.1 in D,X,Y,Z Directions respectively | ||
| + | =====Analysis 6.2===== | ||
| + | With the addition of ball joint, the deformation close to nose plate is almost negligible. The maximum deflection is at the top carbon rod which is not of importance. The maximum total deflection at the end plate is about 16 microns | ||
| + | A Report of the analysis is available at [[Image:Analysis_6.2.pdf]] | ||
| + | {| align="center" | ||
| + | |||
| + | |[[Image:R3_3D_Analysis6.2d.jpg| 700 px]] | ||
| + | |} | ||
| + | {| | ||
| + | |[[Image:R3_3D_Analysis6.2x.jpg| 410 px]]||[[Image:R3_3D_Analysis6.2y.jpg| 410 px]]||[[Image:R3_3D_Analysis6.2z.jpg| 410 px]] | ||
| + | |} | ||
| + | |- | ||
| + | | Figure A.16: Images of Deflection for Analysis 6.2 in D,X,Y,Z Directions respectively | ||
| + | |||
| + | ===Summary=== | ||
| + | The amount of endplate deflection for several region three drift chamber designs was evaluated using ANSY. The wire tension load results in the most end plate deflection while the deflection due to gravity is an order of magnitude less. The wire tension creates the maximum deformation in the mid sections of the end plates. To reduce this effect, carbon rods on the front of the end plate and a hexcel sheet on the rear were added to the drift chamber frame. The addition of these two elements reduced the end plate deflection from 18.6 mm 0.021 mm. A deflection of 21 microns is within the end plate deflection design goal of 50 microns. A Buckling analysis of the longest carbon fiber rod indicates that the threshold force is 20 times greater than the expected applied load. The next phase of this analysis is to (1) refine and verify the loading conditions, (2) include the effects of a positive gas pressure inside the chamber (mylar front sheet), and (3) determine mechanical connections between components. | ||
=References= | =References= | ||
| − | [Mestayer07] "Tracking Detectors for CLAS12", 1/9/07, Mac Mestayer, Collaboration Document. | + | #[Mestayer07] "Tracking Detectors for CLAS12", 1/9/07, Mac Mestayer, Collaboration Document. |
| + | #[Mestayer00] M.D. Mestayer, et. al., NIM, A449, pg 81, 2000 [[Media:NIM_A449.pdf]] | ||
| + | #[Craig96] Mechanics of Materials, Roy R. Craig Jr., John Wiley & Sons, 1996 | ||
| + | |||
| + | |||
| + | |||
[http://www.iac.isu.edu/mediawiki/index.php/R3#2-08_Report Go Back] | [http://www.iac.isu.edu/mediawiki/index.php/R3#2-08_Report Go Back] | ||
Latest revision as of 11:10, 9 May 2008
Introduction
The Region 3 Drift Chamber (R3 DC) conceptual design for the Hall-B 12-GeV upgrade (CLAS12) is described below. One of the design objectives is to achieve nearly full acceptance, in the lab frame, for relativistic forward-boosted final-state particles while maintaining a momentum resolution of 0.5 to 1% for a 5-GeV charged particle. Six identical R3 DCs are presently located 4.7 meters from the target and together will have a azimuthal coverage and presently span from 5 to 45 degrees in polar angle as measured from the direction of the electron beam. The central plane through the R3 DC will be tilted 25 degrees from a perpendicular to the beam line towards the target. The shadow of the toroidal coils will result in a minimum gap of 16 cm between each R3 DC and will hinder reconstructing the trajectory of scattered particles in that region. This space will house the readout boards, attendant electronics, cabling, etc. The active area for each R3 DC will then be [60 - ?] in azimuth,
The R3 DC design for CLAS12 is based on the successful hexagonal cell structure of the current CLAS R3 DC. The design criteria is delineated below:
- Smaller cell size of 2.07 cm to accommodate a luminosity of and maintain an accidental occupancy of less the 4% for high tracking efficiency..
- Sense wires will be increased to 30 um from the current 20 um diameter. This means that the wire will require a higher tension to offset droop and electrostatic forces.
- All wires in each superlayer will lie in a plane instead of on a cylindrical surface. The staggered by one half cell or “brick wall pattern” of the hexagonal cells will be maintained for each successive layer.
- To enhance the azimuthal (φ) resolution, each superlayer will be +/- stereo, i.e. the pitch will be +6 degrees in the six layers of the first superlayer and the pitch will be -6 degrees for the second superlayer array of six wire planes. The current R3 DC has 0 and 6 degree pitch respectively for the two superlayers.
- There will be a total of 4928 wires of which 1344 (check this) will be sense wires.
- The endplates will be oriented at 60 degrees with respect to one another. Precisely holes will be drilled into each endplate with tolerance of better than 100 um for the placement of the drift chamber wires. Feed through assemblies are placed in these holes to precisely position the sense, field, and guard wires. The expected overall position accuracy will be 250 um per layer, with a wire location accuracy of 200 um.
- The deflection along the length of the endplates may not exceed 50 um.
- The R3 DCs will be supported from only two points at the outer backplane. This makes the R3 DCs self supporting.
- The nose plate for each R3 DC will be positioned onto a precision support hexagonal ring for aligning all R3 DCs with respect to the surveyed Hall B coordinate system.
The mechanical engineering aspects of the R3 DC is discussed below in light of the above design criteria. We present a two dimensional Finite Element Analysis. The three-dimensional FEA is currently under study
R3 Description
Geometry
An exploded view of a single R3 sector is shown below. The back plate, nose plate, and two endplates (see Figure 2.1) represent the key components to the main ionization chamber structure. The back plate is approximately 5 meters long and will likely have two mount points on the backplate to support and position the drift chambers. The nose plate, which is more than half of a meter long, will hold a ball joint that mounts to a hexagonal ring and constrains the chamber location at a third point. The drift chamber wires are fixed by the endplates and spanning between the endplates are carbon-fiber rods located in the gap near the chamber entrance. These rods reduce endplate deflection arising from the pull from the wire tension, the weight of the chamber, and the differential gas pressure between the chamber and the experimental hall. The front face of the chamber has a thin window so as to present mimimal mass in the path of the charged particles and hence reduce the attendant multiple scattering. The exit window of the chamber is constructed out of Hexcel, a composite honeycomb material, clad with a thin sheet of carbon fiber. This window is so designed as reduce endplate deflections near the back of the chamber. Figure 1.2 shows the side view of a single sector; six of these sectors are oriented around a beam pipe, as shown in Figure 2.3.
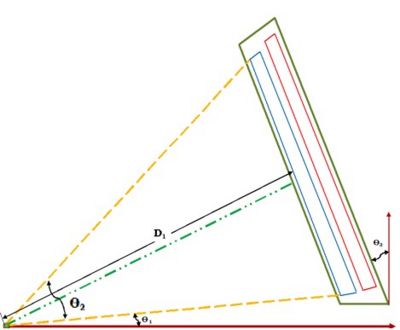 |
| ||||||||||
| Figure 2.2: A side view of a R3 drift chamber. The distance from the target center to the first sense wire is labeled . The min and max acceptance angles are labeled and respectively. The tilt angle with respect to a normal to the beam line is labeled . |
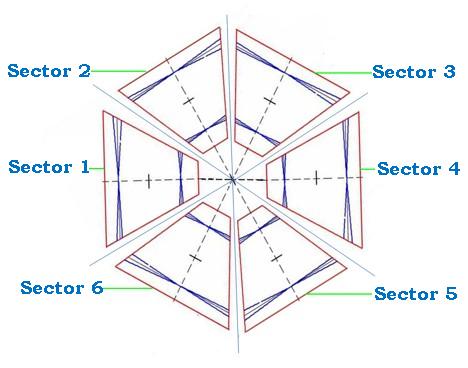 |
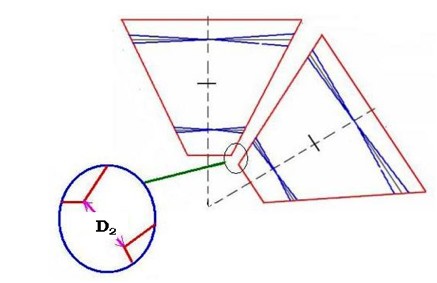
|
| Figure 2.3: View in the direction of the beamline; this shows the symmetrical azimuthal arrangement of the six R3 chambers. |
Mestayer's Geometry Excel Spreadsheet
Material Specifications
Physical properties germane to the materials used to construct the R3 dirft chambers are shown below in Table 1. Endplates for the R3 drift chambers in the previous 6 GeV CLAS detector were fabricated by gluing thin (0.048 inch) stainless steel sheets onto both sides of a 2-inch Polyeurethane foam. The current design expects to use the same structure for the endplates. The use of carbon fiber rods to minimize end plate deflections is another design feature boldly borrowed from the previous 6-GeV CLAS detector design. Aluminum is included below as a cadidate material for capping the edges of the endplates.
Table 1. Material Properties of R3 Components.
| Material | Youngs Modulus | Density |
| Polyeurethane Foam FR-3700 | 240 | |
| Stainless Steel | 8030 | |
| Carbon Fiber Rods | 580 | |
| Aluminum | 2700 |
Approximate Chamber mass
Table 2. Chamber mass
| Part | Dimensions | Density () | Mass (kg) | Mass (lbs) | ||
| End Plate Polyeurethane Foam FR-3700 | 5 m | 0.5 m | 0.05 m | 240 | 30 | |
| End Plate Stainless Steel | 5 m | 0.5 m | 0.001 m | 8030 | 20 kg | |
| Back Plate Aluminum | 5m | 0.5 m | 0.051 | 2700 | 344 kg | |
| Nose Plate Aluminum | 0.5m | 0.15 m | 0.1 | 2700 | 20 kg |
Total mass for end plates and Back plate made from Poly+SS composite = 120 kg
Total mass for composite end plate and aluminum Back plate = 464 kg
Aluminum frame around poly is 20 mm inner width (5 m x 0.5 m x 0.05 m) =
End Plates and Nose Plate Drawings
Preliminary drawings of the end plates (Figure 2.4) and nose plate (Figure 2.5) are shown below. The end plate and nose plate are two critical parts of the chamber. The end plate will provide the support to constrain the detector wires in space whereas the nose plate will determine the tilt angle of the detector and provide a mounting connection.
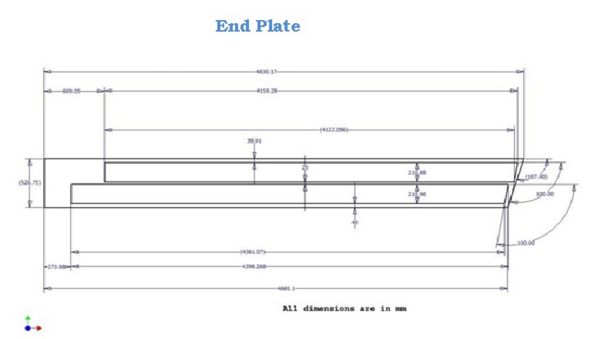 600 px 600 px
|
| Figure 2.4: A preliminary End plate design for R3 Drift Chamber. |
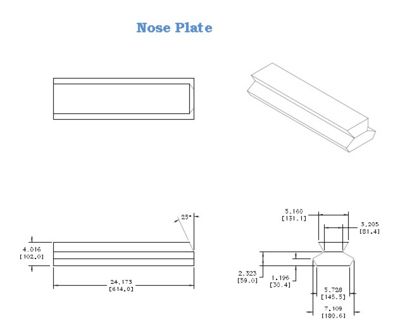
|
| Figure 2.5: A preliminary Nose plate design for R3 Drift Chamber. |
Endplate Deflection
Wire tension
The drift chamber wires are oriented at 6 degrees with respect to the horizontal, as shown in the Figure 3.1. Wires which slope downward from left to right make an angle of with respect to a perpendicular to the endplate and have a force component along the perpendicular of . Wires which slope upward from left to right make an angle with repect to the perpendicular to the endplate of . If T represents the tension in the wire, then the component of this force perpendicular to the endplate is . The net force perpendicular to the endplate will be . There are 112 sense wires in each of the 12 wire layers (2 super layers with 6 wire layers each)[Mestayer07]. Each sense wire is 30 microns in diameter and tensioned using a 20.7 g weight. There are 28 Field wire layers 140 microns in diameter with each wire tensioned at 63 grams and 4 guard wire layers 140 micron in diameter with each wire tensioned at 185 grams. The total tension from all wires on the endplate will be
.
Therefore,
and
- = perpendicular force on an endplate
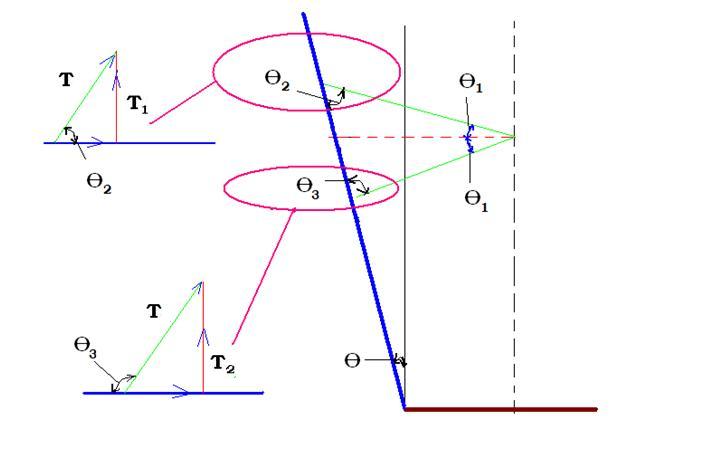
|
| ||||||||||
| Figure 3.1: Sketch identifying the direction of the sense wire tension in terms of the and . |
Point Load Deflection
A simple back-of-the-envelope calculation for deflection was performed assuming aluminum endplates and a point-load force (representing the distributed force from the wires into a single load). The force on an endplate due only to the tension from the 4,928 wires is about 5700 N /2. A simple calculation based on the definition of Young's modulus can yield an order-of-magnitude-level estimate for the deflection of an aluminum endplate in which the wires exert a force perpendicular to the endplate. The deflection of the endplate in terms of Young's Modulus is given by the equation:
where
- Young's Modulus for Aluminum
- point force/load
- width of the endplate
- deflection of endplate due to point force
- length of the endplate
- thickness of the endplate
By substituting in the above values and solvign the equation, a deflection of 7 mm is expected for a 5 cm thick aluminum endplate. If a 5 cm thick stainless steel endplate were used, the deflection would decrease from 7 mm to 2.5 mm (due to the linear dependence of the deflection on the Young's Modulus). The previous work performed by Kevin Folkman at the IAC came to a similar conclusion.
Distributed Load Deflection
The endplate deflection calculations were refined to a more realistic case in which the load is distributed evenly along the endplate. The tension of the wires on the endplate was divided into three regions; W1,W2, and W3. As shown in Figure 3.3.1, the load W3 corresponds to a region along the endplate in which wires from both super layers are creating a load on the endplate. Loads W1 and W2 represent regions in which only a single super layer is causing a load. The endplate is "simply" supported in order to calculate the deflection. The term "simply supported" implies that one side (left side of an endplate for this case) may rotate but not translate (resulting in two reaction forces) whereas the other side (the right side of and endplate for this case) is supported such that it may rotate and translate (resulting in a single, normal reaction force). Figure 7 labels the loads as well as distances over which the loads are applied on the end plate. A total force of 340 lbs exerted by the drift chamber wires is decomposed into its components according to the angle made by the wire on the endplate.
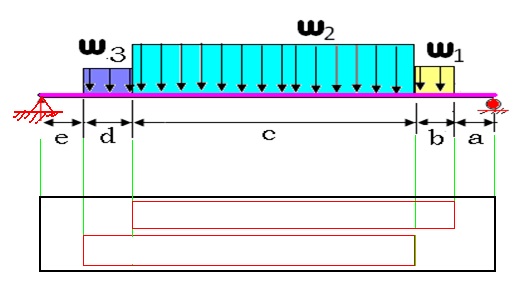
|
| ||||||||||||||||||
| Figure 3.3.1: A diagram of the loads on a simply supported endplate. The table to the right gives the load values and distances. |
The following calculations are in accordance to a standard approach covered in all undergraduate "Mechanics of Materials" engineering courses. This method is based on integrating the elastic curve equation for a beam. The equation of the elastic curve relates deflection (y) to Moments (M) at given linear locations along the beam (x):
where represents Young's Modulus and is the Area Momentum of Inertia. The Area Moment of Inertis is defined as the second moment of an area about a given axis:
- Area moment of inertia about the x-axis.
The mass moment of Inertia is defined as:
In order to perform these calcuations, the following assumption were made:
- The end plate is made of homogenous uniform elastic material with a Young's Modulus of (Stainless Steel).
- The horizontal component of the loading is completely neglected.
- The deflection in the x-direction is negligible.
- The end plate is rectangular in shape with a width of 526 mm and thickness of 50.8 mm resulting area moment of inertia () =5746.4 .
- The loading provided by wire tensions are equivalent to a uniformly distributed load.
- The maximum deflection occurs along the length which is represented by in the diagram.
- The loading applied is under the elastic limit of the material.
- The effects of the endplate weight are ignored.
The moments experienced along the endplate may be divided into 5 separate equations, each equation valid only for its corresponding region:
where represents the linear distance along the endplate. If we assume that the largest magnitude of deflection occurs in region c, then we may integrate the above 2nd order elastic curve equation once and determine the critical point which represents the point of maximum deflection ( contra flexure).
- =
where a constant of integration. Integrating the equation a 2nd time will result in an equation for the amount of the deflection. The constants of integration my be found by applying boundary conditions at points where the deflection is zero (at the ends or and ).
Setting to zero and solving for x gives the linear distance corresponding to the point of maximum deflection of x = 1654.96 mm. In other words, the maximum deflection occurs 1654.96 mm from region of the endplate or mm from the right hand side of the endplate. Substituting the value of x above results in a maximum deflection of 2.2 mm. Note, this deflection is only slightly smaller than that found with a point load assumption and a stainless steel endplate (2.2 mm compared to 2.5 mm, respectively).
Distributed Load FEA
A Finite Element Analysis (FEA) was performed on the same stainless steel endplate design using the commercially available computer software ANSYS. For this analysis, the loading shown previously in the "Distrubuted Load" section was used. The maximum deflection observed from the FEA was 2.14 mm, as shown in Figure 3.4.1; this value differs from the hand calculation by only 3%. In addition to validating the FEA analysis with hand calculations, the above results also reveal the challenge of reducing the endplate deflection using stiffer materials due to an essentially linear dependence of the deflection on the Young's Modulus. The cubic dependence of the deflection on the thickness of the endplate, however, can be used to reach the minimum endplate deflection criteria of 50 , in addition to the us of stiffer material. Increasing the endplate thickness, however, comes at the cost of increasing the end plate mass. As a result, composite materials were considered in order to minimize weight. The performance of these composite materials is shown in the 3-D model section of this report.
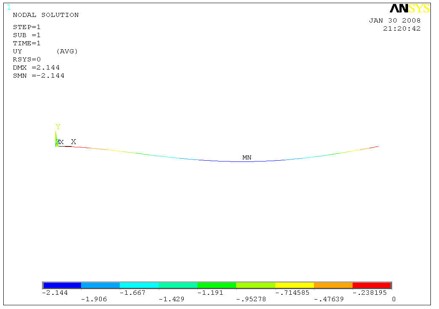
|
| Figure 3.4.1: ANSYS FEA results for deflection of a stainless steel endplate design for a distrubed loading. |
Composite End Plate
Effective Young's Modulus
The R3 endplates used in the CLAS 6 GeV detector were comprised of a polyeurethane foam core 50.8 mm thick (2 inches) with 1.2 mm thick (0.048 inch) stainless steel sheets epoxied to each side, as shown in Figure 3.5.1.
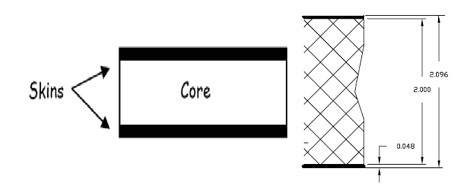
|
| Figure 3.5.1: Polyeurethane foam/stainless steel composite endplate construction and dimensions. |
An effective Young's Modulus () was used in the FEA model in order to simplify the model. The effective Young's Modulus for this endplate, weighted by the volume of each plate, is
where
- inches
- inches
Therefore, the effective Young's Modulus was found to be:
FEA Deflection Results
The effective Young's Modulus of was used to determine the deflection of the endplate due to a distributed load (see Figure 3.5.2). Results indicate a maximum transverse deflection of 32.4 mm which is larger than that observed with the stainless steel material. However, when gravity is included, the composite material will deflect less due to its lower density.
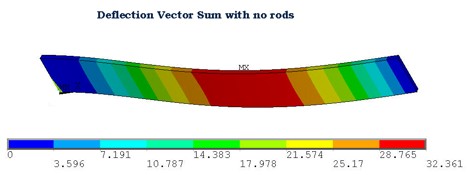
|
| |||||||||||||||
| Figure 3.5.2: FEA predicted deflections for the polyeurethane foam/stainless steel composite endplate. |
Carbon Rod Buckling
A support brace composed of carbon rods was considered in order to reduce the larger deflections of composite endplates compared to endplates made from stainless steel. These rods would be used on the front side of the R3 drift chamber and span between the two endplates. The use of 1" diameter hollow carbon fiber rods with 2 mm thick walls in the 6 GeV R3 design did not appear to appreciably impact the tracking capabilities of the drift chamber. The deflection of these carbon fiber rods was modeled as a separate part in ANSYS and compared with hand calculation.
Compression
If one makes the assumption that the rod buckles by an external force along the length of the rod, then the compression of the rod can be calculated using the definition of Young's Modulus (Y) given by the equation:
where
- Compression force exerted along the end of the rod
- length of the rod = 2.8 m for the longest rod
- cross sections area of the rod =
- rod compression distance =
The force needed to cause the carbon fiber rod to buckle such that the endplate deflects can be estimated by assuming that the length of the rod (2.8 m) compresses by .
The total force along the whole endplate from just the drift chamber wire tension amount to less than 3000 N which is less than a factor of 2 smaller than the force needed to compress a single carbon rod used to brace the endplates. Therefore, placing at least 6 carbon rod braces in the drift chamber should provide substantial support for the endplates.
Buckling Load Threshold
The load at which a carbon fiber rod will start to buckle is given by Euler's formula (defined in any undergraduate "Mechanics of Materials" textbook). Figure 4.2.1 depicts the load configuration on the rod for this calculation.
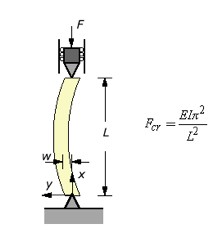
|
| Figure 4.2.1: Sketch showing the definition of Euler's buckling load threshold. |
represent the critical force needed to cause the rod to begin to buckle. Young's Modulus for a carbon fiber rod is 1.5 x 10^11 N/ and the longest rod's half length (L for the above equation) is 1.4 m. The Area Moment of inertia about the end of a hollow cylinder of inner radius and outer radius can be found from:
The buckling force is found to be 36,646N, an order of magnitude larger than the predicted endplate forces.
The above buckling threshold calculation was performed using ANSYS. The results are shown in Figure 4.2.2 and predict a threshold force of 36989 N compared to the 36646 N value found from hand calculations. ANSYS also predicts that the rod will deflect almost 2 mm if the buckling load is reached, no deflection due to buckling will occur before the load level is reached.
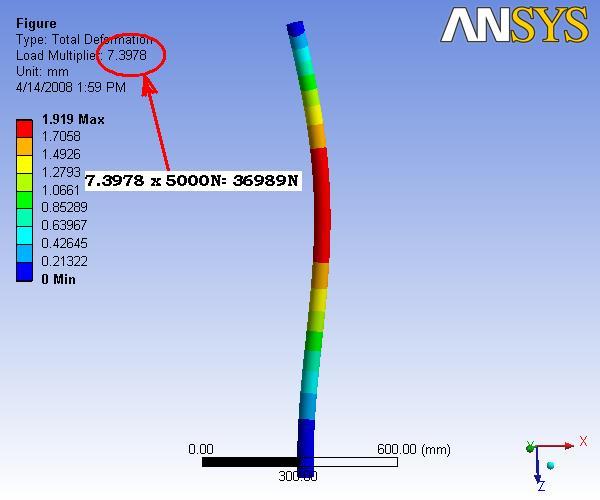
|
| Figure 4.2.2. FEA of the maximum (threshold) force needed to cause a carbon rod to buckle. |
Actual Buckling FEA
In the previous FEA results, both ends of the carbon rods were constrained from moving from x and y directions and does not account for the deflection of the endplates. If the endplates deflect the ends of the carbon rods will be compressed. The buckling load in this case is observed to be 54720.5N as shown below in Figure 4.3.1. In the event that the buckling load is reached, ANSYS predicts a deflection of at least 11 mm will occur. It should also be noted that the buckling does not have a preferred direction making it possible for the middle of the rod to bend in any direction.
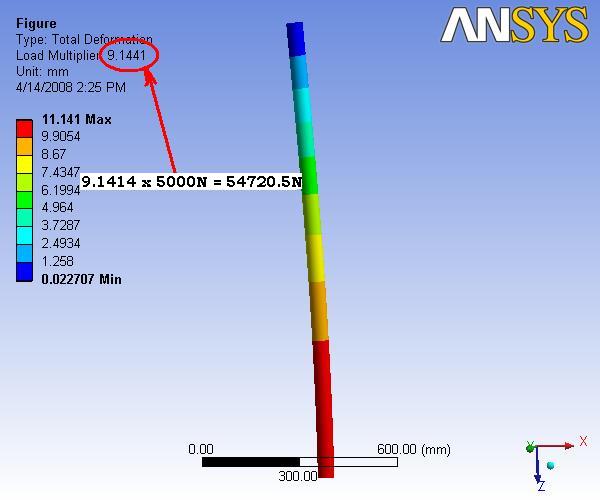
|
| Figure 4.3.1. FEA of the maximum (threshold) force needed to cause a carbon rod to buckle with the real constraints. |
FEA Analysis of a sample sector
The ideal case orientation is used for a basic understanding of the loads and their effective results on the sector. This case has to be considered as a study case and there is no resemblance to any of the 6 six sector orientations.
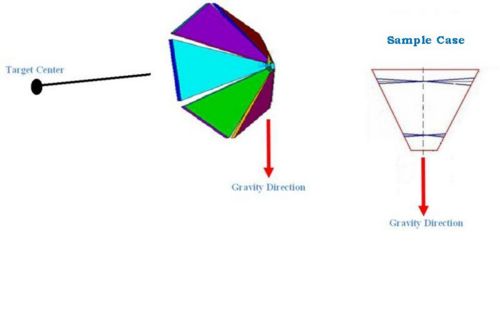
|
| Figure 5.1: Sector orientation and display of ideal case orientation |
This Sector is constrained in 3 regions
A. Left Hinge - Constrained on Y and Z directions and free to move in X direction
B. Right Hinge - Constrained on X and Z directions and free to move in Y direction
C. Nose Plate front face - Constrained on X and Z directions and free to move in Y direction
Wire tensions of 1512N is applied on the all the 4 hole regions at 6 degrees to the horizontal as defined earlier, which pulls the end plates inward.
An Upward acceleration is given to the sector, which applies a downward gravity force to the sector.
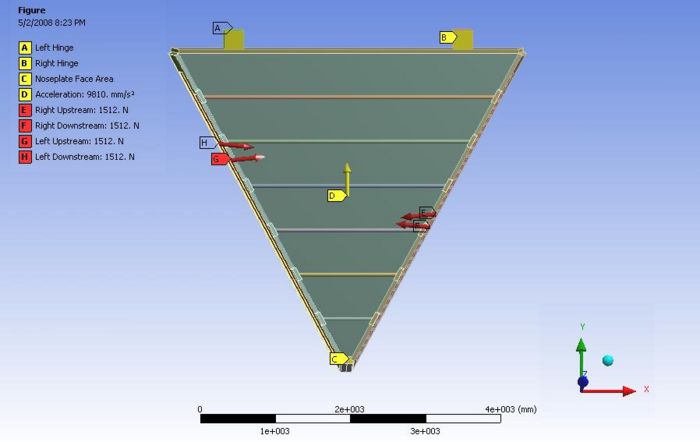
|
| Figure 5.2: Loads and boundary conditions for the FEA 3-D model. This image was taken from the ANSYS FEA program. |
Description of Analysis sets
Four sets of analysis were done with this ideal orientation of the slice. Each Set in turn has 3 different analysis. so, a total of 12 cases of analysis were carried out in this section.
Analysis set 1 - Just the basic frame with No Carbon Rods and No hexcel sheet
Analysis Set 2 - Carbon Fiber rods were introduced to the geometry on the upstream side
Analysis Set 3 - Carbon Fiber rods were removed on the upstream side and Hexcel Backing sheet was introduced on the downstream side of the sector.
Analysis set 4 - Both the carbon fiber rods and the hexcel backing sheet were modeled at the same time on upstream and downstream side of the sector respectively.
As mentioned above, every analysis set has 3 cases referenced as .1, .2 and .3 succeeding the analysis set number. For example, Case 2 for analysis set 3 will be mentioned as 3.2
Case 1 - Just the gravity Loading with no wire tensions applied in their respective sets
Case 2 - Just the wire tensions were applied with no gravity loading in their respective sets
Case 3 - Both Gravity and wire tensions are applied in their respective sets.
So, analysis 3.2 has hexcel sheet on the downstream side and there are no carbon fiber rods on the upstream side and wire tensions are the only load with no gravity loading.
Table of Results
The results for the deflection in mm are displayed in the following table. A yes in the table means the presence of the header in the geometry and simulation while a No is the opposite.
E max can be understood as the maximum total deflection in mm on the end plate at any point
D max is the maximum total deflection in mm on the whole slice.
X max is the maximum X directional deflection in mm on the whole sector. A negative sign resembles the deflection to the left side.
Y max is the maximum Y directional deflection in mm on the whole sector. A negative sign resembles the deflection in downward direction.
Z max is the maximum Z directional deflection in mm. A negative sign resembles the deflection away from the target center
E max can be considered as the point of interest as D max can be on any point like on the carbon fiber rod or the backing plate, which are of the least interest to know at this point of time.
| Deflection | Gravity | Wire Tensions | Rods | Hexcel | E max(mm) | D max(mm) | X max(mm) | Y max(mm) | Z max(mm) | |
| Analysis 1.1 | Yes | No | No | No | 0.973 | 0.973 | 0.557 | -0.838 | -0.131 | |
| Analysis 1.2 | No | Yes | No | No | 3.202 | 3.202 | -2.895 | 1.530 | -0.048 | |
| Analysis 1.3 | Yes | Yes | No | No | 2.555 | 2.555 | 2.393 | 0.897 | 0.085 | |
| Analysis 2.1 | Yes | No | Yes | No | 0.871 | 0.1.119 | 0.208 | -1.119 | -0.211 | |
| Analysis 2.2 | No | Yes | Yes | No | 0.689 | 0.689 | 0.538 | 0.334 | 0.653 | |
| Analysis 2.3 | Yes | Yes | Yes | No | 0.880 | 1.132 | 0.579 | -1.131 | 0.596 | |
| Analysis 3.1 | Yes | No | No | yes | 0.036 | 0.036 | 0.014 | -0.032 | 0.024 | |
| Analysis 3.2 | No | Yes | No | yes | 0.103 | 0.115 | 0.089 | 0.050 | -0.052 | |
| Analysis 3.3 | Yes | Yes | No | yes | 0.080 | 0.090 | 0.089 | -0.042 | -0.054 | |
| Analysis 4.1 | Yes | No | Yes | yes | 0.047 | 0.106 | -0.010 | -0.105 | 0.029 | |
| Analysis 4.2 | No | Yes | Yes | yes | 0.020 | 0.022 | 0.019 | 0.015 | -0.014 | |
| Analysis 4.3 | Yes | Yes | Yes | yes | 0.054 | 0.096 | 0.017 | 0.013 | 0.036 |
Analysis
Analysis is carried out step by step in an incremental order by comparing results and effects of each geometric addition. Analysis set 4.3 is the final analysis set which is more of consideration. So, the pictures related to the set 4.3 is displayed and discussed here. However, data related to all the remaining 11 sets will be placed on the appendices section after the summary section. each section will have a pdf file which is the report file generated at the time of analysis and are available at their respective sections for future reference.
Analysis 4.3
Analysis 4.3 Includes the Carbon fiber rods and hexcel backing sheet. Both Gravity and wire loads were applied.
The report generated by ANSYS is available: File:Analysis slice 4.3.pdf
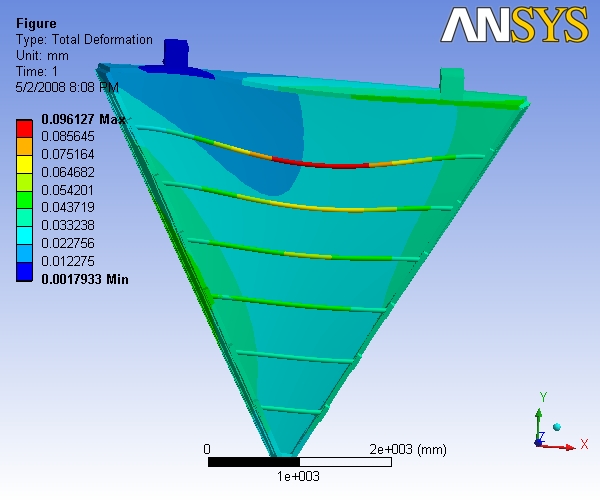
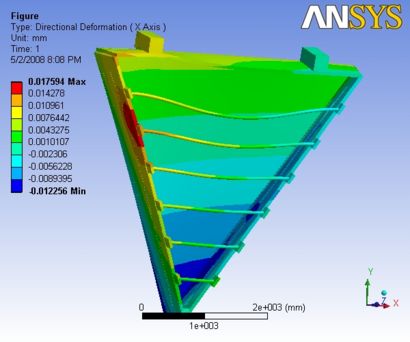 |
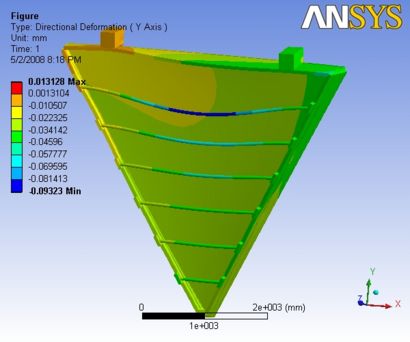 |
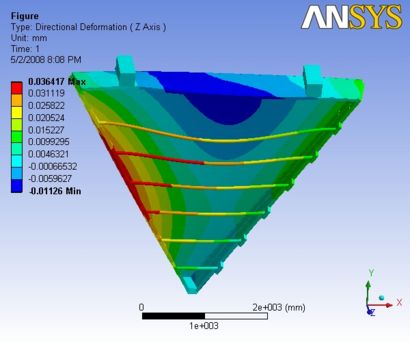
|
Figure 5.3.1.1: Images of Deflection for Analysis 4.3 in D,X,Y,Z Directions respectively
FEA Analysis to find the maximum deformation in each orientation
Description
Due to the effect of the gravity the Maximum deformation at the end plates is observed at the sectors 1 and 4. This analysis is an effort to minimize this deformation by interchanging the hinge constraints in both the cases.
| Analysis | Sector Orientation | Hinge A constraint | Hinge B Constraint | Nose Plate | |
| Sector 1 | Analysis 1.1 | 1 | Y,Z | X,Z | X,Z |
| Analysis 1.2 | 1 | X,Z | Y,Z | Y,Z | |
| Sector 4 | Analysis 4.1 | 4 | Y,Z | X,Z | X,Z |
| Analysis 4.2 | 4 | X,Z | Y,Z | Y,Z |
Sector 1 and Sector 4 respectively
Table of results
| Deformation (mm) | ||||||
| Analysis | E Max | D Max | X Max | Y Max | Z Max | |
| Sector 1 | Analysis 1.1 | 0.041 | 0.041 | -0.038 | 0.026 | 0.016 |
| Analysis 1.2 | 0.110 | 0.110 | -0.107 | -0.037 | 0.045 | |
| Sector 4 | Analysis 4.1 | 0.056 | 0.056 | 0.051 | 0.031 | 0.027 |
| Analysis 4.2 | 0.107 | 0.107 | 0.107 | 0.032 | -0.043 |
After looking at the results, analysis 1.1 and analysis 4.1 were observed with the least deflections for sector 1 and sector 4 respectively. So, these results were refined by
1. Refining the mesh size.
2. Sandwiching the Hexcel backing sheet with carbon fiber slices.
3. Removing the hinges and applying the constraints over the hinge area.
4. Making single parts for each end plates.
| Deformation (mm) | ||||||
| Analysis | E Max | D Max | X Max | Y Max | Z Max | |
| Sector 1 | Analysis 1.1 Refined | 0.043 | 0.043 | -0.040 | 0.027 | 0.027 |
| Sector 4 | Analysis 4.1 Refined | 0.040 | 0.040 | 0.036 | 0.027 | 0.019 |
Sector 1
Analysis 1.1
The report generated by ANSYS is available: File:Analysis sector 1.1.pdf
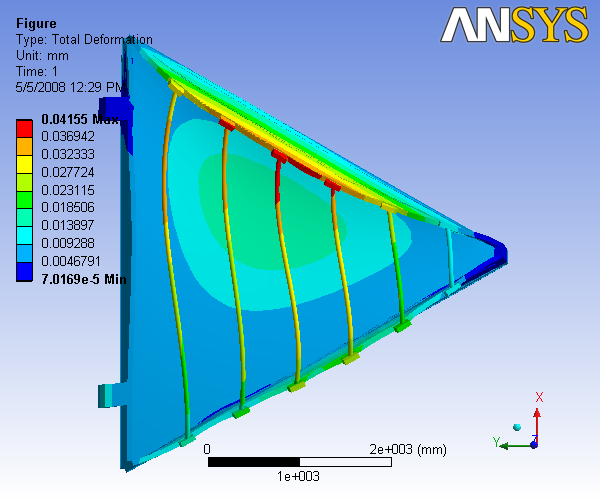
|
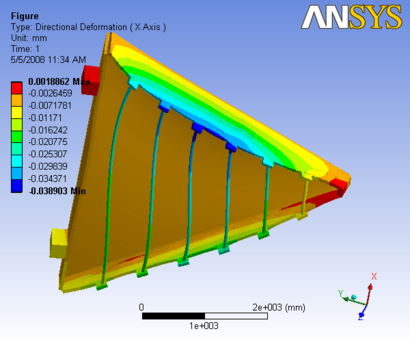 |
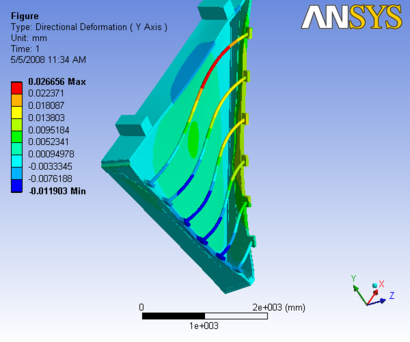 |
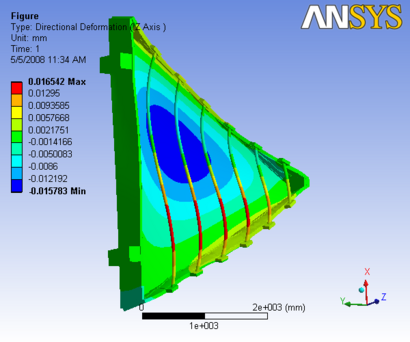
|
Figure 1.1: Images of Deflection for Analysis 1.1 in D,X,Y,Z Directions respectively
Analysis 1.2
The report generated by ANSYS is available: File:Analysis sector 1.2.pdf
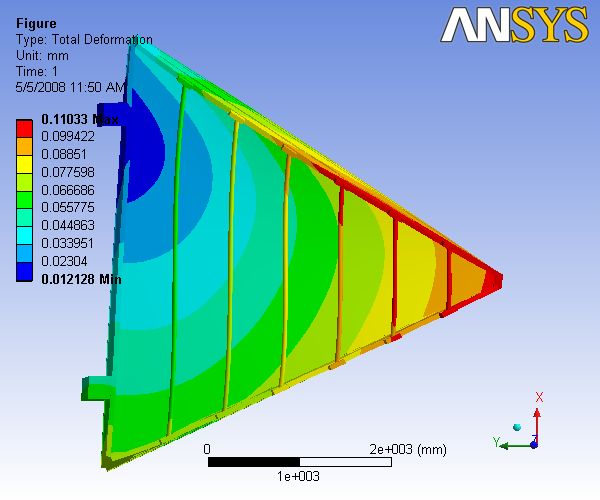
|
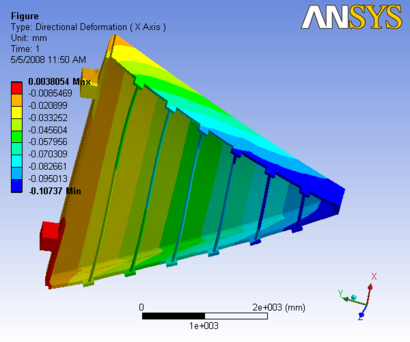 |
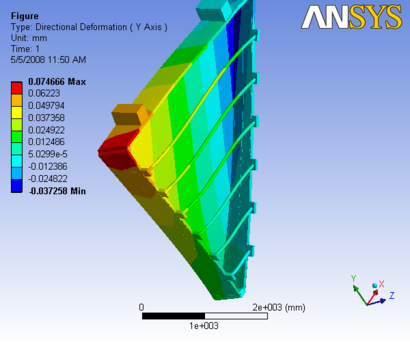 |
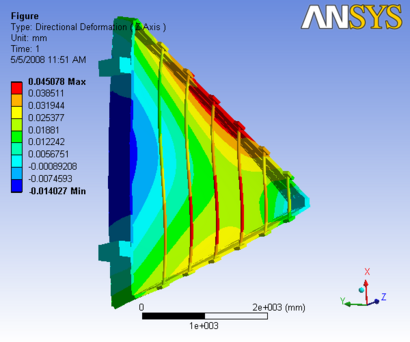
|
Figure 1.2: Images of Deflection for Analysis 1.1 in D,X,Y,Z Directions respectively
Sector 4
Analysis 4.1
The report generated by ANSYS is available: File:Analysis sector 4.1.pdf
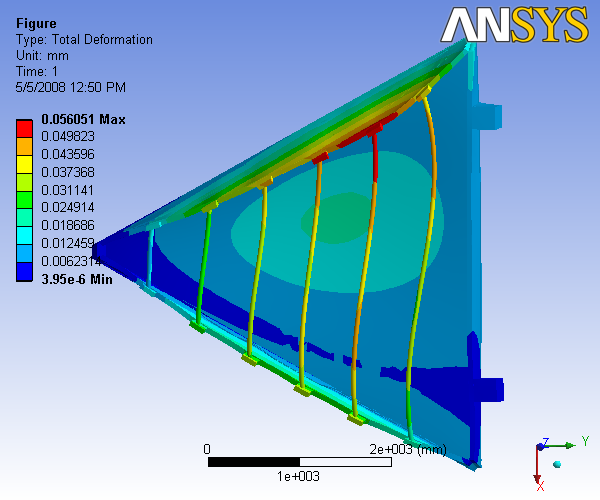
|
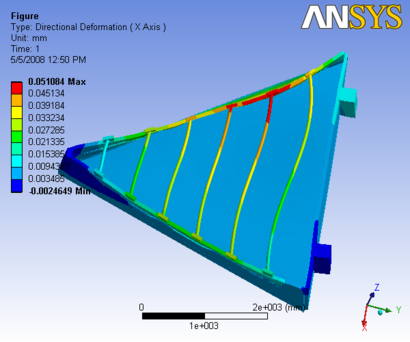 |
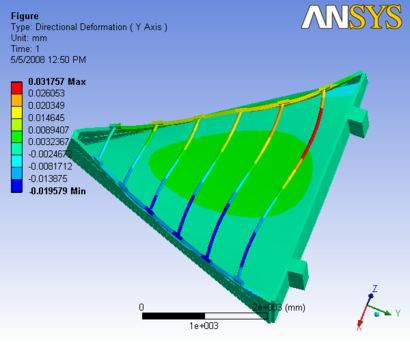 |
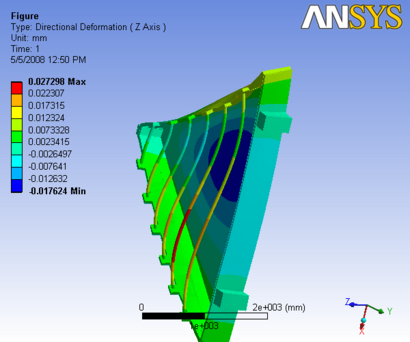
|
Figure 4.1: Images of Deflection for Analysis 4.1 in D,X,Y,Z Directions respectively
Analysis 4.2
The report generated by ANSYS is available: File:Analysis sector 4.2.pdf
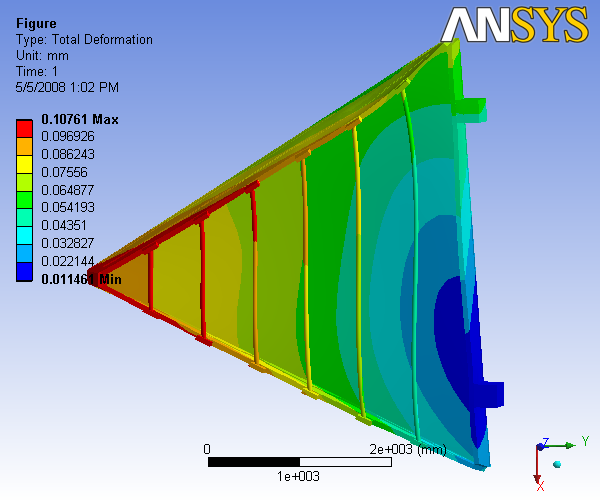
|
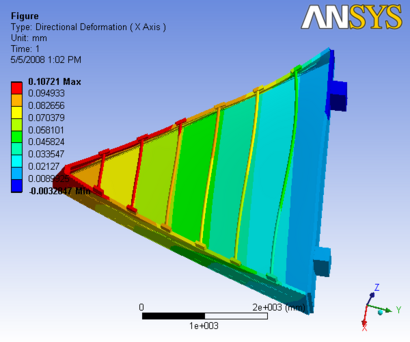 |
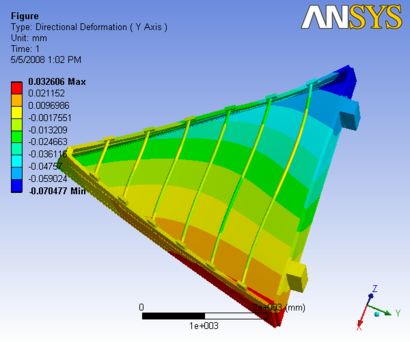 |

|
Figure 4.2: Images of Deflection for Analysis 4.2 in D,X,Y,Z Directions respectively
Refined Results
Analysis Refined 1.1
The report generated by ANSYS is available: File:Analysis refined sector 1.1.pdf
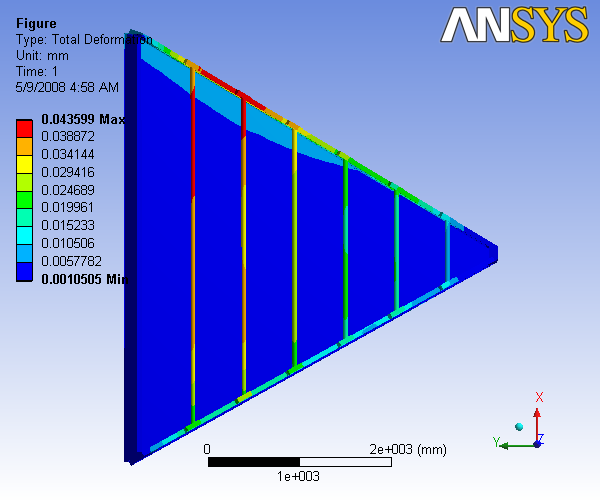
|
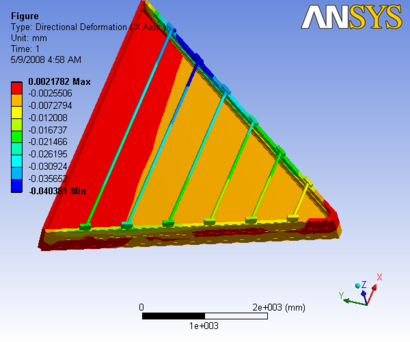 |
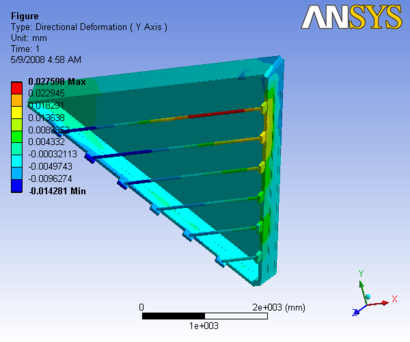 |
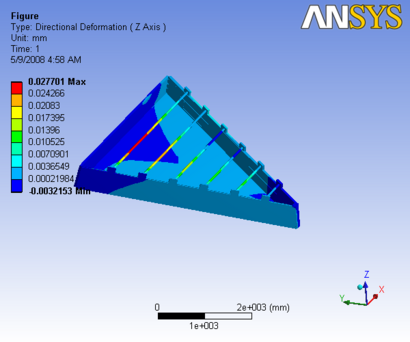
|
Figure 4.1: Images of Deflection for Refined Analysis 1.1 in D,X,Y,Z Directions respectively
Analysis Refined 4.1
The report generated by ANSYS is available: File:Analysis refined sector 4.1.pdf
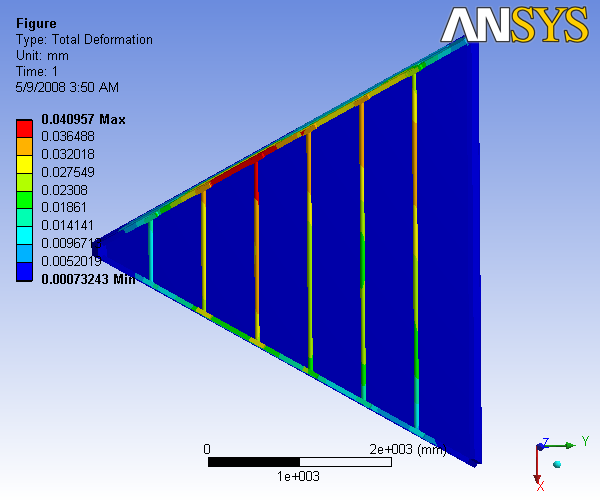
|
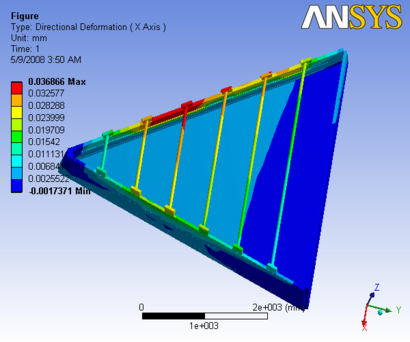 |
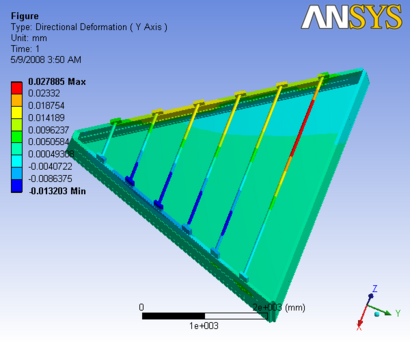 |
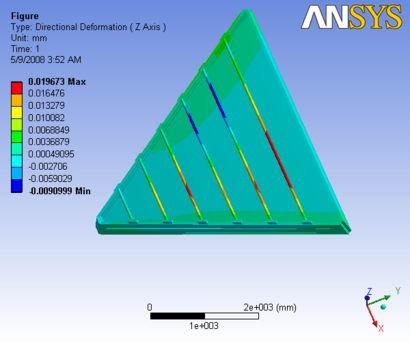
|
Figure 4.1: Images of Deflection for Refined Analysis 4.1 in D,X,Y,Z Directions respectively
Summary
Appendices
Endplate Deflection with Carbon Rods
Preliminary FEA efforts were performed to determine the impact of including carbon fiber rods on the endplate deflection. This model was only for a single endplate and not the full 3-D Analysis. Figure A1a shows the reference case of a composite endplate deflection undergoing loading from the wires without carbon fiber rods. Figure A1b shows the deflection of the endplate with the six fiber rods included as rigid boundary constraints. Since the rods are only mounted on the upstream side of the endplate, the maximum deflection is then observed on the downstream side.
 |
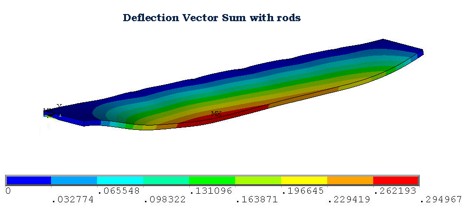
|
| Configuration | X max | Y max | Z max | D max |
| (mm) | (mm) | (mm) | (mm) | |
| No rods | .67 | 32.4 | .04 | 32.4 |
| With rods | .01 | 0.29 | 0.16 | .29 |
Figure A1: (a, left) FEA predicted deflections for the composite endplate for a reference condition of wire loading witihout carbon fiber rods. (b, right) FEA predicted deflections when carbon fiber rods are included.
Only the dark and light blue regions near the carbon fiber rods appear to have deflections below the specification. The maximum deflection appears to be on the back (downstream) edge of the end plate. The use of a composite material, with an effective Young's Modulus that is a factor of 20 smaller than stainless steel, resulted in deflections which were only a factor of 16 larger while decreasing the mass of the end plate by a factor of at least 16. Carbon fiber rods along the front of the drift chamber will decrease the maximum deflection to about 300 which is a factor of 6 too large.
Remaining sets of analysis from Section 5.3
Analysis 1
Analysis 1.1
Analysis 1.1 Includes just the gravity loading with no wire loads, no carbon fiber rods and with no Hexcel backing sheet.
The report generated by ANSYS is available: File:Analysis slice 1.1.pdf
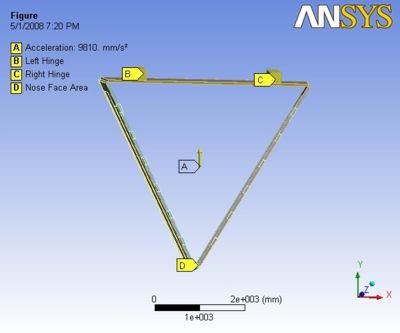 |
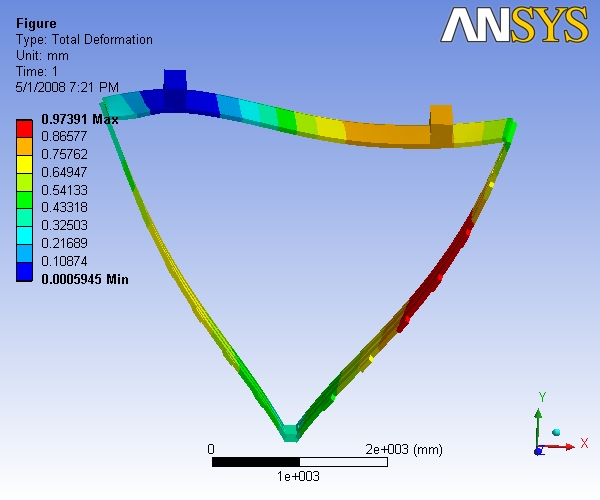
|
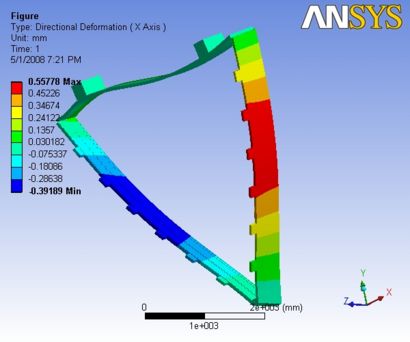 |
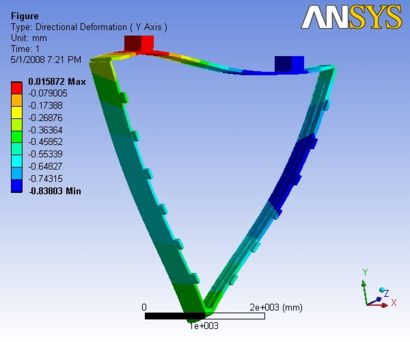 |
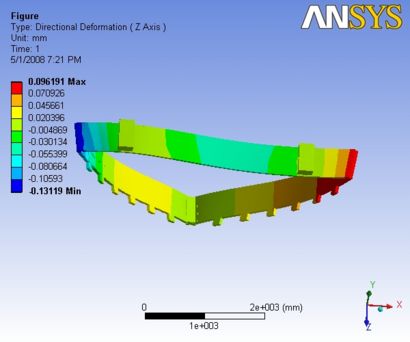
|
Figure A1.1: Images of Deflection for Analysis 1.1 in D,X,Y,Z Directions respectively
Analysis 1.2
Analysis 1.2 Includes Just the Wire loads with no gravity, no carbon fiber rods and with no Hexcel backing sheet.
The report generated by ANSYS is available: File:Analysis slice 1.2.pdf
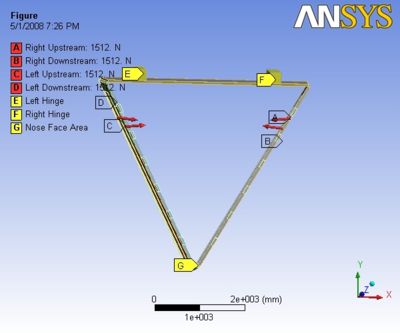 |
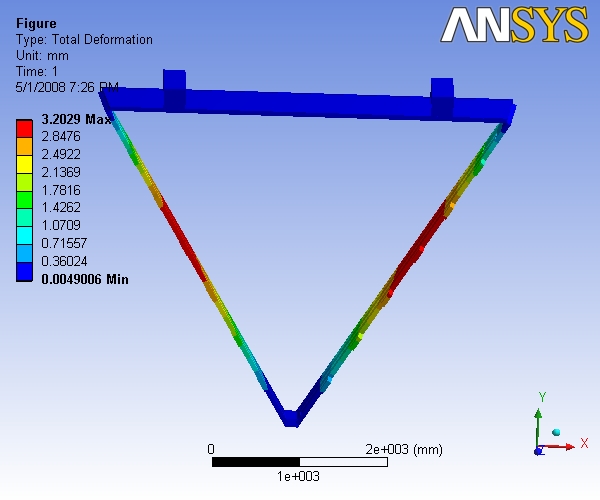
|
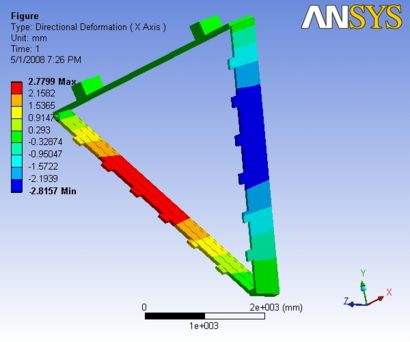 |
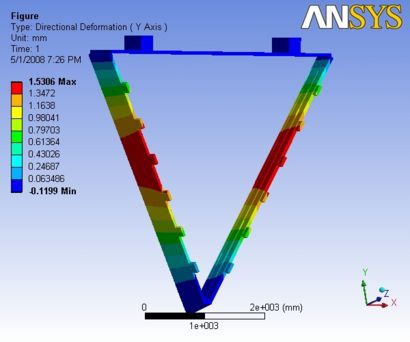 |
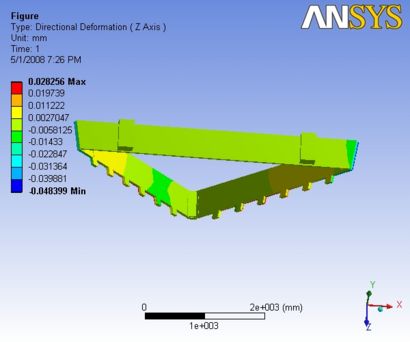
|
Figure A1.2: Images of Deflection for Analysis 1.2 in D,X,Y,Z Directions respectively
Analysis 1.3
Analysis 1.3 Includes both gravity and wire loading with no carbon fiber rods and with no Hexcel backing sheet.
The report generated by ANSYS is available: File:Analysis slice 1.3.pdf
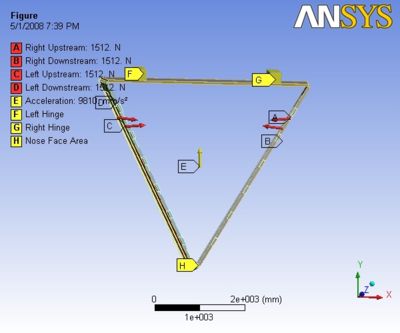 |
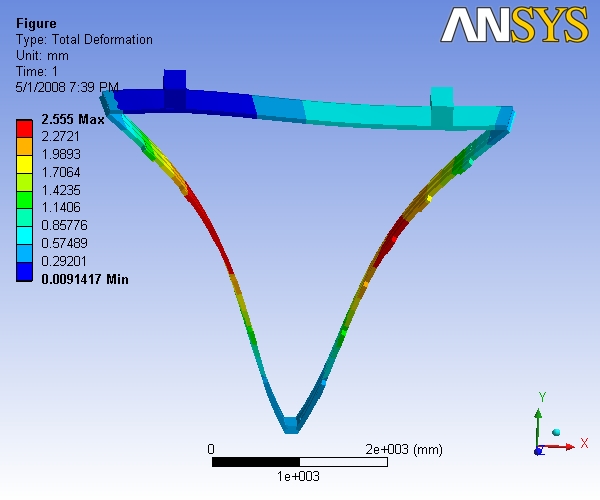
|
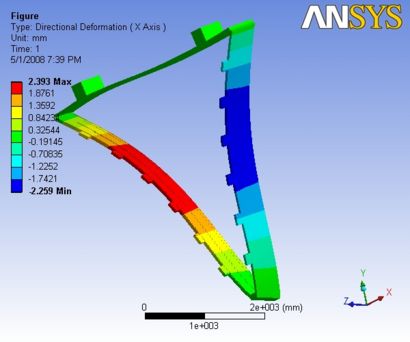 |
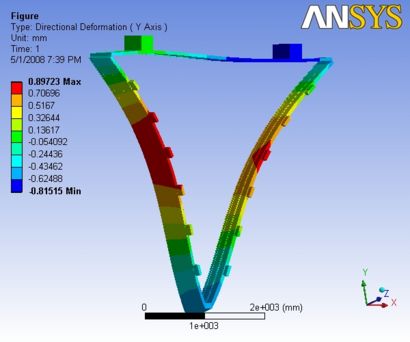 |
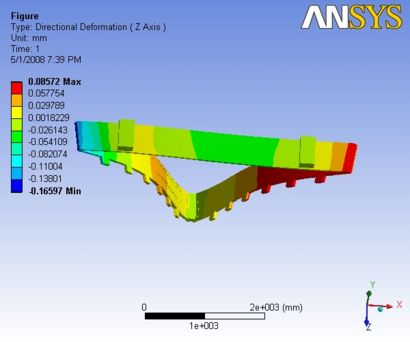
|
Figure A1.3: Images of Deflection for Analysis 1.3 in D,X,Y,Z Directions respectively
Analysis 2
Analysis 2.1
Analysis 2.1 Includes the gravity loading for the basic sector with Carbon Fiber rods attached on the upstream side of the sector with no wire loads and with no Hexcel backing sheet.
The report generated by ANSYS is available: File:Analysis slice 2.1.pdf
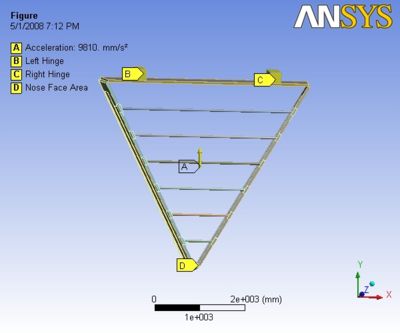 |
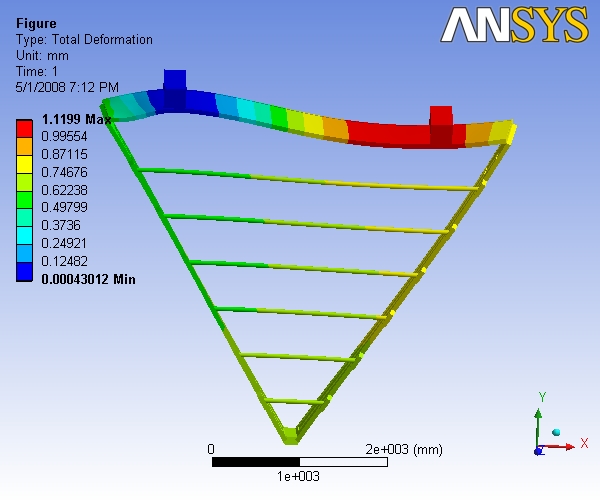
|
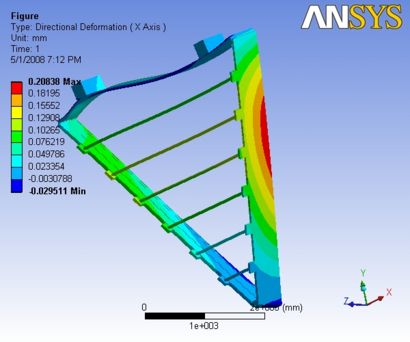 |
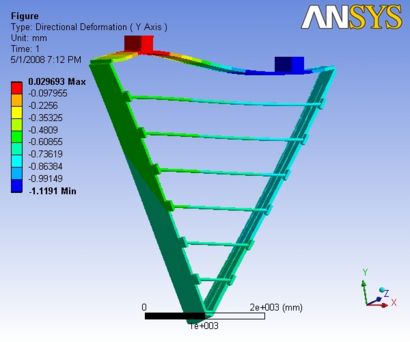 |
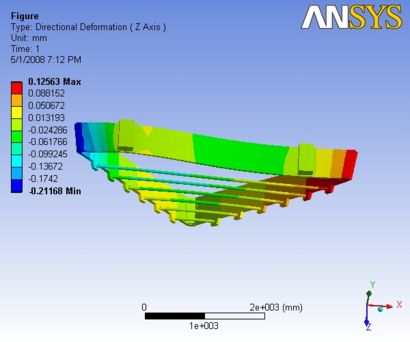
|
Figure A2.1: Images of Deflection for Analysis 2.1 in D,X,Y,Z Directions respectively
Analysis 2.2
Analysis 2.2 Includes Just the Wire loads to the sector with carbon fiber rods on the upstream side of the sector with no gravity and with no Hexcel backing sheet.
The report generated by ANSYS is available: File:Analysis slice 2.2.pdf
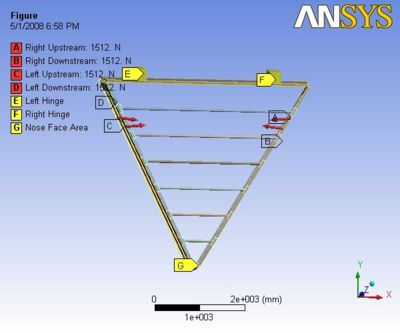 |
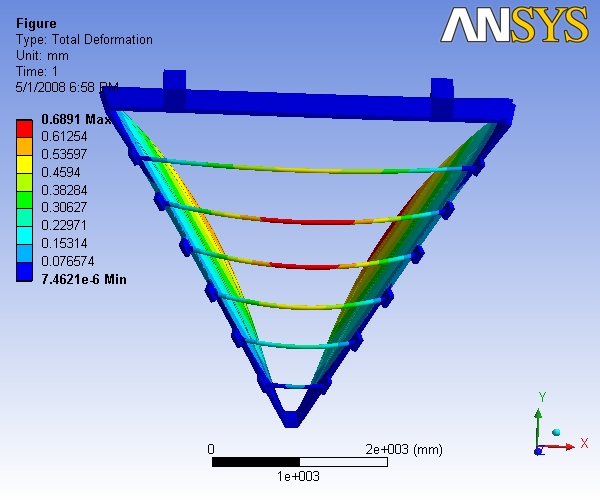
|
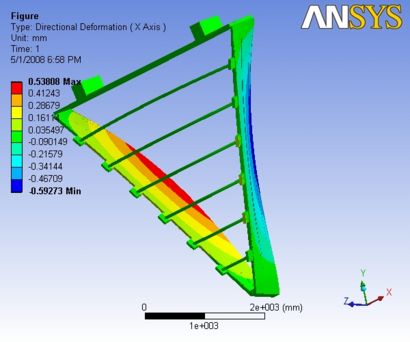 |
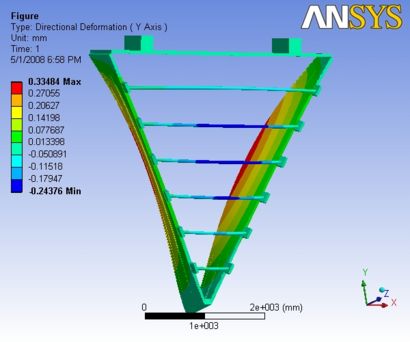 |
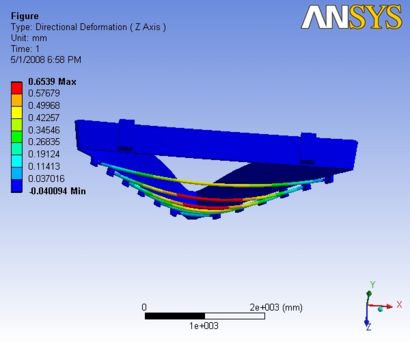
|
Figure A2.2: Images of Deflection for Analysis 2.2 in D,X,Y,Z Directions respectively
Analysis 2.3
Analysis 2.3 Includes both gravity and wire loading with carbon fiber rods and with no Hexcel backing sheet.
The report generated by ANSYS is available: File:Analysis slice 2.3.pdf
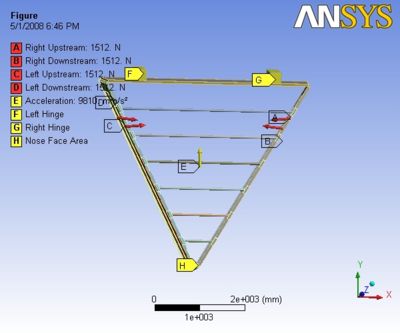 |
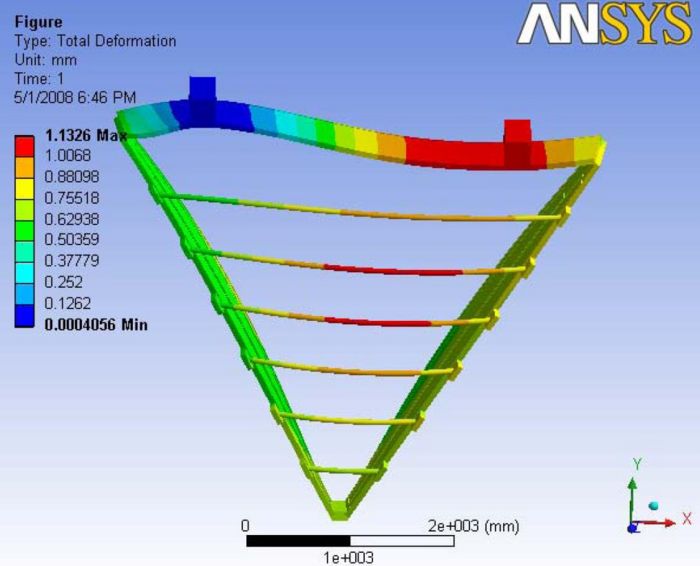
|
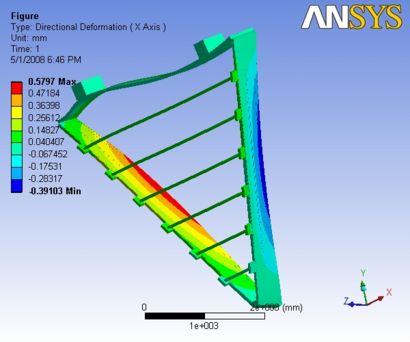 |
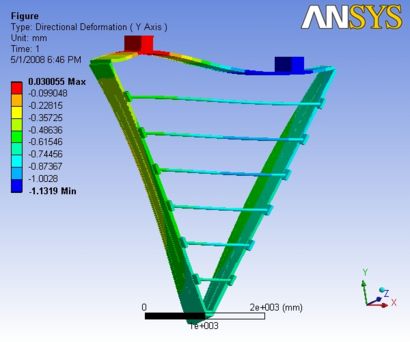 |
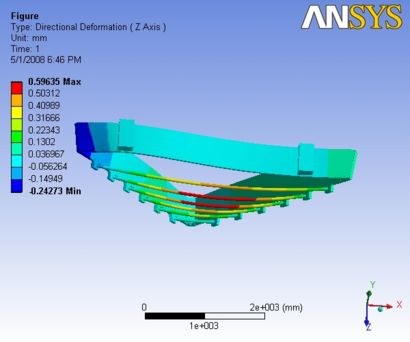
|
Figure A2.3: Images of Deflection for Analysis 2.3 in D,X,Y,Z Directions respectively
Analysis 3
Analysis 3.1
Analysis 3.1 Includes just the gravity loading with no wire loads, no carbon fiber rods and with Hexcel backing sheet on the downstream side of the flow.
The report generated by ANSYS is available: File:Analysis slice 3.1.pdf
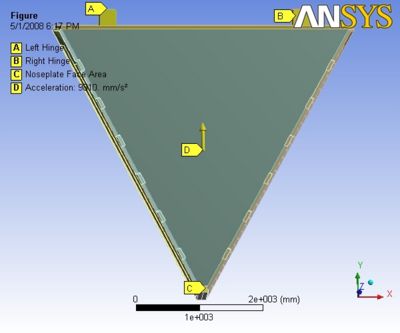 |
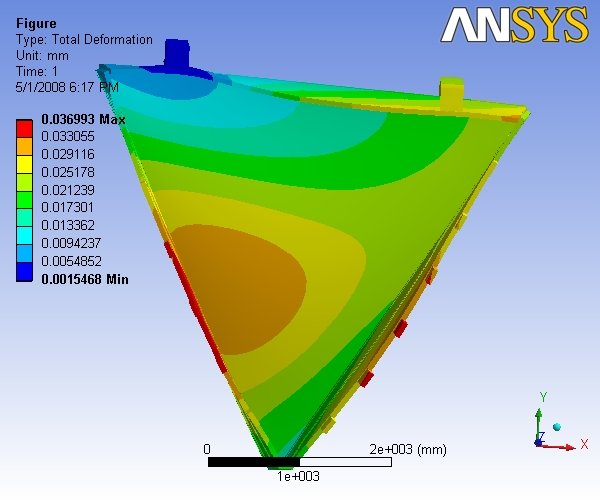
|
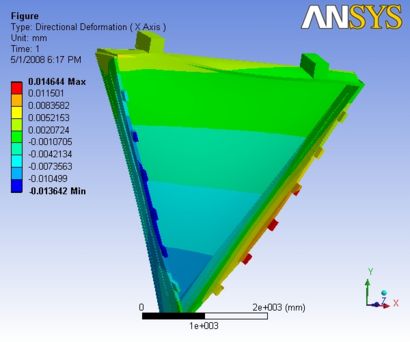 |
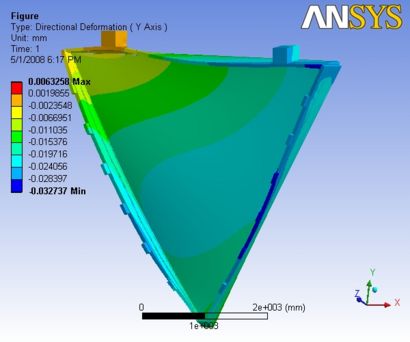 |
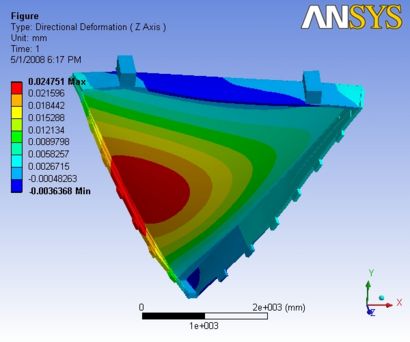
|
Figure A3.1: Images of Deflection for Analysis 3.1 in D,X,Y,Z Directions respectively
Analysis 3.2
Analysis 3.2 Includes Just the Wire loads, with Hexcel backing sheet on the downstream side of the flow with no gravity and no carbon fiber rods.
The report generated by ANSYS is available: File:Analysis slice 3.2.pdf
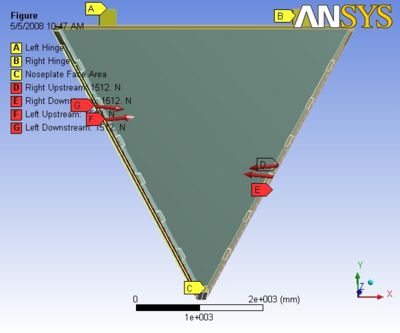 |
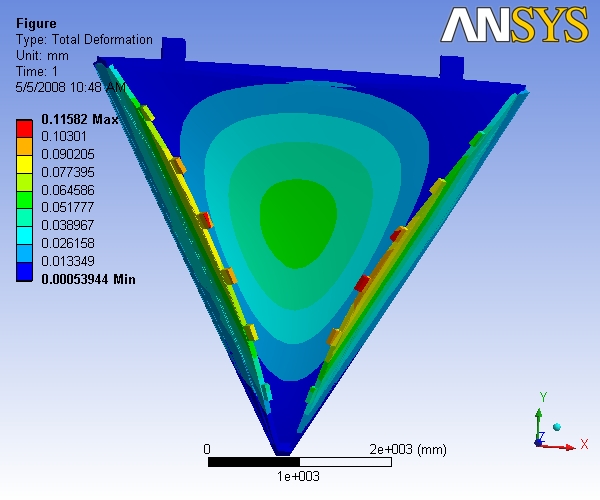
|
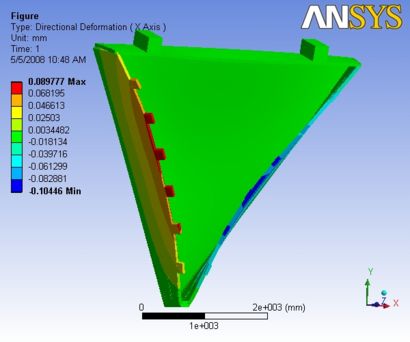 |
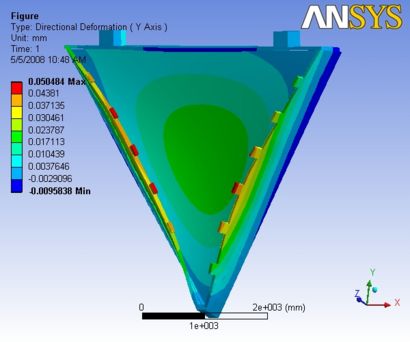 |
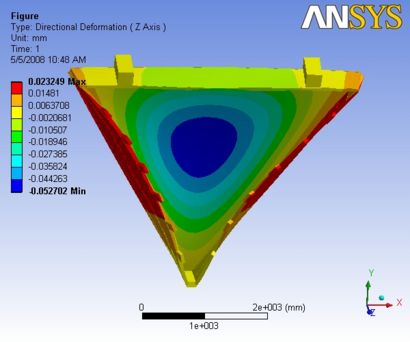
|
Figure A3.2: Images of Deflection for Analysis 3.2 in D,X,Y,Z Directions respectively
Analysis 3.3
Analysis 3.3 Includes both gravity and wire loading with Hexcel backing sheet and with no carbon fiber rods.
The report generated by ANSYS is available: File:Analysis slice 3.3.pdf
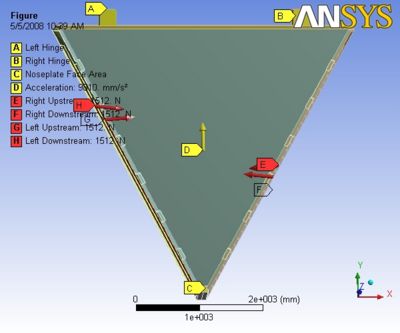 |
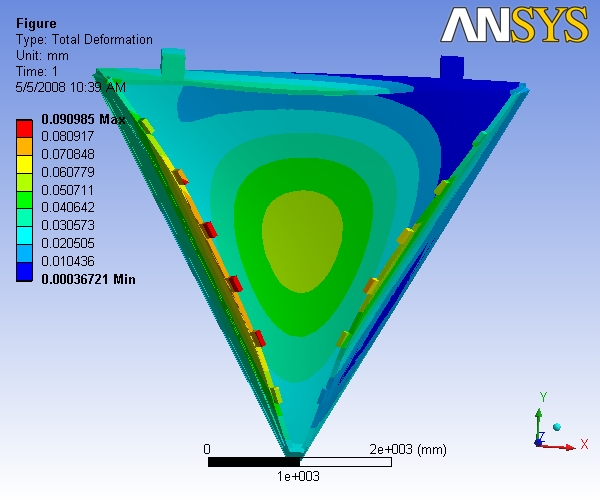
|
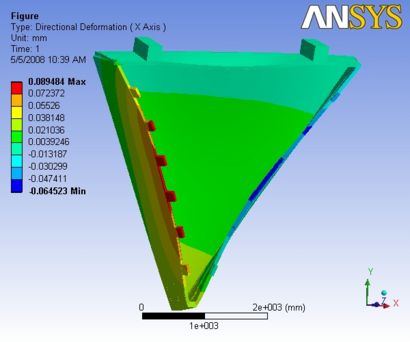 |
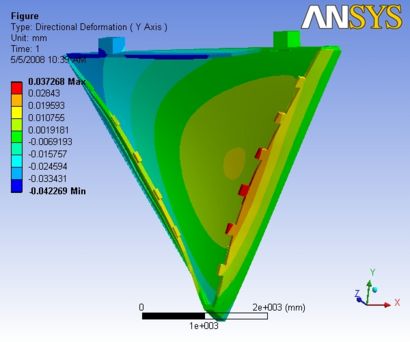 |
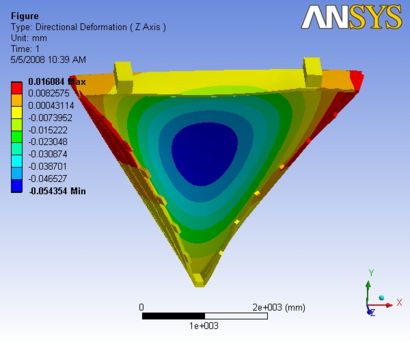
|
Figure A3.3: Images of Deflection for Analysis 3.3 in D,X,Y,Z Directions respectively
Analysis 4
Analysis 4.1
Analysis 4.1 Includes just the gravity loading to the whole sector under the influence of carbon fiber rods and hexcel backing sheet with no wire tensions.
The report generated by ANSYS is available: File:Analysis slice 4.1.pdf
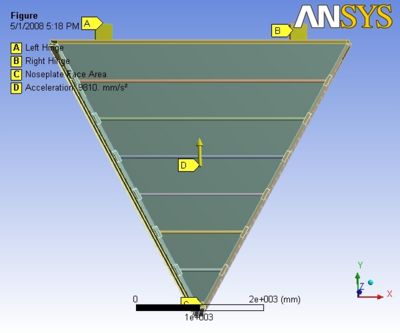 |
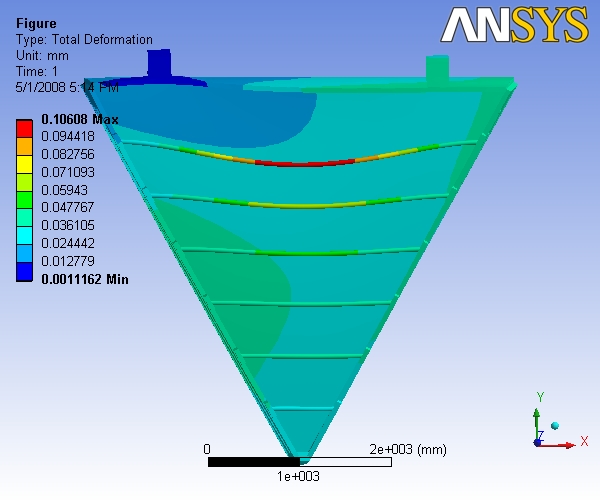
|
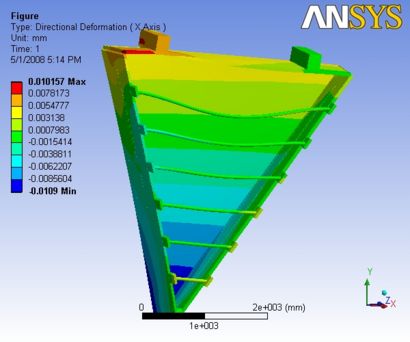 |
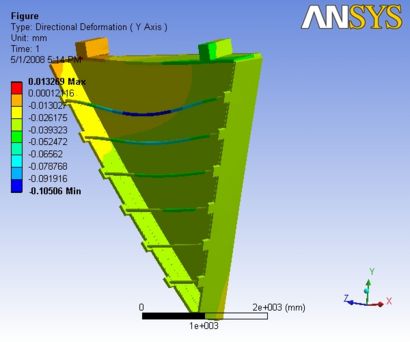 |
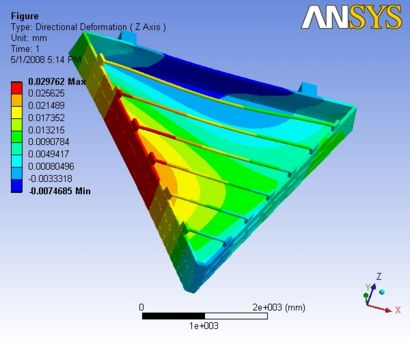
|
Figure A4.1: Images of Deflection for Analysis 4.1 in D,X,Y,Z Directions respectively
Analysis 4.2
Analysis 4.2 Includes Just the Wire loads on the end plates with carbon carbon fiber rods and Hexcel backing sheet as supports on the upstream side and the downstream side of the flow with no gravity.
The report generated by ANSYS is available: File:Analysis slice 4.2.pdf
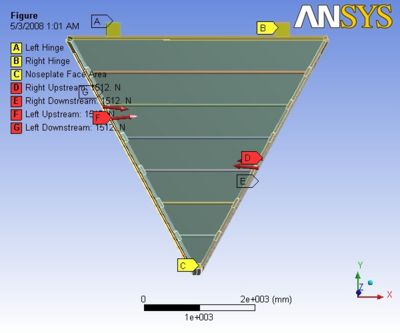 |
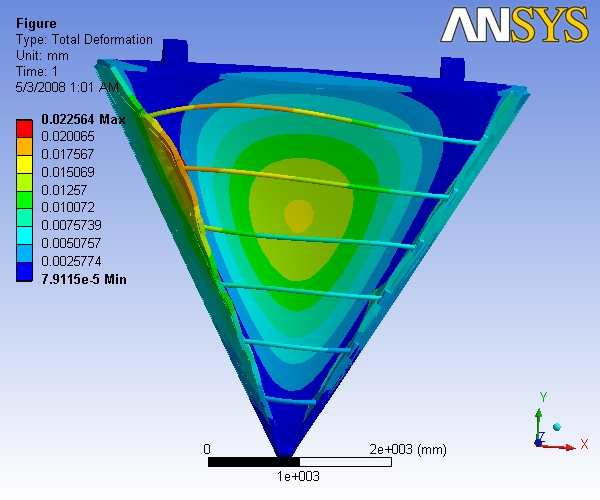
|
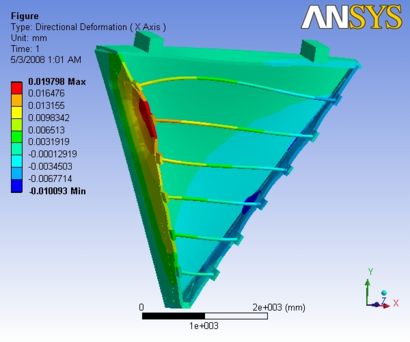 |
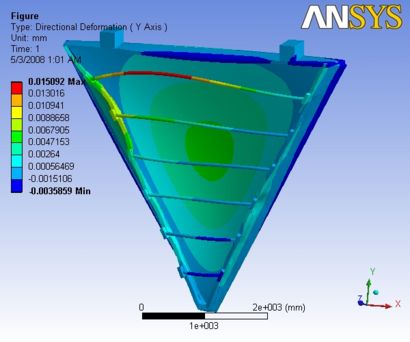 |
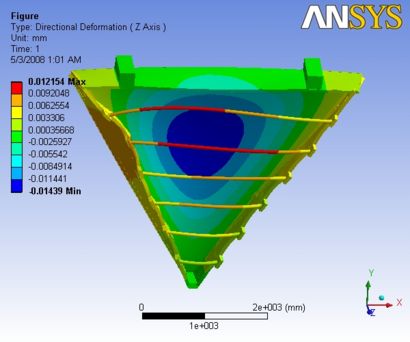
|
Figure A4.2: Images of Deflection for Analysis 4.2 in D,X,Y,Z Directions respectively
Old 3-D Analysis
The term "3-D Analysis" refers to an analysis based on a model that includes both endplates, a nose plate, a bottom plate, several carbon fiber rods, and a Hexcel backing plate. The deflection calculation was performed using several permutations involving the wire tension, the presence of gravity, the use of carbon fiber rods, the Hexcel backing plate as well as the impact of a ball joint in the drift chamber nose plate. The analysis begins with the simplest case in which only the impact of gravitational forces on the endplate deflection is evaluated for an ionization chamber structure modeled without carbon rods, a Hexcel backing plate, nor a ball joint. The analysis then considers the case in which wires are strung between the endplates and the impact of adding carbon fiber rods, the Hexcell sheet, and the ball joint on the endplate deflection. Figure 5.1 shows the 3-D model with labels indicating the location of the loadings included in the FEA program. The impact of the differential gas pressure between the chamber and atmosphere is not reported in this document. Table 5.2.1 quantifies the predicted endplate deflection for several design configurations illustrated here and in the Appendix. Below is a list describing in detail the applied loading and boundary conditions.
- The Hinge 1 labeled A is fixed in all degrees of freedom.
- The Hinge 2 labeled B is fixed in 2 degrees of freedom (DOF) and 1 DOF is allowed to move horizontal.
- The wire tensions labeled C, D, E, and F are for all four wire super layers (two per endplate).
- Ball joint labeled G below the Nose plate.
- Acceleration labeled H is showing upwards, showing the gravity is opposite to it. This gravity vector is applied at an imaginary direction, as shown in Figure 14. The real orientations are different to what is shown here. To obtain the real orientations, the chamber has to be rotated clockwise at 30, 90, 150, 210, 270, 330 degrees, respectively, along z-axis (being the axis of rotation) to consider all the six orientations.
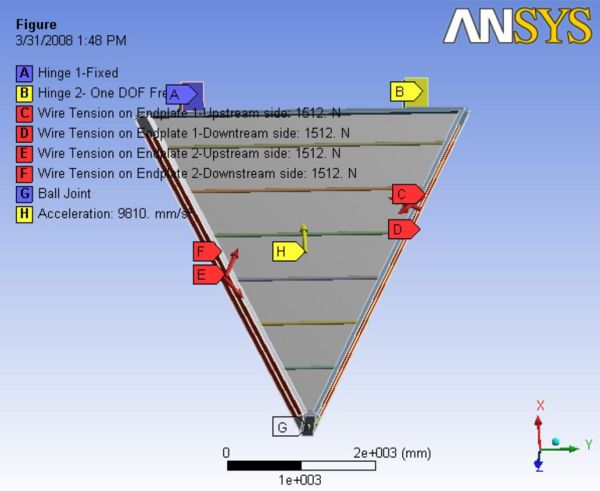
|
| Figure 5.1: Loads and boundary conditions for the FEA 3-D model. This image was taken from the ANSYS FEA program. |
Description of Analysis Sets
Each analysis set included a specific component added to the model to slowly increase its complexity. These analysis sets are:
- Gravity only loading.
- Wire loads and the effect of the ball joint, located on the nose plate.
- Wire loading with carbon fiber rods included.
- Wire loading with the Hexcel backing sheet included.
- Wire loading with both the carbon fiber rods and Hexcel backing sheet included.
- Gravity only loading with both the carbon fiber rods and Hexcel backing sheet included.
Critical points to remember about the analysis sets includes:
- Analysis set 1 and 6 are just self-weight analysis with no external loading.
- The nose Plate, endplates, back plate, and hinges are made of the sandwiched polyurethane foam/stainless steel composite material.
- The downstream-side sheet (backign) is made of Hexcel honeycomb material (sandwiched between two carbon fiber sheets).
- The Young's Modulus of both the endplates and the Hexcel backing are obtained by the effective Young's Modulus calculation method.
- The compressive modulus of the Hexcel backing is observed to be different along the length and width. As are result, the Young's Modulus is calculated in both directions and the least of them is considered for calculations (more conservative approach).
Table of Results
Table 5.2.1 gives a summary of the analysis sets along with the resulting deflections. Column "D Max" is the maximum total deflection (vector) observed in the model; in some sets, this is observed in the carbon fiber rods and not necessarily in the endplates. Since the maximum total deflection is the result of importance, Column "E max" gives this value for the endplates.
Table 5.2.1: Summary of 3-D Analysis Results from ANSYS.
| Deflection | Wire Tension | Rods | Hexcel | Mylar | Gravity | Ball Joint | Gas Pressure | D max(mm) | X max(mm) | Y max(mm) | Z max(mm) | E max(mm) |
| Analysis 1.1 | No | No | No | No | Yes | No | No | 1.5315 | 0.0034 | 0.1791 | 0.0731 | 1.2 |
| Analysis 1.2 | No | No | No | No | Yes | yes | No | 0.219 | 2.11e-5 | 0.1795 | 0.0318 | 0.219 |
| Analysis 2.1 | Yes | No | No | No | No | No | No | 19.935 | 17.495 | 9.5869 | 0.4435 | 19.935 |
| Analysis 2.2 | Yes | No | No | No | No | Yes | No | 19.952 | 17.391 | 9.8084 | 0.4442 | 19.95 |
| Analysis 2.3 | Yes | No | No | No | Yes | Yes | No | 18.593 | 16.27 | 9.014 | 0.4813 | 18.593 |
| Analysis 3.1 | Yes | Yes | No | No | No | No | No | 1.5104 | 1.033 | 0.2855 | 0.0675 | 1.17 |
| Analysis 3.2 | Yes | Yes | No | No | No | Yes | No | 1.158 | 1.0266 | 0.5869 | 0.0534 | 1.15 |
| Analysis 3.3 | Yes | Yes | No | No | Yes | Yes | No | 1.038 | 0.9392 | 0.3618 | 0.1018 | 1.03 |
| Analysis 4.1 | Yes | No | Yes | No | No | No | No | 0.2904 | 0.146 | 0.2479 | 0.0044 | 0.29 |
| Analysis 4.2 | Yes | No | Yes | No | No | Yes | No | 0.2891 | 0.1538 | 0.251 | 0.0166 | 0.289 |
| Analysis 4.3 | Yes | No | Yes | No | Yes | Yes | No | 0.301 | 0.156 | 0.264 | 0.0153 | 0.3 |
| Analysis 5.1 | Yes | Yes | Yes | No | No | No | No | 0.1231 | 0.0216 | 0.0099 | 0.0031 | 0.09 |
| Analysis 5.2 | Yes | Yes | Yes | No | No | Yes | No | 0.0209 | 0.0157 | 0.0116 | 0.0027 | 0.016 |
| Analysis 5.3 | Yes | Yes | Yes | No | Yes | Yes | No | 0.0647 | 0.0078 | 0.0105 | 0.0122 | 0.021 |
| Analysis 6.1 | No | Yes | Yes | No | Yes | No | No | 0.5851 | 0.051 | 0.0052 | 0.0082 | 0.52 |
| Analysis 6.2 | No | Yes | Yes | No | Yes | Yes | No | 0.0738 | 0.0008 | 0.0017 | 0.0098 | 0.008 |
Key observations from these results include:
- The Analysis started with a basic frame made of the composite material (foam and stainless steel). Due to the major effects of gravity on the chamber, this composite material produced good results with respect to self-weight deflection due to its ery low density and considerably high Young's Modulus.
- Analysis set 1 is just the analysis with gravity effects with no external loading. The very first analysis (1.1) is with hinge constraints and no ball joint. The max deflection is about 1.53 mm. By adding a ball joint (1.2) reduced the deflection to 0.22 mm. With this gravity orientation, the chamber is resting its weight on the ball joint. This tells us that the ball joint is very supportive in reducing the max deflection in every case.
- Analysis set 2 adds wire tensions to the end plates with and without the ball joint, with and without gravity. The max deflections observed are approximately 19 mm.
- Analysis set 3 is a step further in trying to reduce the deflection by adding six carbon fiber rods to the upstream side of the chamber. The endplate deflection is reduced to about 1.2 mm.
- Analysis set 4 includes the effects of the hexcel backing sheet without carbon fiber rods. Under the same conditions, the deflection is reduced from 19 mm (without Hexcel) to 0.3 mm.
- Analysis set 5 is a combination of sets 3 and 4 (the inclusion of both carbon fiber rods and the Hexcel backing sheet). Without the ball joint, the maximum total deflection of the endplates was 0.09 mm, whereas by adding the ball joint, the deflection is further reduced to 0.016 mm.
- Analysis set 6 includes gravity effects only with both the carbon fiber rods and the Hexcel backing sheet.
The next step in the analysis process (currently underway) is to include the mylar front sheet and the effects of a possitive gas pressure on both the deformation of the mylar as well as the added loading to the endplates.
Analysis
Analysis 1
Analysis 1 is an effort to understand the effects of gravity in its orientation with 2 different kinds of constraints
Analysis 1.1
Analysis 1.1 describes the effects of gravity on the frame when hinge 1 and hinge 2 are active with no active ball joint at the nose plate. Wire tensions are not applied i.e no external loading. In this model hexcel sheet and carbon rods are not included. A Report of the analysis is available at File:Analysis 1.1.pdf
As the nose is free to move, the Maximum Total Deflection is observed at the nose and the deflection is gradually reduced towards the hinge side. Due to self weight, the deflection in X-direction is close to zero at those hinges and maximum in the negative side of x. The Y-deflection is more at the middle of the end plates in opposite directions. The Z-deflection is more at the nose plate as the chamber is observed to be tilted towards the Target center in the negative Z-side.
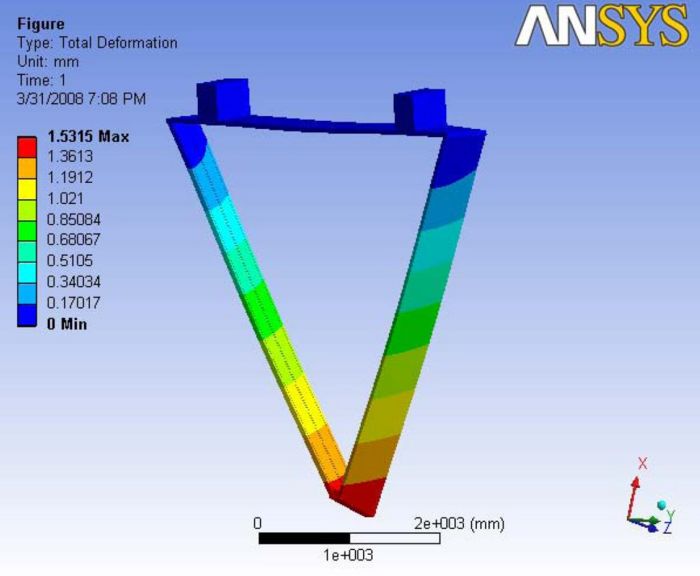
|
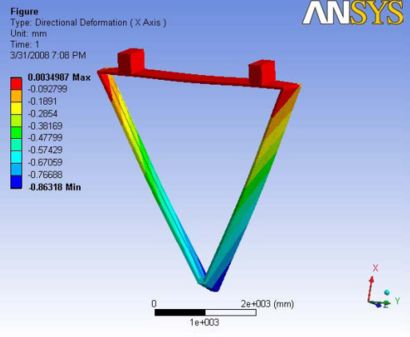 |
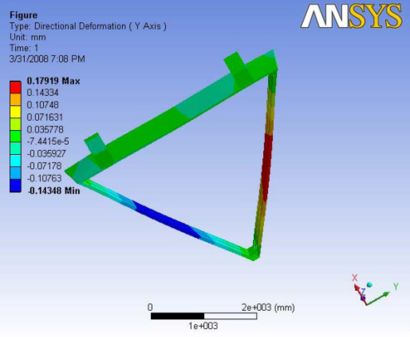 |
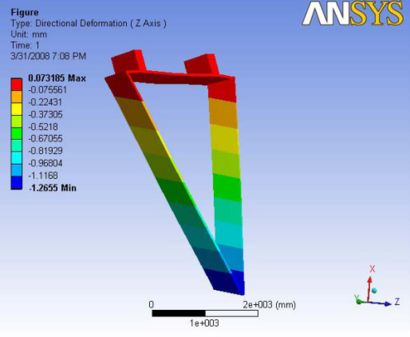
|
|- | Figure A.2: Images of Deflection for Analysis 1.1 in D,X,Y,Z Directions respectively
Analysis 1.2
Analysis 1.1 describes the effects of gravity on the frame when hinge 1, hinge 2 and ball joint are active. Wire tensions are not applied i.e no external loading. In this model also, hexcel sheet and carbon rods are not included. A Report of the analysis is available at File:Analysis 1.2.pdf
In this case The nose plate is supported with a ball joint under the nose plate. so, It is like the chamber is made to rest on the ball joint with supported hinges on the top. so, the total deformation at the nose plate and the hinges is observed to be minimum and the end plates gave an impression as they sag in the middle. Other than that, the base plate on the top also sagged below due to its own self weight. Due to gravity effects, the X-direction deflection is observed to be maximum almost at the center of the endplates. The Y-deflection gave an impression as it is symmetric in the way the end plates are bowed outward. Z-deformation is maximum in the direction away away from the target center at the middle of the back plate. The back plate on each piece will not be mounted parallel to the ground. so, the deflection is in the positive z direction.
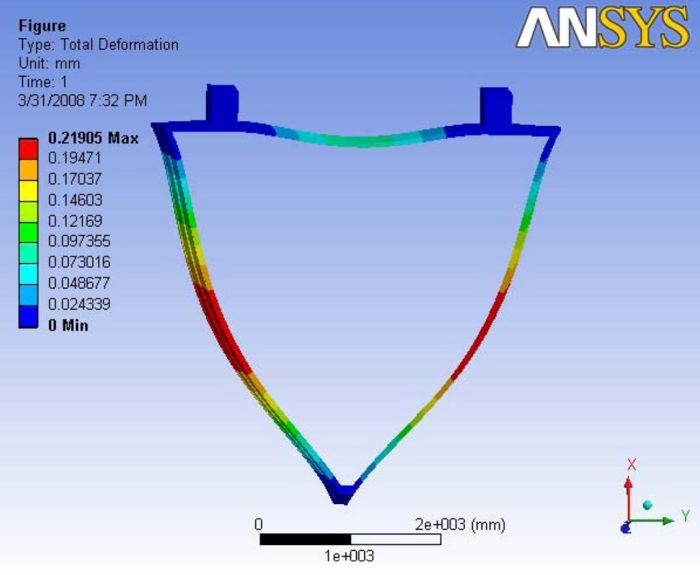
|
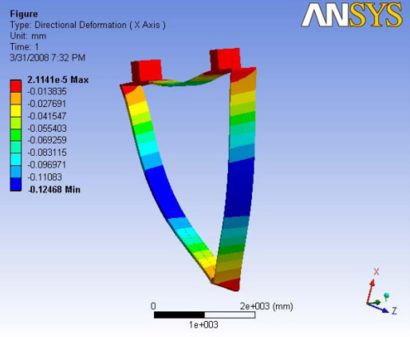 |
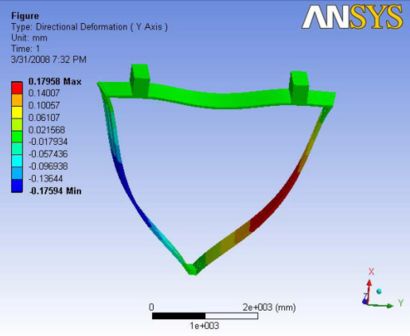 |
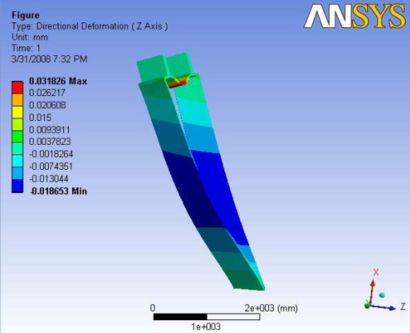
|
|- | Figure A.3: Images of Deflection for Analysis 1.2 in D,X,Y,Z Directions respectively
Analysis 2
This is the step of analysis where the wire tensions are applied to the basic frame where the carbon rods and hexcel sheet is not modeled for the analysis.
Analysis 2.1
A Report of the analysis is available at File:Analysis 2.1.pdf
In this analysis, the deformation is pretty much dominated by the wire tensions. Now the end plates are bowed inward and the base plate has minimum deflection. whatsoever, The nose plate side is slightly pulled towards the target side even without the gravity effects and it can be observed in the Z-deformation image. Overall, the deformation is too huge and is approximately about 20mm. the maximum deformation is observed at the end plates.
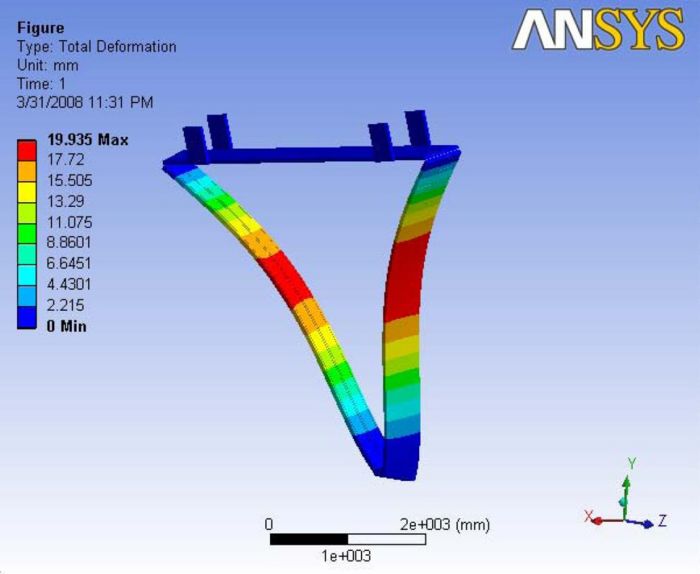
|
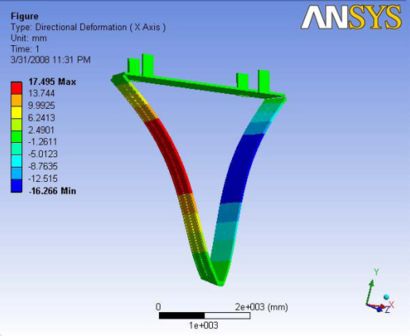 |
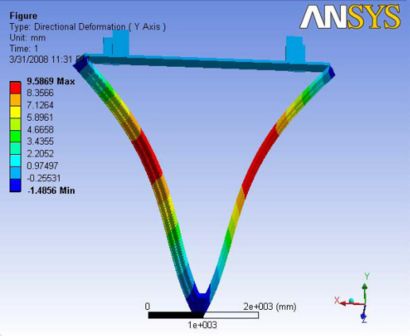 |
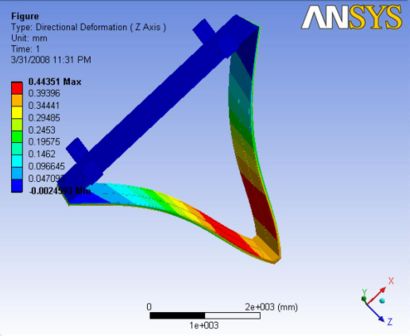
|
|- | Figure A.4: Images of Deflection for Analysis 2.1 in D,X,Y,Z Directions respectively
Analysis 2.2
A Report of the analysis is available at File:Analysis 2.2.pdf
The deformations observed with the ball joint is pretty close to the deformations observed without a ball joint. however, the deformations are slightly lesser than previous especially at the nose plate with the extra constraint of the ball joint. The maximum deflection is observed along the end plates.
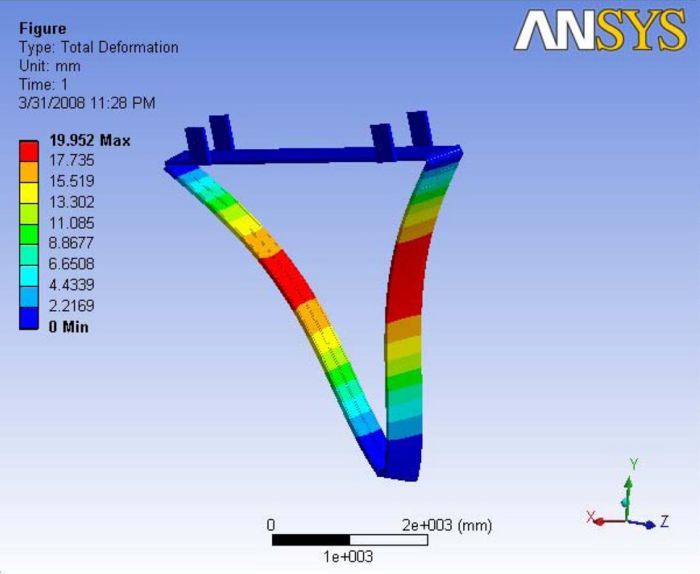
|
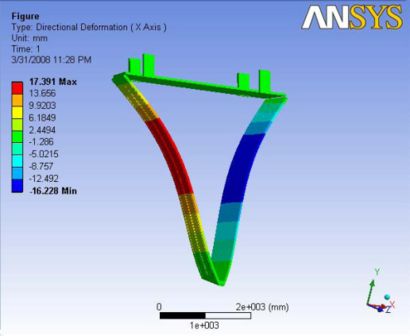 |
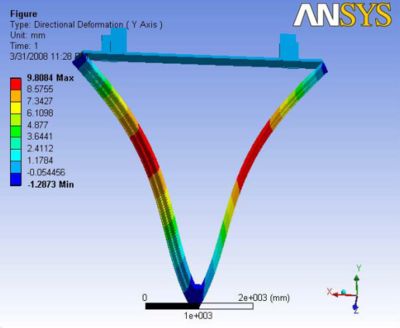 |
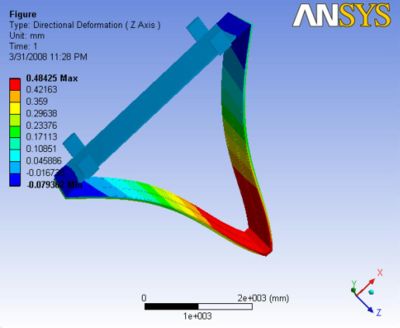
|
|- | Figure A.5: Images of Deflection for Analysis 2.2 in D,X,Y,Z Directions respectively
Analysis 2.3
A Report of the analysis is available at File:Analysis 2.3.pdf
In this case the addition of gravity reduced the magnitude of deflection. With out the wire tensions, under gravity the end plates are bowed outward about 2mm in analysis 0.2 and with the wire tensions under no gravity, they are deflected inwards for about 19.5mm in analysis 2.2. Now by putting both the cases together, the deformation is a compromise of both and it is observed as 18.6mm bowing inwards. The maximum deflection is observed along the end plates.
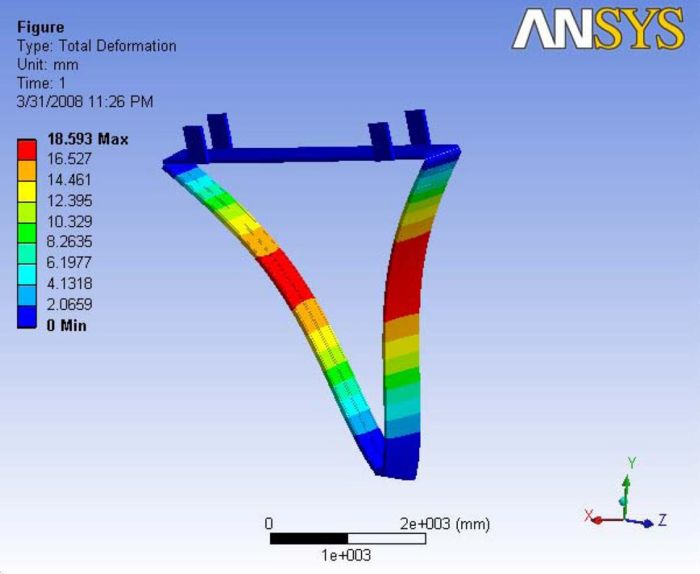
|
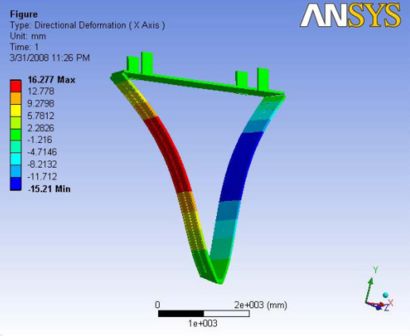 |
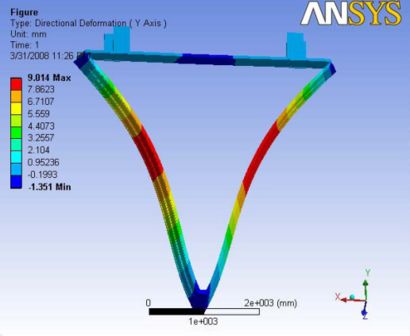 |
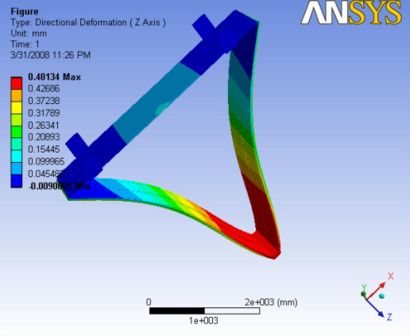
|
|- | Figure A.6: Images of Deflection for Analysis 2.3 in D,X,Y,Z Directions respectively
Analysis 3
Addition of carbon rods reduced the deflection to a very great extent, from 19-20mm to about 1.5-1.0mm. The maximum deflection is observed on the middle sections of the carbon rods. They are bowed outwards. the end plate towards the carbon rod side is almost zero and the non carbon rod side of the end plate has 0.8-1.15mm. With the ball joint and the influence of gravity, they are some slight deformations on the back plate towards the gravity. However the role of carbon rods made things quite clear by reducing the deflection the greatest extent.
Analysis 3.1
This analysis is carried with no ball joint and no gravity effects. Six carbon rods were modeled to the upstream side of the chamber. The maximum deformation is observed at one of the mid sections of the carbon rods. As this analysis is without the gravity effects and the nose plate is not constrained with the ball joint, we can see a major deflection at the nose plate. however, the end plates were deflected to about 1.2mm at the non carbon rod end. A Report of the analysis is available at File:Analysis 3.1.pdf
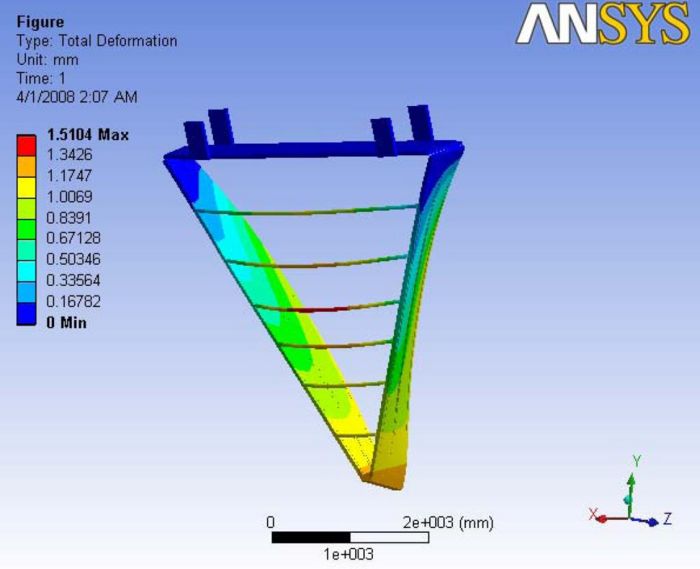
|
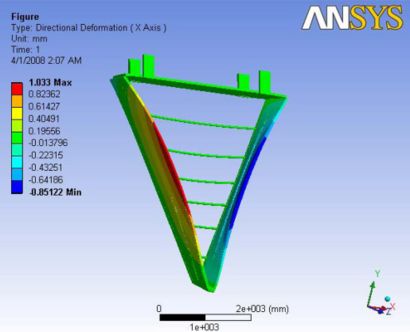 |
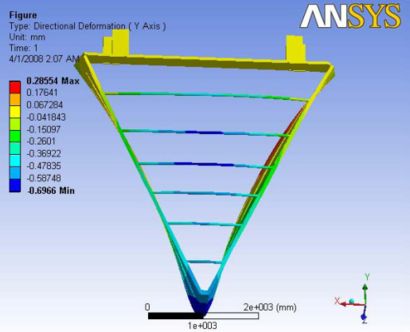 |
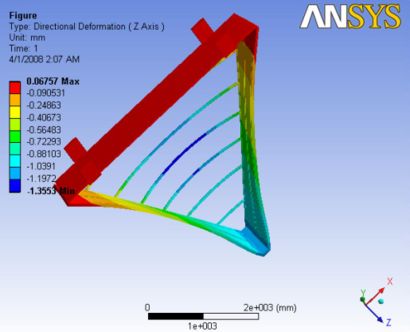
|
|- | Figure A.7: Images of Deflection for Analysis 3.1 in D,X,Y,Z Directions respectively
Analysis 3.2
Here, the ball joint reduced the ability of the chamber to move. The maximum deformation is observed at the nose carbon rod edge of the end plate. The maximum deformation is observed to be about 1.15mm. this deflection is more of a factor of the wire tensions. A Report of the analysis is available at File:Analysis 3.2.pdf
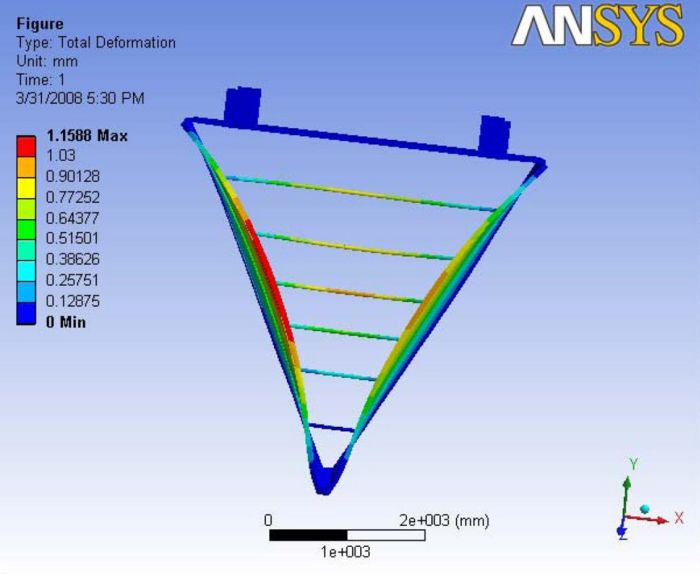
|
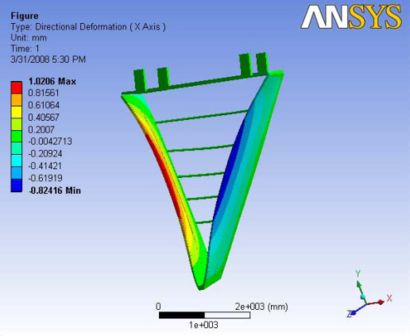 |
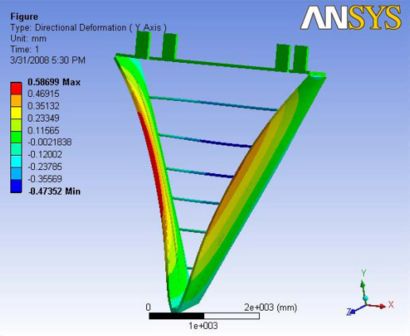 |
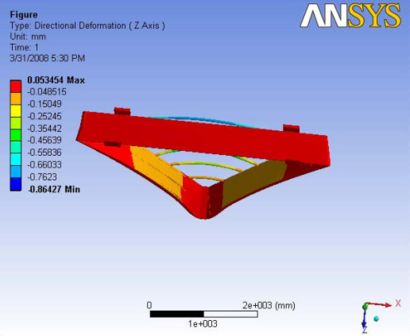
|
|- | Figure A.8: Images of Deflection for Analysis 3.2 in D,X,Y,Z Directions respectively
Analysis 3.3
This analysis with the gravity and ball joint, gives an expected shape of deformation. The maximum deformation is observed at the mid sections of the top carbon rods and the edges of the end plates. The nose plate has a little deflection of about 0.2mm. The deformation at the hinge section is almost zero. The gravity loads actually helped in reducing the deformation at this orientation. A Report of the analysis is available at File:Analysis 3.3.pdf
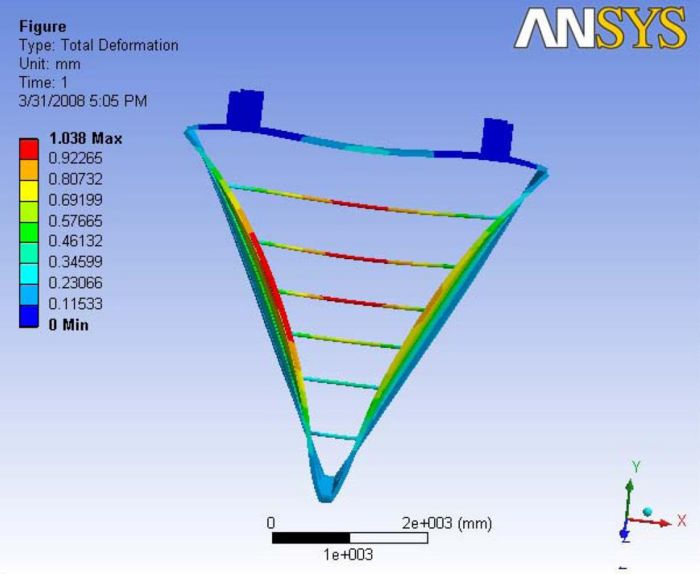
|
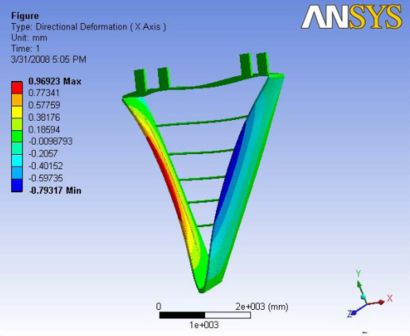 |
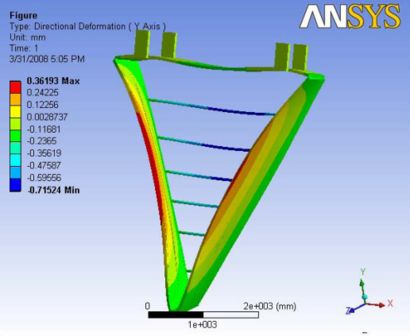 |
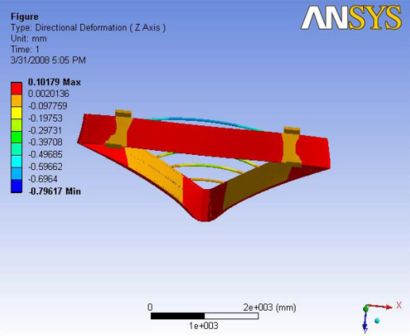
|
|- | Figure A.9: Images of Deflection for Analysis 3.3 in D,X,Y,Z Directions respectively
Analysis 4
Analysis set 4 is with the hexcel sheet and with no carbon rods. hexcel sheet is mounted on the downstream side of the flow. As expected hexcel sheet reduced the deflection even better than the carbon rods, From 19mm to 0.3mm. The max deflection is observed at the non hexcel sheet side on the end plates. Symmetric deflection is observed. However, the hexcel sheet is bowed inward i.e towards the wire inside the chamber by about. 0.025mm. This can be observed in the Z-deformation images. presence of the ball joint didnt make a lot of difference.
Analysis 4.1
This analysis revealed the importance of hexcel sheet and it reduced the deformation even better than carbon rods. The drawing shows the symmetric deformation with the maximum value at the non hexcel edge of the end plate. The deformation observed on the hexcel sheet is very minimal and that very minimal value is towards the wire in the chamber. A Report of the analysis is available at File:Analysis 4.1.pdf
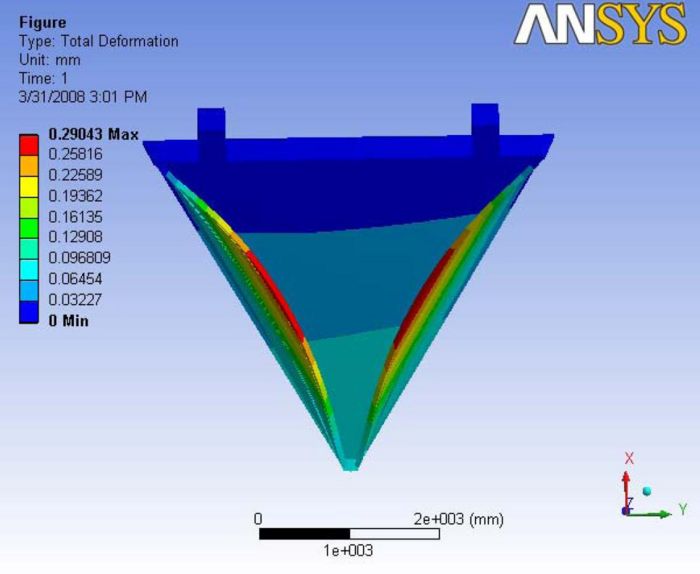
|
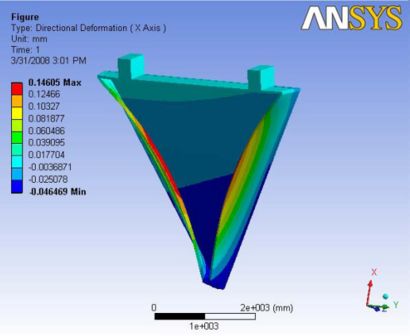 |
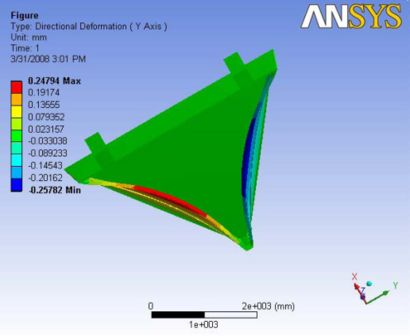 |
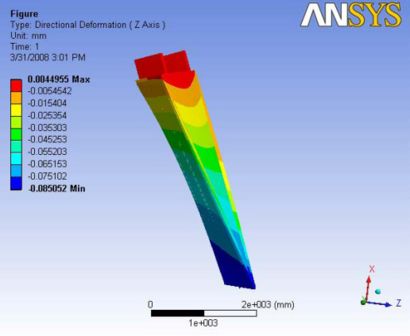
|
|- | Figure A.10: Images of Deflection for Analysis 4.1 in D,X,Y,Z Directions respectively
Analysis 4.2
The presence of ball joint didnt effect the location of maximum deformation at all. It is still observed at the edges of the end plate. The value is about 0.28mm A Report of the analysis is available at File:Analysis 4.2.pdf
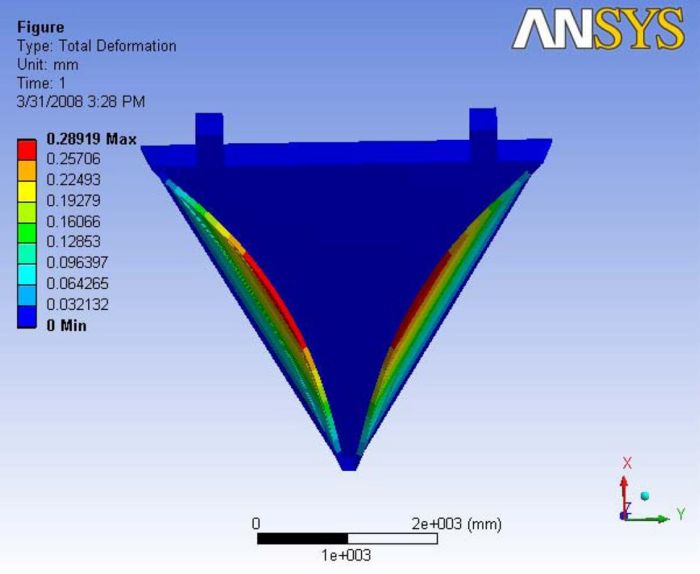
|
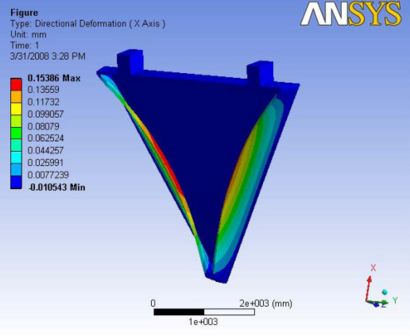 |
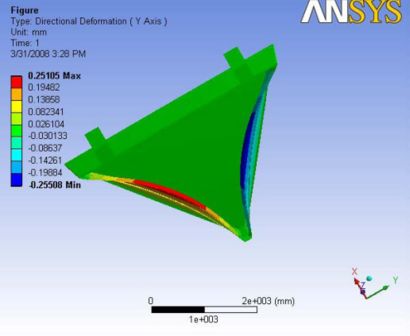 |
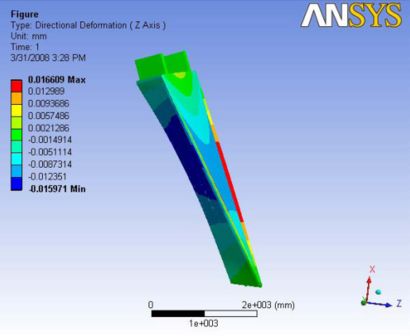
|
|- | Figure A.11: Images of Deflection for Analysis 4.2 in D,X,Y,Z Directions respectively
Analysis 4.3
The gravity effect at this orientation increased the max deformation along the end plates by about 0.02mm. The maximum deformation is still at the edges of the end plate. A Report of the analysis is available at File:Analysis 4.3.pdf
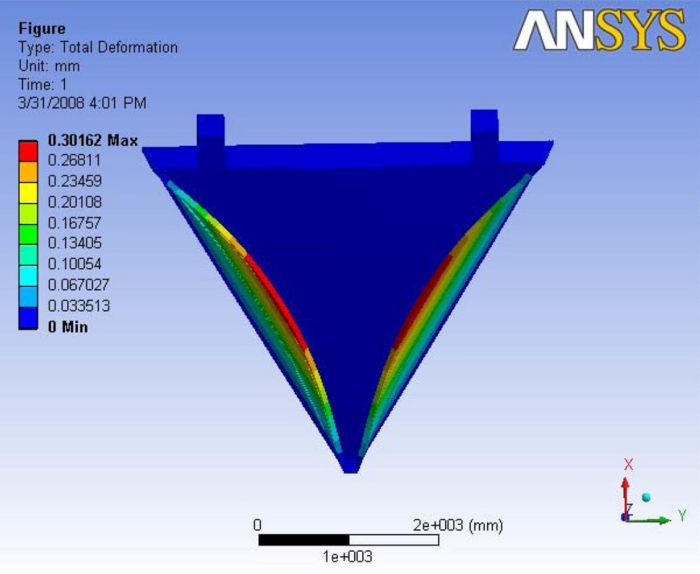
|
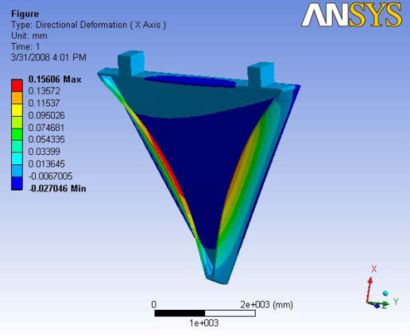 |
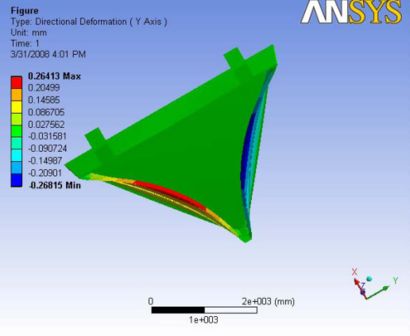 |
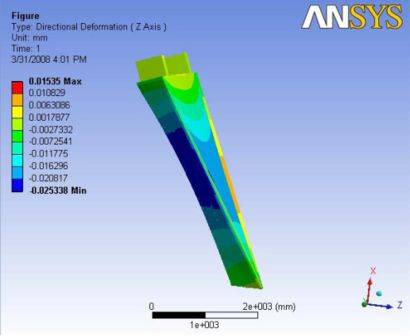
|
|- | Figure A.12: Images of Deflection for Analysis 4.3 in D,X,Y,Z Directions respectively
Analysis 5
The Individual addition of both carbon rods and hexcel sheet in the geometry greatly reduced the maximum deformation. Now, in this analysis Both of them are modeled at the same time. In the very first analysis, without the ball joint, the maximum deflection is observed at the nose plate as it is free to move. however, after adding ball joint, the deflection is observed to be 20 microns at one of the carbon rod bowing away from the wires. The max deflection at the edge of the end plate is about 16 microns. Gravity increased the deflection at the carbon rod and made a very slight change on the deflection at the back plate and along the edge of the end plate.
Analysis 5.1
This analysis has both carbon rods and the hexcel sheet to reduce the deformation. This model is not constrained at the ball joint and the gravity wasn't modeled. So, the maximum deformation is observed at the nose plate which is about 123 microns. The deformation is observed to be reducing to the back plate side along the end plate. The carbon rods were slightly bowed out in the upward direction.
A Report of the analysis is available at File:Analysis 5.1.pdf
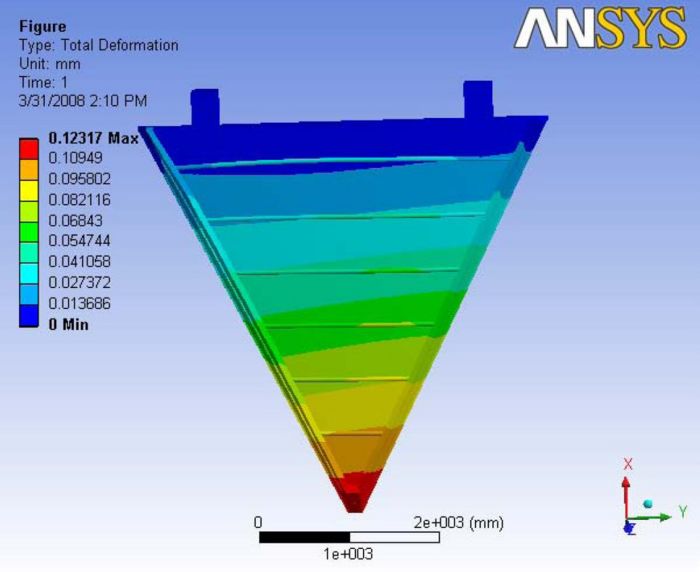
|
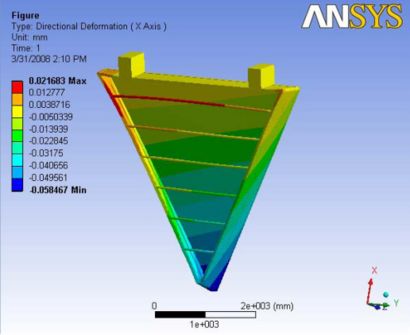 |
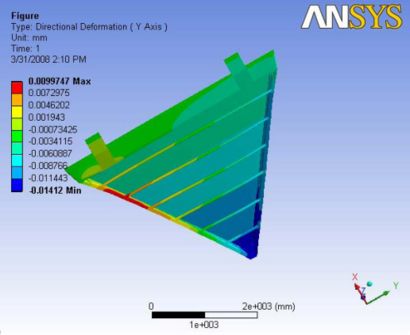 |
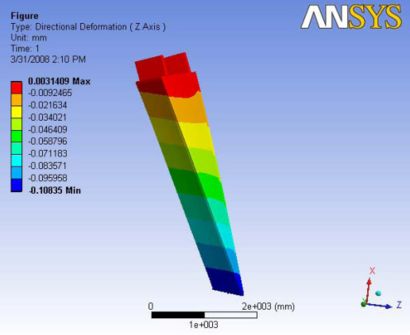
|
|- | Figure A.13: Images of Deflection for Analysis 5.3 in D,X,Y,Z Directions respectively
Analysis 5.2
The deformation shape is completely changed with the addition of the ball joint. The deformation lost its symmetric values. The maximum total deformation is observed at the carbon rods. The longest carbon rod at the very top is observed to hold the maximum deformation of about 20 microns. However, the maximum deformation observed along the end plate is about 16 microns. A Report of the analysis is available at File:Analysis 5.2.pdf
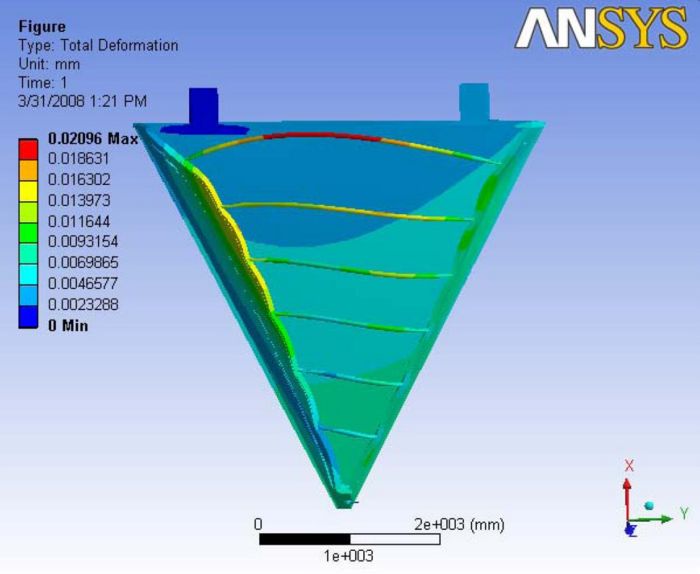
|
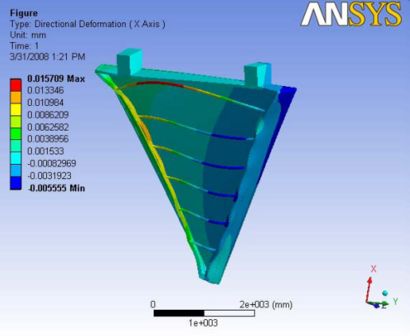 |
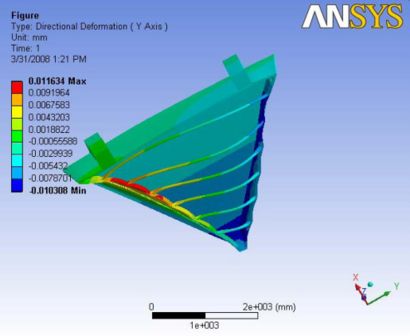 |
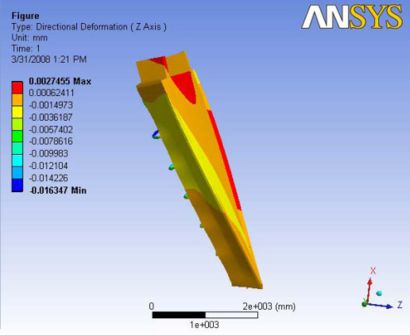
|
|- | Figure A.14: Images of Deflection for Analysis 5.2 in D,X,Y,Z Directions respectively
Analysis 5.3
Analysis 5.3 considers the end plate deflection due to the wire tension and gravity for a chamber which includes carbon rods and a Hexcel backing plate. The impact of having a ball joint and enclosing the front of the chamber with a mylar sheet is not included in this analysis. With the addition of gravity, the deformation is observed to retain the symmetric shape. Even the back plate is deformed and the bending is observed along the gravity vector. The deformation at the nose plate is about 7 microns. When gravity is included, the maximum deformation is observed at the very top carbon rod like in every other gravity case. The maximum deformation observed along the end plate is about 21 microns. Figure 5.2.1.1 shows the ANSYS FEA results for this analysis. The remaining configurations are shown in the appendices section (8) at the end of this report. Every section is described with the supporting images of deflection and a complete report available in pdf at their individual sections
The report generated by ANSYS is available: File:Analysis 5.3.pdf
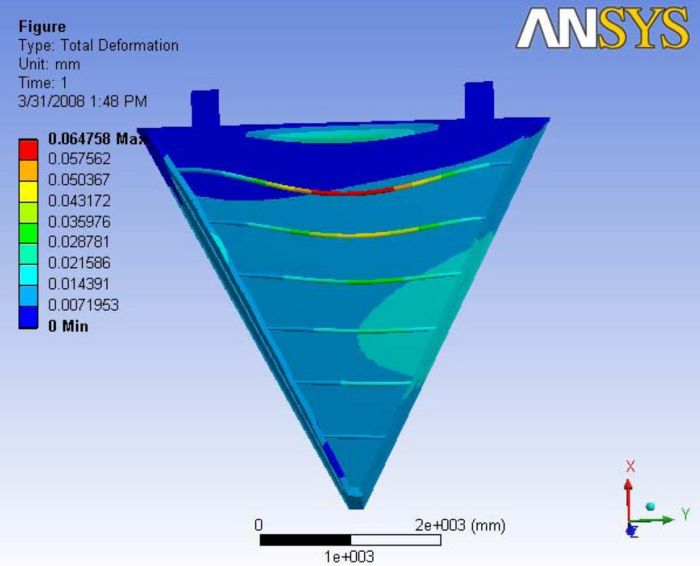
|
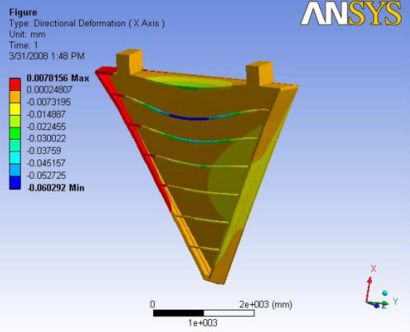 |
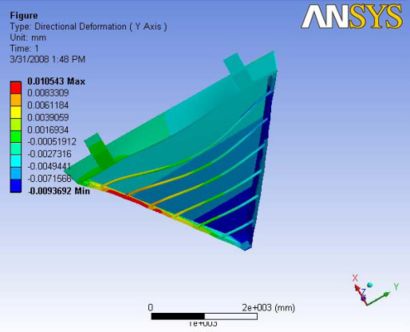 |
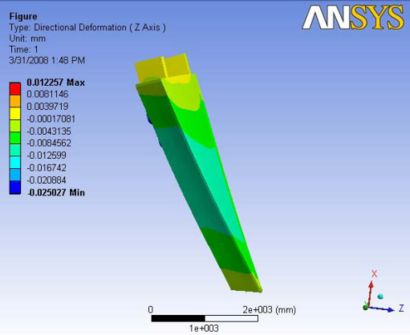
|
Figure 5.2.1.1: Images of Deflection for Analysis 5.3 in D,X,Y,Z Directions respectively
Analysis 6
This analysis is just to verify the gravity effects with no external loading. The results are very straight forward that the max deflection is at the nose plate when there is no ball joint, and with the ball joint the max deflection is at the top carbon rod as it is the longest of all the carbon rods and is heavier than the other carbon rods. The max deflection is at the center of that carbon rod.
Analysis 6.1
Gravity with no ball joint and with no external loading. The maximum deformation is observed at the nose plate and the deformation is observed to be linearly reducing towards the hinges. A Report of the analysis is available at File:Analysis 6.1.pdf
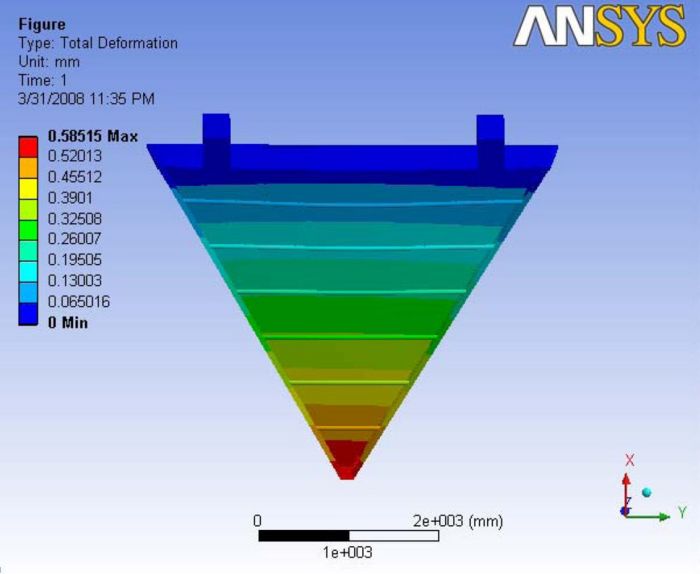
|
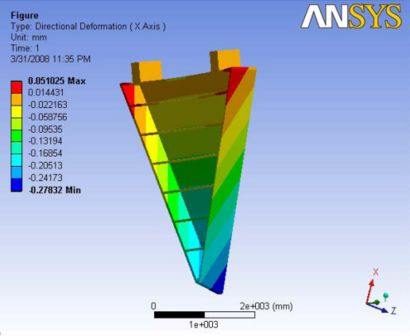 |
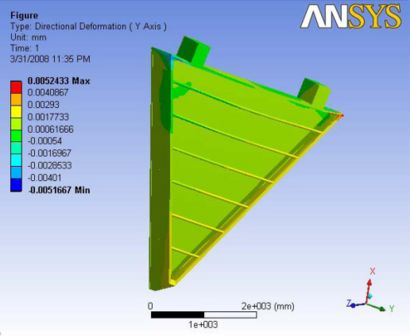 |
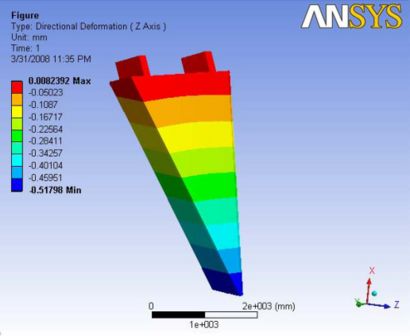
|
|- | Figure A.15: Images of Deflection for Analysis 6.1 in D,X,Y,Z Directions respectively
Analysis 6.2
With the addition of ball joint, the deformation close to nose plate is almost negligible. The maximum deflection is at the top carbon rod which is not of importance. The maximum total deflection at the end plate is about 16 microns A Report of the analysis is available at File:Analysis 6.2.pdf
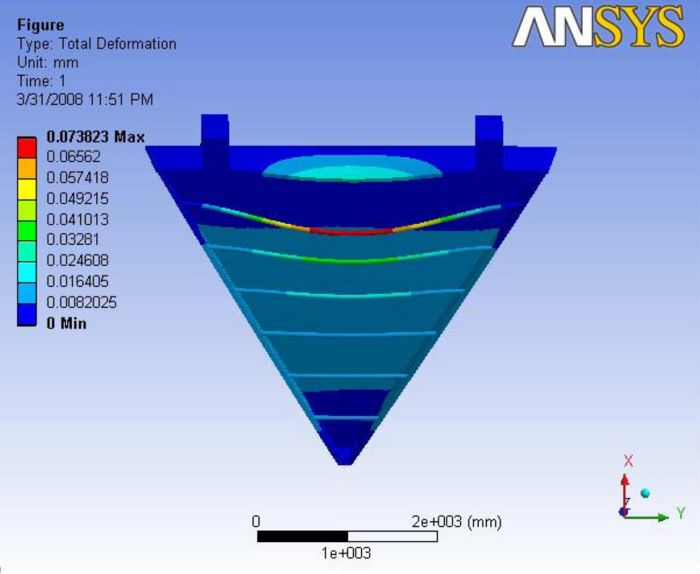
|
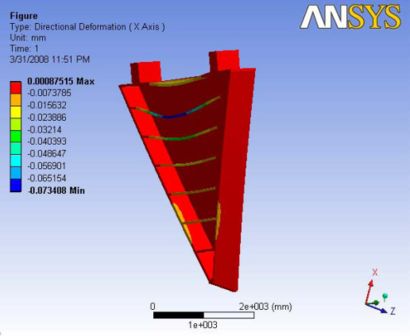 |
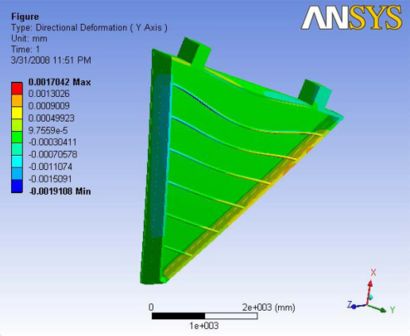 |
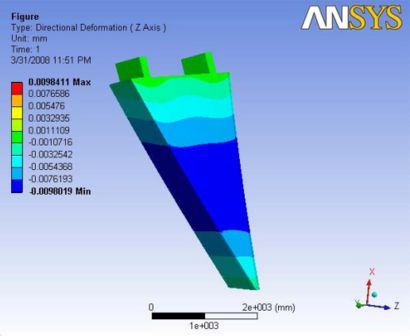
|
|- | Figure A.16: Images of Deflection for Analysis 6.2 in D,X,Y,Z Directions respectively
Summary
The amount of endplate deflection for several region three drift chamber designs was evaluated using ANSY. The wire tension load results in the most end plate deflection while the deflection due to gravity is an order of magnitude less. The wire tension creates the maximum deformation in the mid sections of the end plates. To reduce this effect, carbon rods on the front of the end plate and a hexcel sheet on the rear were added to the drift chamber frame. The addition of these two elements reduced the end plate deflection from 18.6 mm 0.021 mm. A deflection of 21 microns is within the end plate deflection design goal of 50 microns. A Buckling analysis of the longest carbon fiber rod indicates that the threshold force is 20 times greater than the expected applied load. The next phase of this analysis is to (1) refine and verify the loading conditions, (2) include the effects of a positive gas pressure inside the chamber (mylar front sheet), and (3) determine mechanical connections between components.
References
- [Mestayer07] "Tracking Detectors for CLAS12", 1/9/07, Mac Mestayer, Collaboration Document.
- [Mestayer00] M.D. Mestayer, et. al., NIM, A449, pg 81, 2000 Media:NIM_A449.pdf
- [Craig96] Mechanics of Materials, Roy R. Craig Jr., John Wiley & Sons, 1996
