Difference between revisions of "August 14, 2007 - Cosmic Telescope"
Jump to navigation
Jump to search
| (3 intermediate revisions by the same user not shown) | |||
| Line 1: | Line 1: | ||
[[Image:DiscriminatorTHreshold.jpg | 200 px]] | [[Image:DiscriminatorTHreshold.jpg | 200 px]] | ||
| − | [[Image:GraphExplanation.jpg]] | + | [[Image:GraphExplanation.jpg | 200 px]] |
| + | |||
| + | What is the size of the paddles? What is the conclusion from these studies? Why did we do this study? | ||
| + | |||
| + | |||
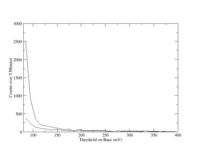
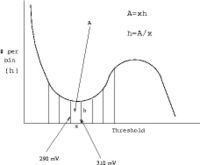
Points of data were taken in 5 minute intervals increasing the threshold by ten mV each time. This means that x is equal to ten mV in these trials. The data received in each interval is equal to the figure A (Area). This is the area of the interval under the curve over the distance x. To find the hight (h), the area A is divided by the distance x. | Points of data were taken in 5 minute intervals increasing the threshold by ten mV each time. This means that x is equal to ten mV in these trials. The data received in each interval is equal to the figure A (Area). This is the area of the interval under the curve over the distance x. To find the hight (h), the area A is divided by the distance x. | ||
| Line 494: | Line 498: | ||
|- | |- | ||
|320 | |320 | ||
| − | | | + | |1617, 1648 |
| − | + | |1633 | |
| − | | | ||
|- | |- | ||
| | | | ||
| | | | ||
| | | | ||
| − | | | + | |101 |
|- | |- | ||
|330 | |330 | ||
| − | | | + | |1544, 1519 |
| − | | | + | |1532 |
|- | |- | ||
| | | | ||
| | | | ||
| | | | ||
| − | | | + | |25 |
|- | |- | ||
|340 | |340 | ||
| − | | | + | |1518, 1472, 1532 |
| − | + | |1507 | |
| − | | | ||
|- | |- | ||
| | | | ||
| | | | ||
| | | | ||
| − | | | + | |137 |
|- | |- | ||
|350 | |350 | ||
| − | | | + | |1380, 1360 |
| − | + | |1370 | |
| − | | | ||
|- | |- | ||
| | | | ||
| | | | ||
| | | | ||
| − | | | + | |117 |
|- | |- | ||
|360 | |360 | ||
| − | | | + | |1244, 1262 |
| − | + | |1253 | |
| − | | | ||
|- | |- | ||
| | | | ||
| Line 543: | Line 543: | ||
|- | |- | ||
|370 | |370 | ||
| − | | | + | |1102, 1103 |
| − | | | + | |1103 |
|- | |- | ||
| | | | ||
| | | | ||
| | | | ||
| − | | | + | |45 |
|- | |- | ||
|380 | |380 | ||
| − | | | + | |1088, 1028 |
| − | | | + | |1058 |
|- | |- | ||
| | | | ||
| | | | ||
| | | | ||
| − | | | + | |28 |
|- | |- | ||
|390 | |390 | ||
| − | | | + | |1045, 1015 |
| − | | | + | |1030 |
|- | |- | ||
| | | | ||
| | | | ||
| | | | ||
| − | | | + | |157 |
|- | |- | ||
|400 | |400 | ||
| − | | | + | |882, 864 |
| − | | | + | |873 |
|} | |} | ||
Latest revision as of 20:20, 19 August 2007
What is the size of the paddles? What is the conclusion from these studies? Why did we do this study?
Points of data were taken in 5 minute intervals increasing the threshold by ten mV each time. This means that x is equal to ten mV in these trials. The data received in each interval is equal to the figure A (Area). This is the area of the interval under the curve over the distance x. To find the hight (h), the area A is divided by the distance x.
| Threshold for Base 1 | |||
|---|---|---|---|
| Threshold (mV) | Counts/5 min. | Average | A |
| 80 | 53126 | 53126 | |
| 24959 | |||
| 90 | 28167 | 28167 | |
| 9093 | |||
| 100 | 19074 | 19074 | |
| 3681 | |||
| 110 | 15427, 15358 | 15393 | |
| 1980 | |||
| 120 | 13375, 13450 | 13413 | |
| 160 | 8493 | 8493 | |
| 630 | |||
| 170 | 7863 | 7863 | |
| 794 | |||
| 180 | 7069 | 7069 | |
| 152 | |||
| 190 | 6917 | 6917 | |
| 729 | |||
| 200 | 6188 | 6188 | |
| 357 | |||
| 210 | 5831 | 5831 | |
| 230 | 5315 | 5315 | |
| 462 | |||
| 240 | 4853 | 4853 | |
| 463 | |||
| 250 | 4390 | 4390 | |
| 308 | |||
| 260 | 4236, 4047,
3963 |
4082 | |
| 142 | |||
| 270 | 4254, 3811,
3940, 3754 |
3940 | |
| 250 | |||
| 280 | 3840, 3539 | 3690 | |
| 232 | |||
| 290 | 3458 | 3458 | |
| 191 | |||
| 300 | 3267 | 3267 | |
| 189 | |||
| 310 | 3078 | 3078 | |
| 193 | |||
| 320 | 2871, 2888,
2895 |
2885 | |
| 131 | |||
| 330 | 2767, 2740 | 2754 | |
| 319 | |||
| 340 | 2432, 2423
2440, 2443 |
2435 | |
| 83 | |||
| 350 | 2405, 2412,
2303, 2287 |
2352 | |
| 154 | |||
| 360 | 2217, 2194,
2150, 2232 |
2198 | |
| 150 | |||
| 370 | 2035, 2060 | 2048 | |
| 138 | |||
| 380 | 1910 | 1910 | |
| 127 | |||
| 390 | 1783 | 1783 | |
| 48 | |||
| 400 | 1735 | 1735 | |
| Threshold for Base 2 | |||
|---|---|---|---|
| Threshold (mV) | Counts/5 min. | Average | A |
| 80 | 16574, 16457 | 16516 | |
| 3771 | |||
| 90 | 13131, 12358 | 12745 | |
| 2272 | |||
| 100 | 10509, 10438 | 10473 | |
| 1231 | |||
| 110 | 9223, 9260 | 9242 | |
| 1015 | |||
| 120 | 8133, 8320 | 8227 | |
| 845 | |||
| 130 | 7346, 7418 | 7382 | |
| 562 | |||
| 140 | 6740, 6900 | 6820 | |
| 645 | |||
| 150 | 6176, 6173 | 6175 | |
| 553 | |||
| 160 | 5696, 5548 | 5622 | |
| 351 | |||
| 170 | 5355, 5187 | 5271 | |
| 445 | |||
| 180 | 4782, 4869 | 4826 | |
| 350 | |||
| 190 | 4449, 4502 | 4476 | |
| 363 | |||
| 200 | 4105, 4121 | 4113 | |
| 323 | |||
| 210 | 3893, 3687 | 3790 | |
| 281 | |||
| 220 | 3471, 3547 | 3509 | |
| 190 | |||
| 230 | 3317, 3320 | 3319 | |
| 231 | |||
| 240 | 3094, 3081 | 3088 | |
| 236 | |||
| 250 | 2829, 2874 | 2852 | |
| 176 | |||
| 260 | 2670, 2682 | 2676 | |
| 163 | |||
| 270 | 2557, 2469 | 2513 | |
| 228 | |||
| 280 | 2284, 2286 | 2285 | |
| 181 | |||
| 290 | 2119, 2089 | 2104 | |
| 161 | |||
| 300 | 1956, 1930 | 1943 | |
| 190 | |||
| 310 | 1777, 1729 | 1753 | |
| 120 | |||
| 320 | 1617, 1648 | 1633 | |
| 101 | |||
| 330 | 1544, 1519 | 1532 | |
| 25 | |||
| 340 | 1518, 1472, 1532 | 1507 | |
| 137 | |||
| 350 | 1380, 1360 | 1370 | |
| 117 | |||
| 360 | 1244, 1262 | 1253 | |
| 150 | |||
| 370 | 1102, 1103 | 1103 | |
| 45 | |||
| 380 | 1088, 1028 | 1058 | |
| 28 | |||
| 390 | 1045, 1015 | 1030 | |
| 157 | |||
| 400 | 882, 864 | 873 | |

