Difference between revisions of "CH Thesis Revision 1"
| (53 intermediate revisions by 2 users not shown) | |||
| Line 8: | Line 8: | ||
==Optically Stimulated Luminescence== | ==Optically Stimulated Luminescence== | ||
| − | Optically stimulated luminescence describes the emission of light that results when photons are used to free trapped electrons (holes) moving them to the conduction (valence) band such that they recombine with trapped holes (electrons). | + | Optically stimulated luminescence describes the emission of light that results when photons are used to free trapped electrons (holes) moving them to the conduction (valence) band such that they recombine with trapped holes (electrons). Incident ionizing radiation creates electron-hole pairs. As the hole or electron moves through the band gap, they become trapped in imperfections in the crystal lattice. By exposing the crystal to an LED, these trapped holes and electrons are freed and can then recombine[1]. Photons emitted through the recombining process can escape the crystal and be counted by a photomultiplier tube. |
| + | |||
| + | |||
you should read the reference below. In particular Figure 3.2. You do not mention the role of defects in the above description | you should read the reference below. In particular Figure 3.2. You do not mention the role of defects in the above description | ||
| Line 16: | Line 18: | ||
==Optically Stimulated Luminescence Dosimeters (OSLs)== | ==Optically Stimulated Luminescence Dosimeters (OSLs)== | ||
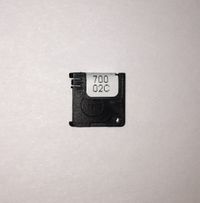
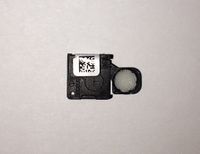
| − | The nanoDot< | + | The nanoDot<sup>tm</sup> OSLs are small enough to be irradiated in a multitude of experimental settings and can be annealed to be reused due to the properties of the carbon-doped aluminum oxide crystal. The crystal has a diameter of 0.501 <math>\pm</math> 0.007 cm and a thickness of 0.03 <math>\pm</math>0.001 cm. These dimensions yield an average volume of <math>5.89*10^{-3} \pm 1.9*10^{-4} cm^{3}</math>. This crystal is contained within a (1 <math>\pm</math> 0.001 cm) x (1 <math>\pm</math> 0.002 cm) x (0.196 <math>\pm</math> 0.002 cm) ABS plastic square to stop the crystal annealing in daylight. Each of the OSLs are labeled with a unique serial number that is used to uniquely identify an OSL with a specific spatial location. Having the position of each OSL logged during experiments yields a measurement of the incident radiation field intensity as a function of position. |
| − | + | [[File:Closed_Nanodot_Front.jpg|200px|thumb|left|(Figure 21L) Front of a nanoDot<sup>tm</sup> OSL with serial number.]] [[File:Open_Nanodot.jpg|200px|thumb|center|(Figure 21R) Back of a nanoDot<sup>tm</sup> OSL with exposed crystal.]] | |
| − | |||
| − | + | Ionizing radiation deposits energy into the crystalline structure of the OSL through the mechanisms described in section 2.1. One source of this radiation is the 25B Linac at the IAC. Electrons fired from this accelerator will deposit energy through two different mechanisms, ionization or collisions. Of these two, ionization is the dominant effect. Producing a photon beam can be accomplished by manipulating the exit port with a converter and sweeper magnet which is then used to irradiate the OSLs. Photons ionize the crystal structure through pair production, Compton scattering, and ionization, with ionization being the lead contributor. | |
| + | As the OSLs are reusable, it is important to be able to anneal them. A Verilux HappyLight<sup>R</sup> Deluxe is used to anneal the OSLs following each use to clear the dose from a previous irradiation. To clear the OSLs the crystal the crystal is exposed as in figure 21R and then set on the face of the HappyLight<sup>R</sup>. The photons produced by the light source interact with the trapped electrons and holes enabling them to recombine and emit a photon[1]. This process releases the energy stored in the crystal therefore reducing the measured dose from any previous irradiation. The OSL PMT counts are measured once the clearing is complete to nullify any small amount of remaining energy retained within the crystal. This quantity is considered to be the background for any measurement and is subsequently subtracted from the PMT counts following an irradiation. These background subtracted PMT counts give the direct response of the OSL to the exposure to which it was subjected. | ||
| − | + | ==Deposited Energy Simulations== | |
| − | |||
| − | + | ===Mixed Field Simulation=== | |
| − | |||
| − | == | ||
First you should describe the problem to be simulated. You are using a simulation to predict the dose on an OSL. You should describe how the OSLs are irradiated with electrons and photons. Then describe the steps GEANT4 takes to predict the OSL dose. The first step is to measure the electron beam divergence. The next step is to put that divergence into the simulation to predict the resulting photon distribution. | First you should describe the problem to be simulated. You are using a simulation to predict the dose on an OSL. You should describe how the OSLs are irradiated with electrons and photons. Then describe the steps GEANT4 takes to predict the OSL dose. The first step is to measure the electron beam divergence. The next step is to put that divergence into the simulation to predict the resulting photon distribution. | ||
| − | |||
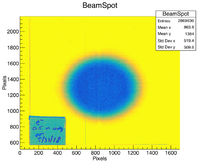
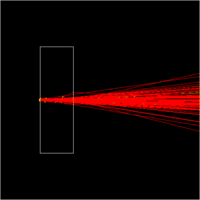
| − | It is important to understand | + | GEANT4 is used to simulate the interaction of ionizing radiation with the OSLs to mimic the experimental setup and to discern a baseline expected dose per pulse for the 25B Linac at the IAC. It is important to understand the divergence of the incident electron beam as the larger the divergence, the fewer electrons that irradiate the OSL. Glass slides were irradiated before the experimental run at 50 cm and 100 cm from the end of the beam pipe separately to find the beam divergence as a function of distance. The standard deviation in the beam spot was found by using a scan of each glass slide and then using ROOT's image processing functions to create histograms which were then converted from pixels to centimeters in the X and Y dimensions. Using these two images, the divergence is calculated by assuming a linear increase between the standard deviation of the images. It is possible to extrapolate back to the end of the beam pipe and infer the spot size as the beam enters the air once the standard deviation ratio in beam intensity is found. The ratio of the standard deviations is 0.593. The characteristics of the beam divergence are included in the GEANT4 macro in appendix 1. |
[[File:1st_beam_50cm.png|200px|thumb|center|Processed image of irradiated glass slide at 50 cm before beam retune.]] | [[File:1st_beam_50cm.png|200px|thumb|center|Processed image of irradiated glass slide at 50 cm before beam retune.]] | ||
Due to a systematic failure of a gate valve in the accelerator, the beam had to be retuned after the initial images were created, and a third glass plate was then irradiated at 50 cm from the end of the beam pipe for the retuned beam. The beam used to irradiate the OSLs had a standard deviation of 1.626 cm, inferred from the glass plate irradiated at 50 cm. Assuming similar divergence characteristics, the spread was scaled using the same scaling factor of 0.593. Using this information to extrapolate back to the end of the beam pipe, the beam had a calculated sigma of 0.965 cm. The beam divergence characteristics assumed here were used in GEANT4 for a simulation of the expected dose per pulse. | Due to a systematic failure of a gate valve in the accelerator, the beam had to be retuned after the initial images were created, and a third glass plate was then irradiated at 50 cm from the end of the beam pipe for the retuned beam. The beam used to irradiate the OSLs had a standard deviation of 1.626 cm, inferred from the glass plate irradiated at 50 cm. Assuming similar divergence characteristics, the spread was scaled using the same scaling factor of 0.593. Using this information to extrapolate back to the end of the beam pipe, the beam had a calculated sigma of 0.965 cm. The beam divergence characteristics assumed here were used in GEANT4 for a simulation of the expected dose per pulse. | ||
| + | |||
[[File:GEANT4 Sim CH Thesis.png|200px|thumb|center|Electron beam propagating through 50 cm of air to show beam divergence.]] | [[File:GEANT4 Sim CH Thesis.png|200px|thumb|center|Electron beam propagating through 50 cm of air to show beam divergence.]] | ||
| − | In the | + | |
| + | To begin the process of simulating a pulse of the 25B Linac at the IAC, the number of electrons per pulse must be found. Using a <math>50\ \frac{mA}{pulse}</math> peak current and a pulse width of <math>500\ ns</math>, the number of electrons per pulse is found to be <math>1.56055*10^{11}\frac{e^{-}}{pulse}</math>. In order to save computation time, the number of electrons simulated is scaled down by 5 orders of magnitude to <math>1.56055*10^{6}\frac{e^{-}}{pulse}</math>. The beam is incident upon a titanium beam pipe window, 50 cm of air, and finally the OSL crystal in the simulation. Energy is lost throughout the travel of the beam through each volume before impinging upon the OSL crystal. The energy deposited in the OSL crystal is summed of the course of the whole simulation and then scaled back up to represent a full pulse from the accelerator. Finding the simulated dose per pulse is accomplished by dividing the deposited energy by the mass of the OSL crystal. This gave the dose in units of Gray; which were then converted directly to Rad to be used in comparison to measured results. | ||
<math> | <math> | ||
\text{Simulated deposited energy per pulse} = 2590.81*10^{5}\text{MeV} = 4.1509350664*10^{-5} \text{J} | \text{Simulated deposited energy per pulse} = 2590.81*10^{5}\text{MeV} = 4.1509350664*10^{-5} \text{J} | ||
| Line 55: | Line 55: | ||
= 176.803 \text{Rad/pulse} | = 176.803 \text{Rad/pulse} | ||
</math> | </math> | ||
| + | |||
| + | |||
| + | ===Bremsstrahlung Photon Field Simulation=== | ||
| + | |||
| + | GEANT4 tracks the deposited energy on a particle by particle basis. With the incident photon field being so widely divergent, there were fewer particles incident upon the OSL. With this being the case and that the deposited energy per particle was so close to zero, limitations in the software did not allow a total accumulated deposited energy to be found. | ||
=Experimental Apparatus= | =Experimental Apparatus= | ||
| − | The nanoDot<sup>tm</sup> OSL performance was determined by first calibrating the detectors with a known source and then exposing the detectors to | + | The nanoDot<sup>tm</sup> OSL performance was determined by first calibrating the detectors with a known source and then exposing the detectors to a bremsstrahlung photon field and a mixed electron and photon field created by the 25B linear accelerator. A radioactive source of Cs-137 with a known activity of 9.3 Ci was used to irradiate the OSLs for calibration. A description of this source is given below in section 3.1. After a reliable calibration is found, the OSLs are exposed to a radiation field of only Bremsstrahlung photons using electrons accelerated by the linac described in section 3.2. The accelerator exit port is then reconfigured to irradiate the OSLs in a mixed field of electrons and photons. A description of both experimental setups is given below in sections 3.3.1 and 3.3.2 |
| Line 73: | Line 78: | ||
</math> | </math> | ||
| − | + | [2] | |
| + | A gamma factor of <math>{\Gamma} = 0.33 \frac {(m^2)(R)}{(Ci)(hr)} </math> and activity <math>{A} = 9.3\ Ci</math> provided by the Idaho State University Technical Safety Office is used in these calculations. The distance from the faceplate to the surface of the source needs to be taken into account given the inverse squared distance dependency of the exposure rate. The total distance D is then, D = (Distance to faceplate + 0.112m). | ||
| − | With the exposure rate (<math> | + | |
| + | With the exposure rate (<math>\dot R</math>) found using these known values, it is possible to find the total exposure (<math>R_{tot}</math>) the OSLs are subjected to by integrating the exposure rate over the time the OSL was exposed to the source. | ||
<math> | <math> | ||
| Line 83: | Line 90: | ||
It is necessary when working with exposure to be able to convert from Roentgen to Rad as exposure is calculated in Roentgen and dose is measure in Rad or Gy. The relationship between background subtracted PMT counts and dose can be established using the relationship of 1.14554 Roentgen = 1 Rad. | It is necessary when working with exposure to be able to convert from Roentgen to Rad as exposure is calculated in Roentgen and dose is measure in Rad or Gy. The relationship between background subtracted PMT counts and dose can be established using the relationship of 1.14554 Roentgen = 1 Rad. | ||
| + | |||
| + | [2] http://holbert.faculty.asu.edu/eee460/HealthPhysics.pdf | ||
==25B Linac== | ==25B Linac== | ||
| Line 93: | Line 102: | ||
==Experimental Procedure== | ==Experimental Procedure== | ||
| − | ===Photon | + | ===Photon Field Procedure=== |
| − | To expose the OSLs to a photon | + | To expose the OSLs to a bremsstrahlung photon field, a one inch thick aluminum brick and sweeper magnet were inserted at 50 cm from the end of the beam pipe. The aluminum brick was used as the converter followed by the sweeper magnet to redirect any charged particles away from the photon beam. An array of 17 OSLs was placed at a distance of one meter from the end of the beam pipe and then irradiated. This setup was irradiated twice, with different arrays of OSLs to gather dose per pulse information for the photon beam. Each array was exposed to approximately 52000 pulses at a rep rate of 250Hz. The run plan can be found in Appendix 2. |
To discern dose per pulse and reproducibility information from the measurements of the photon beam, the OSLs are subjected to the same beam characteristics throughout the custom run-plan. These characteristics consist of a beam energy of 8 MeV, pulse width of 500 ns, and a peak current of 50 mA. | To discern dose per pulse and reproducibility information from the measurements of the photon beam, the OSLs are subjected to the same beam characteristics throughout the custom run-plan. These characteristics consist of a beam energy of 8 MeV, pulse width of 500 ns, and a peak current of 50 mA. | ||
| Line 104: | Line 113: | ||
[[File:Square_Array_Photons.png|200px|center|thumb|Average dose of the two arrays irradiated by the photon beam. Each square corresponds to the physical size and location of each OSL irradiated.]] | [[File:Square_Array_Photons.png|200px|center|thumb|Average dose of the two arrays irradiated by the photon beam. Each square corresponds to the physical size and location of each OSL irradiated.]] | ||
| − | |||
| − | === | + | ===Mixed Field Procedure=== |
| − | Exposing OSLs to an electron beam is accomplished by placing an OSL in front of the 25B Linac at the IAC. Using | + | Exposing OSLs to an electron beam is accomplished by placing an OSL in front of the 25B Linac at the IAC. Using tape to secure an OSL to a glass plate at 50 cm from end of beam pipe, and a laser centered on the end of the beam pipe, the OSL can be exposed to electrons on-axis for the beam. This setup is used to gather dose per pulse information. Then, by varying the number of pulses which impinge upon the OSLs, a pulse versus dose relationship can be established. |
Once single OSLs had been irradiated on-axis, a 4 x 4 array of 16 OSLs was inserted and exposed to the electron beam. As the 4 x 4 array did not allow for a symmetric orientation while having an OSL centered on-axis, the future arrays were modified to consist of 17 OSLs. This modification created more data points for the on-axis dose per pulse measurements. The OSLs were measured before and after irradiation to see how much dose was deposited. | Once single OSLs had been irradiated on-axis, a 4 x 4 array of 16 OSLs was inserted and exposed to the electron beam. As the 4 x 4 array did not allow for a symmetric orientation while having an OSL centered on-axis, the future arrays were modified to consist of 17 OSLs. This modification created more data points for the on-axis dose per pulse measurements. The OSLs were measured before and after irradiation to see how much dose was deposited. | ||
| Line 132: | Line 140: | ||
=Data Analysis= | =Data Analysis= | ||
| + | |||
| + | The relationship between PMT counts and calculated exposure was completed and then followed by the irradiation of the OSLs in the bremsstrahlung photon beam and mixed photon and electron field. The analysis of the PMT counts and exposure relationship is described in section 4.1. along with the equation of the fit with the calculated uncertainties. This is used to calculate all of the dose measurements for the irradiation with the 25B linac. After the dose measurement analysis in section 4.2, the uncertainties were calculated and propagated from the high dose calibration. | ||
| + | |||
| + | |||
| + | |||
| + | |||
==nanoDot<sup>tm</sup> OSL Calibration== | ==nanoDot<sup>tm</sup> OSL Calibration== | ||
| Line 137: | Line 151: | ||
The response of the nanoDot<sup>tm</sup> OSLs to electrons and photons can be quantified in terms of dose using a calibration. Initial attempts to calibrate the OSLs were to follow the manufacturers guidelines, through which two different calibrations are created; a high dose, and a low dose. The low dose calibration is used by the OSL reader when the measured dose is less than 10000 mRad, and the high dose is used for any values exceeding 10000 mRad. These calibrations are created by reading in pre-dosed OSLs provided by Landauer so the OSL reader software can create a linear fit between PMT counts and dose. Using these calibrations assumes that the pre-dosed OSLs have not been subjected to any other exposure during the shipping and storing before use. It was this assumption that led to the creation of a custom calibration using a Cs-137 source. Using a source of known activity allows for calculated exposure rates and a well understood calibration as there is less uncertainty in the dose on the OSL. | The response of the nanoDot<sup>tm</sup> OSLs to electrons and photons can be quantified in terms of dose using a calibration. Initial attempts to calibrate the OSLs were to follow the manufacturers guidelines, through which two different calibrations are created; a high dose, and a low dose. The low dose calibration is used by the OSL reader when the measured dose is less than 10000 mRad, and the high dose is used for any values exceeding 10000 mRad. These calibrations are created by reading in pre-dosed OSLs provided by Landauer so the OSL reader software can create a linear fit between PMT counts and dose. Using these calibrations assumes that the pre-dosed OSLs have not been subjected to any other exposure during the shipping and storing before use. It was this assumption that led to the creation of a custom calibration using a Cs-137 source. Using a source of known activity allows for calculated exposure rates and a well understood calibration as there is less uncertainty in the dose on the OSL. | ||
| − | + | It is possible to eliminate the effect of any unknown factors that could have altered the listed dose on the pre-dosed OSLs by subjecting a set of OSLs to a range of known total exposures. By using a calculated exposure and a well known source to irradiate the OSLs a direct relationship between known exposure and background subtracted PMT counts can be established. A set of fifteen previously unexposed OSLs was chosen at random and exposed to the 9.3 Ci Cesium-137 source to begin calibrating the OSLs. | |
| − | |||
| − | |||
[[File:LowDose.png|200px]] [[File:HighDose.png|200px]] | [[File:LowDose.png|200px]] [[File:HighDose.png|200px]] | ||
| − | Multiple OSLs were exposed to the Cs-137 source for the same amount of time and then each was measured by the OSL reader. The PMT counts were recorded and | + | Multiple OSLs were exposed to the Cs-137 source for the same amount of time and then each was measured by the OSL reader. The PMT counts were recorded and the standard deviation in the set of measurements was determined by: |
<math> | <math> | ||
\sigma = \sqrt{\frac{\Sigma(x_{i}\ -\ \bar x)^{2}}{n\ -\ 1}} | \sigma = \sqrt{\frac{\Sigma(x_{i}\ -\ \bar x)^{2}}{n\ -\ 1}} | ||
| Line 160: | Line 172: | ||
==Experimental Data== | ==Experimental Data== | ||
| − | ===Photon | + | ===Photon Field Analysis=== |
| − | The dose | + | |
| + | The expected dose from a bremsstrahlung photon field at 100 cm from the end of the beam pipe was simulated to be less than that of a mixed electron and photon field. This was found to be true during the dose per pulse calculations. From the two arrays of 17 OSLs, the central OSL PMT counts were measured after around 50 pulses to give a benchmark dose per pulse for the mixed field. It was concluded that 52000 pulses could be used to irradiate the arrays without concern of saturation. The PMT counts for each OSL array were measured and the high dose calibration was used to calculate the total dose following the completion of the mixed field irradiation study. The uncertainty in each dose calculation was propagated through from the high dose calibration in section 4.1. The raw data is fed into a custom data analysis script once the compilation of each measurement was complete. The average dose per pulse for the mixed field irradiation was found to be 10.32 <math>\pm</math> 0.30 mRad. | ||
[[File:Contour Photons.png|200px|center|thumb|Contour plot of the average photon dose measurements in Rad.]] | [[File:Contour Photons.png|200px|center|thumb|Contour plot of the average photon dose measurements in Rad.]] | ||
| Line 170: | Line 183: | ||
| − | === | + | |
| + | |||
| + | ===Mixed Field Analysis=== | ||
| + | |||
| + | The mixed electron and photon field irradiation study began with the dosing of single OSLs followed by irradiating an array of 17 OSLs. The single OSLs were positioned on axis for the incident beam at a distance of 50 cm from the end of the beam pipe. Each OSL subject to a small number of pulses, varying from two to six. By varying the number of pulses a relationship can be found between total dose and number of pulses, see run plan in Appendix 2 for more details. | ||
| + | |||
| + | |||
| + | |||
| + | |||
| + | [[File:Pulse v Dose Fit.png|200px|center|thumb|Linear fit of number of pulses vs calculated dose for all electron beam on axis OSLs with the error being relative sigma.]] | ||
| + | |||
| + | |||
| + | |||
| + | |||
| + | |||
| + | |||
Starting with single OSLs positioned on-axis for the electron beam at a distance of 50 cm, each was irradiated with two to six pulses, see run plan in Appendix 2. Using the OSL reader, PMT counts for each OSL are measured. The dose can then be calculated using PMT counts and the high dose calibration. A single array of 17 OSLs was irradiated with the electron beam following the completion of the single OSLs. This array provides off axis dose information and it covers a large enough area to provide an interpretation of the general shape of the electron beam. The X = Y and X = -Y diagonals are used to look at the shape. | Starting with single OSLs positioned on-axis for the electron beam at a distance of 50 cm, each was irradiated with two to six pulses, see run plan in Appendix 2. Using the OSL reader, PMT counts for each OSL are measured. The dose can then be calculated using PMT counts and the high dose calibration. A single array of 17 OSLs was irradiated with the electron beam following the completion of the single OSLs. This array provides off axis dose information and it covers a large enough area to provide an interpretation of the general shape of the electron beam. The X = Y and X = -Y diagonals are used to look at the shape. | ||
| Line 197: | Line 225: | ||
</math> | </math> | ||
| − | + | ===Experimental Uncertainty=== | |
| + | |||
| + | Any calculated dose in this experiment has an uncertainty that is propagated through from the high dose calibration. All of the doses were calculated directly from the measured PMT counts and then input into the following: | ||
| + | |||
| − | |||
| − | |||
<math> | <math> | ||
Dose = [(slope)(PMT\ counts) + Y_{int}] \pm \sqrt{(\sigma_{slope}(PMT\ counts))^{2}+(\sigma_{Y_{int}})^{2}} | Dose = [(slope)(PMT\ counts) + Y_{int}] \pm \sqrt{(\sigma_{slope}(PMT\ counts))^{2}+(\sigma_{Y_{int}})^{2}} | ||
</math> | </math> | ||
| + | |||
| + | |||
| + | |||
Following these calculations, the average dose per pulse can be calculated through | Following these calculations, the average dose per pulse can be calculated through | ||
| Line 221: | Line 253: | ||
</math> | </math> | ||
| − | The calculations for the relative errors yield | + | The calculations for the relative errors yield 9.53% for each measurement. This relative error shows that the dose can be known within <math>\pm</math>9.53%. |
=Conclusion= | =Conclusion= | ||
| − | It is imperative to create a known calibration to understand the reproducibility characteristics of the OSLs. Without being certain of the exposure the calibration OSLs have been subjected to, there can be some unknown uncertainty in the calibration. By | + | It is imperative to create a known calibration to understand the reproducibility characteristics of the OSLs. Without being certain of the exposure the calibration OSLs have been subjected to, there can be some unknown and unquantifiable uncertainty in the calibration. By limiting this uncertainty through known exposures and corresponding PMT measurements, any succeeding measurements are better understood. |
| − | Calculating the experimental uncertainty and propagating the uncertainty through from the high dose calibration led to the result that the OSLs are reproducible in the range of 460-1440 Rad to <math>\pm</math> | + | Calculating the experimental uncertainty and propagating the uncertainty through from the high dose calibration led to the result that the OSLs are reproducible in the range of 460-1440 Rad to <math>\pm</math> 215.14%. To follow this result, the mean dose for the on-axis electron beam is 213.87 Rad <math>\pm</math> 3.31%, while the mean dose per pulse for the photon beam is 10.38 mRad <math>\pm</math> 6.74% |
=Appendix= | =Appendix= | ||
Latest revision as of 16:06, 18 July 2018
Introduction
Optically Stimulated Luminescence Dosimeters (OSLs) are used at the Idaho Accelerator Center (IAC) in Pocatello, Idaho to measure radiation exposure. Dose measurements began with the Dot OSLs but issues with reproducibility led to the use of the newer nanoDotOSLs. These OSLs were calibrated using calculated exposures from a 137Cs source as there were questions about just how reproducible and responsive the OSLs are to ionizing radiation. The calculated exposure can be quantified in terms of absorbed dose through the relationship of photomultiplier tube (PMT) counts and dose through a simple conversion and linear relationship of the two values. The OSLs can then be used to take well understood dose measurements in mixed radiation fields.
You need to explain the difference between absorbed and effective dose
Theory
Optically Stimulated Luminescence
Optically stimulated luminescence describes the emission of light that results when photons are used to free trapped electrons (holes) moving them to the conduction (valence) band such that they recombine with trapped holes (electrons). Incident ionizing radiation creates electron-hole pairs. As the hole or electron moves through the band gap, they become trapped in imperfections in the crystal lattice. By exposing the crystal to an LED, these trapped holes and electrons are freed and can then recombine[1]. Photons emitted through the recombining process can escape the crystal and be counted by a photomultiplier tube.
you should read the reference below. In particular Figure 3.2. You do not mention the role of defects in the above description
[1] http://www.iaea.org/inis/collection/NCLCollectionStore/_Public/35/058/35058187.pdf
Optically Stimulated Luminescence Dosimeters (OSLs)
The nanoDottm OSLs are small enough to be irradiated in a multitude of experimental settings and can be annealed to be reused due to the properties of the carbon-doped aluminum oxide crystal. The crystal has a diameter of 0.501 0.007 cm and a thickness of 0.03 0.001 cm. These dimensions yield an average volume of . This crystal is contained within a (1 0.001 cm) x (1 0.002 cm) x (0.196 0.002 cm) ABS plastic square to stop the crystal annealing in daylight. Each of the OSLs are labeled with a unique serial number that is used to uniquely identify an OSL with a specific spatial location. Having the position of each OSL logged during experiments yields a measurement of the incident radiation field intensity as a function of position.
Ionizing radiation deposits energy into the crystalline structure of the OSL through the mechanisms described in section 2.1. One source of this radiation is the 25B Linac at the IAC. Electrons fired from this accelerator will deposit energy through two different mechanisms, ionization or collisions. Of these two, ionization is the dominant effect. Producing a photon beam can be accomplished by manipulating the exit port with a converter and sweeper magnet which is then used to irradiate the OSLs. Photons ionize the crystal structure through pair production, Compton scattering, and ionization, with ionization being the lead contributor.
As the OSLs are reusable, it is important to be able to anneal them. A Verilux HappyLightR Deluxe is used to anneal the OSLs following each use to clear the dose from a previous irradiation. To clear the OSLs the crystal the crystal is exposed as in figure 21R and then set on the face of the HappyLightR. The photons produced by the light source interact with the trapped electrons and holes enabling them to recombine and emit a photon[1]. This process releases the energy stored in the crystal therefore reducing the measured dose from any previous irradiation. The OSL PMT counts are measured once the clearing is complete to nullify any small amount of remaining energy retained within the crystal. This quantity is considered to be the background for any measurement and is subsequently subtracted from the PMT counts following an irradiation. These background subtracted PMT counts give the direct response of the OSL to the exposure to which it was subjected.
Deposited Energy Simulations
Mixed Field Simulation
First you should describe the problem to be simulated. You are using a simulation to predict the dose on an OSL. You should describe how the OSLs are irradiated with electrons and photons. Then describe the steps GEANT4 takes to predict the OSL dose. The first step is to measure the electron beam divergence. The next step is to put that divergence into the simulation to predict the resulting photon distribution.
GEANT4 is used to simulate the interaction of ionizing radiation with the OSLs to mimic the experimental setup and to discern a baseline expected dose per pulse for the 25B Linac at the IAC. It is important to understand the divergence of the incident electron beam as the larger the divergence, the fewer electrons that irradiate the OSL. Glass slides were irradiated before the experimental run at 50 cm and 100 cm from the end of the beam pipe separately to find the beam divergence as a function of distance. The standard deviation in the beam spot was found by using a scan of each glass slide and then using ROOT's image processing functions to create histograms which were then converted from pixels to centimeters in the X and Y dimensions. Using these two images, the divergence is calculated by assuming a linear increase between the standard deviation of the images. It is possible to extrapolate back to the end of the beam pipe and infer the spot size as the beam enters the air once the standard deviation ratio in beam intensity is found. The ratio of the standard deviations is 0.593. The characteristics of the beam divergence are included in the GEANT4 macro in appendix 1.
Due to a systematic failure of a gate valve in the accelerator, the beam had to be retuned after the initial images were created, and a third glass plate was then irradiated at 50 cm from the end of the beam pipe for the retuned beam. The beam used to irradiate the OSLs had a standard deviation of 1.626 cm, inferred from the glass plate irradiated at 50 cm. Assuming similar divergence characteristics, the spread was scaled using the same scaling factor of 0.593. Using this information to extrapolate back to the end of the beam pipe, the beam had a calculated sigma of 0.965 cm. The beam divergence characteristics assumed here were used in GEANT4 for a simulation of the expected dose per pulse.
To begin the process of simulating a pulse of the 25B Linac at the IAC, the number of electrons per pulse must be found. Using a peak current and a pulse width of , the number of electrons per pulse is found to be . In order to save computation time, the number of electrons simulated is scaled down by 5 orders of magnitude to . The beam is incident upon a titanium beam pipe window, 50 cm of air, and finally the OSL crystal in the simulation. Energy is lost throughout the travel of the beam through each volume before impinging upon the OSL crystal. The energy deposited in the OSL crystal is summed of the course of the whole simulation and then scaled back up to represent a full pulse from the accelerator. Finding the simulated dose per pulse is accomplished by dividing the deposited energy by the mass of the OSL crystal. This gave the dose in units of Gray; which were then converted directly to Rad to be used in comparison to measured results.
Bremsstrahlung Photon Field Simulation
GEANT4 tracks the deposited energy on a particle by particle basis. With the incident photon field being so widely divergent, there were fewer particles incident upon the OSL. With this being the case and that the deposited energy per particle was so close to zero, limitations in the software did not allow a total accumulated deposited energy to be found.
Experimental Apparatus
The nanoDottm OSL performance was determined by first calibrating the detectors with a known source and then exposing the detectors to a bremsstrahlung photon field and a mixed electron and photon field created by the 25B linear accelerator. A radioactive source of Cs-137 with a known activity of 9.3 Ci was used to irradiate the OSLs for calibration. A description of this source is given below in section 3.1. After a reliable calibration is found, the OSLs are exposed to a radiation field of only Bremsstrahlung photons using electrons accelerated by the linac described in section 3.2. The accelerator exit port is then reconfigured to irradiate the OSLs in a mixed field of electrons and photons. A description of both experimental setups is given below in sections 3.3.1 and 3.3.2
Cesium Source
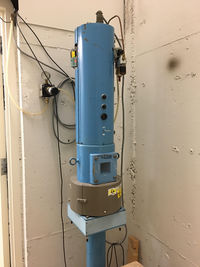
A 9.3 Ci 137Cs source was used to calibrate the OSLs by determining the relationship between the PMT counts measured using the OSL reader described in Appendix A and the OSLs exposure to the Cs source. The Cs source uses a system of interlocks to safely expose the OSLs to the source's radiation. The source is enclosed by a lead container, often call a "pig". There is an acrylic face plate bolted to the front of the pig, at a set distance of 11.2cm. The OSLs are positioned 30 cm from the faceplate of the source. Once the interlock requirements have been satisfied, the air supply is turned on allowing the shutter to be opened.
The exposure rate from the source is determined based on the distance (D) from the source, the activity (A) of the source, and a constant (). The exposure rate for any given distance is calculated in units of Roentgen/hr using the equation
[2]
A gamma factor of and activity provided by the Idaho State University Technical Safety Office is used in these calculations. The distance from the faceplate to the surface of the source needs to be taken into account given the inverse squared distance dependency of the exposure rate. The total distance D is then, D = (Distance to faceplate + 0.112m).
With the exposure rate () found using these known values, it is possible to find the total exposure () the OSLs are subjected to by integrating the exposure rate over the time the OSL was exposed to the source.
It is necessary when working with exposure to be able to convert from Roentgen to Rad as exposure is calculated in Roentgen and dose is measure in Rad or Gy. The relationship between background subtracted PMT counts and dose can be established using the relationship of 1.14554 Roentgen = 1 Rad.
[2] http://holbert.faculty.asu.edu/eee460/HealthPhysics.pdf
25B Linac
The RF frequency of the IAC's S-Band 25B Linac is 2856 MHz with an energy range of 4 - 25 MeV. With peak currents being easily able to hit 100mA, and pulse widths from 50 ns to 4 s, this accelerator is fully capable to operate at the simulated parameters of 8 MeV, 500 ns pulse width, and 50 mA peak current.
Experimental Procedure
Photon Field Procedure
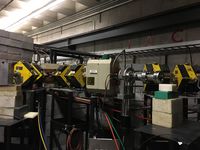
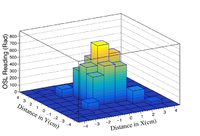
To expose the OSLs to a bremsstrahlung photon field, a one inch thick aluminum brick and sweeper magnet were inserted at 50 cm from the end of the beam pipe. The aluminum brick was used as the converter followed by the sweeper magnet to redirect any charged particles away from the photon beam. An array of 17 OSLs was placed at a distance of one meter from the end of the beam pipe and then irradiated. This setup was irradiated twice, with different arrays of OSLs to gather dose per pulse information for the photon beam. Each array was exposed to approximately 52000 pulses at a rep rate of 250Hz. The run plan can be found in Appendix 2.
To discern dose per pulse and reproducibility information from the measurements of the photon beam, the OSLs are subjected to the same beam characteristics throughout the custom run-plan. These characteristics consist of a beam energy of 8 MeV, pulse width of 500 ns, and a peak current of 50 mA.
Mixed Field Procedure
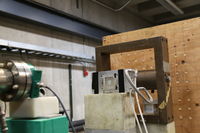
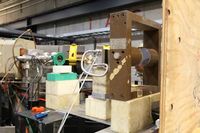
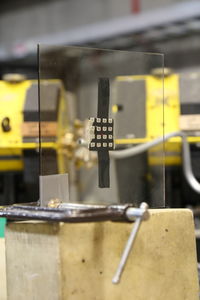
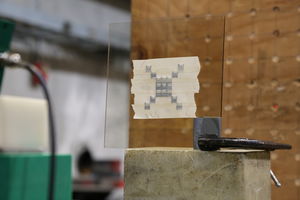
Exposing OSLs to an electron beam is accomplished by placing an OSL in front of the 25B Linac at the IAC. Using tape to secure an OSL to a glass plate at 50 cm from end of beam pipe, and a laser centered on the end of the beam pipe, the OSL can be exposed to electrons on-axis for the beam. This setup is used to gather dose per pulse information. Then, by varying the number of pulses which impinge upon the OSLs, a pulse versus dose relationship can be established.
Once single OSLs had been irradiated on-axis, a 4 x 4 array of 16 OSLs was inserted and exposed to the electron beam. As the 4 x 4 array did not allow for a symmetric orientation while having an OSL centered on-axis, the future arrays were modified to consist of 17 OSLs. This modification created more data points for the on-axis dose per pulse measurements. The OSLs were measured before and after irradiation to see how much dose was deposited.
Data Analysis
The relationship between PMT counts and calculated exposure was completed and then followed by the irradiation of the OSLs in the bremsstrahlung photon beam and mixed photon and electron field. The analysis of the PMT counts and exposure relationship is described in section 4.1. along with the equation of the fit with the calculated uncertainties. This is used to calculate all of the dose measurements for the irradiation with the 25B linac. After the dose measurement analysis in section 4.2, the uncertainties were calculated and propagated from the high dose calibration.
nanoDottm OSL Calibration
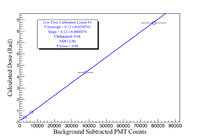
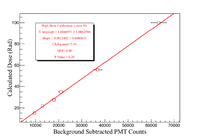
The response of the nanoDottm OSLs to electrons and photons can be quantified in terms of dose using a calibration. Initial attempts to calibrate the OSLs were to follow the manufacturers guidelines, through which two different calibrations are created; a high dose, and a low dose. The low dose calibration is used by the OSL reader when the measured dose is less than 10000 mRad, and the high dose is used for any values exceeding 10000 mRad. These calibrations are created by reading in pre-dosed OSLs provided by Landauer so the OSL reader software can create a linear fit between PMT counts and dose. Using these calibrations assumes that the pre-dosed OSLs have not been subjected to any other exposure during the shipping and storing before use. It was this assumption that led to the creation of a custom calibration using a Cs-137 source. Using a source of known activity allows for calculated exposure rates and a well understood calibration as there is less uncertainty in the dose on the OSL.
It is possible to eliminate the effect of any unknown factors that could have altered the listed dose on the pre-dosed OSLs by subjecting a set of OSLs to a range of known total exposures. By using a calculated exposure and a well known source to irradiate the OSLs a direct relationship between known exposure and background subtracted PMT counts can be established. A set of fifteen previously unexposed OSLs was chosen at random and exposed to the 9.3 Ci Cesium-137 source to begin calibrating the OSLs.
Multiple OSLs were exposed to the Cs-137 source for the same amount of time and then each was measured by the OSL reader. The PMT counts were recorded and the standard deviation in the set of measurements was determined by:
Where is each PMT measurement and is the average of the PMT counts and n is the number of OSLs subjected to the same exposure.
The standard deviation was used as the uncertainty in the PMT counts for the calibration. The Cs-137 source has a 30.17 yr half life, leading to an essentially static activity during the time of irradiation, as such, no uncertainty can be established in calculated exposure.
With the standard deviations in the PMT counts calculated, the relative error for each calculated exposure can be calculated. It was found that the relative error of the PMT counts varied between 3% and 5.3%. The relative percent error is found by
Experimental Data
Photon Field Analysis
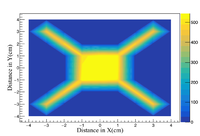
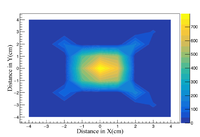
The expected dose from a bremsstrahlung photon field at 100 cm from the end of the beam pipe was simulated to be less than that of a mixed electron and photon field. This was found to be true during the dose per pulse calculations. From the two arrays of 17 OSLs, the central OSL PMT counts were measured after around 50 pulses to give a benchmark dose per pulse for the mixed field. It was concluded that 52000 pulses could be used to irradiate the arrays without concern of saturation. The PMT counts for each OSL array were measured and the high dose calibration was used to calculate the total dose following the completion of the mixed field irradiation study. The uncertainty in each dose calculation was propagated through from the high dose calibration in section 4.1. The raw data is fed into a custom data analysis script once the compilation of each measurement was complete. The average dose per pulse for the mixed field irradiation was found to be 10.32 0.30 mRad.
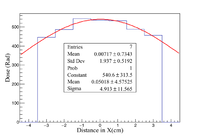
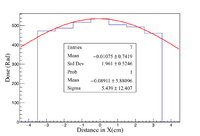
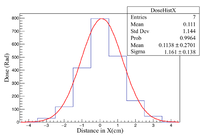
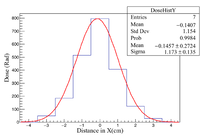
A 7 bin histogram is created to represent the OSLs with each bin being the same width as the OSLs. Fitting a gaussian to these histograms gives a rough interpretation of the shape of the beam impinging onto the OSLs. These two histograms are the X = Y and X = -Y diagonal OSLs. The doses used in the filling of the histograms is the average from the corresponding diagonal in each array.
Mixed Field Analysis
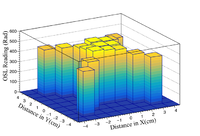
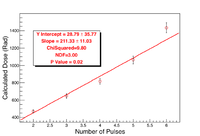
The mixed electron and photon field irradiation study began with the dosing of single OSLs followed by irradiating an array of 17 OSLs. The single OSLs were positioned on axis for the incident beam at a distance of 50 cm from the end of the beam pipe. Each OSL subject to a small number of pulses, varying from two to six. By varying the number of pulses a relationship can be found between total dose and number of pulses, see run plan in Appendix 2 for more details.
Starting with single OSLs positioned on-axis for the electron beam at a distance of 50 cm, each was irradiated with two to six pulses, see run plan in Appendix 2. Using the OSL reader, PMT counts for each OSL are measured. The dose can then be calculated using PMT counts and the high dose calibration. A single array of 17 OSLs was irradiated with the electron beam following the completion of the single OSLs. This array provides off axis dose information and it covers a large enough area to provide an interpretation of the general shape of the electron beam. The X = Y and X = -Y diagonals are used to look at the shape.
After irradiation, the OSLs were analyzed using the OSL reader. The measured PMT Counts were used to calculate the average dose per pulse through the high dose calibration. The mean dose per pulse for the electron beam study is 213.87 3.06 Rad. The dose for each PMT measurement was calculated via the fit for the high dose calibration.
Experimental Uncertainty
Any calculated dose in this experiment has an uncertainty that is propagated through from the high dose calibration. All of the doses were calculated directly from the measured PMT counts and then input into the following:
Following these calculations, the average dose per pulse can be calculated through
Where the is the uncertainty in the dose and is the dose calculation with no sigma.
With the standard deviation calculated for each individual measurement, the relative percent error is found with the same formula as in section 3.4, except with PMT counts replaced with dose.
The calculations for the relative errors yield 9.53% for each measurement. This relative error shows that the dose can be known within 9.53%.
Conclusion
It is imperative to create a known calibration to understand the reproducibility characteristics of the OSLs. Without being certain of the exposure the calibration OSLs have been subjected to, there can be some unknown and unquantifiable uncertainty in the calibration. By limiting this uncertainty through known exposures and corresponding PMT measurements, any succeeding measurements are better understood.
Calculating the experimental uncertainty and propagating the uncertainty through from the high dose calibration led to the result that the OSLs are reproducible in the range of 460-1440 Rad to 215.14%. To follow this result, the mean dose for the on-axis electron beam is 213.87 Rad 3.31%, while the mean dose per pulse for the photon beam is 10.38 mRad 6.74%
Appendix
Appendix 1
GEANT4 Macro
/gps/particle e-
/gps/pos/type Beam
/gps/pos/rot1 1 0 0
/gps/pos/rot2 0 1 0
/gps/pos/shape Circle
/gps/pos/centre 0 0 -91 cm
/gps/pos/sigma r 0.9652 cm
/gps/ang/rot1 0 1 0
/gps/ang/rot2 1 0 0
/gps/ang/type beam1d
/gps/ang/sigma r 0.756. deg
/gps/energy 8 MeV
/run/beamOn 1560550
Appendix 2
Run Plan
\begin{center}
\resizebox{5.3in}{!}
 {
  \begin{tabular}{| c | c | c | c | c | c | c | }
   \hline
   Shot Number & Number of Pulses & Number of OSLs & Dose (Rad) (0,0) & Dose/pulse (Rad) (0,0) & Al Brick with W Converter \\ \hline
   1 & 6 & 1 & 768.10344 & 128.017 & Out  \\ \hline
   2 & 6 & 1 & 795.26442 & 132.54407 & Out   \\ \hline
   3 & 6 & 16 & Off Center & Off Center & Out  \\ \hline
   4 & 6 & 17 & 592.89645 & 98.816075 & Out \\ \hline
   5 & 6 & 1 & 1435.75504 & 239.292 & Out \\ \hline
   6 & 2 & 1 & 468.28238 & 234.14119 & Out \\ \hline
   7 & 4 & 1 & 842.87814 & 210.719535 & Out \\ \hline
   8 & 5 & 1 & 1062.99342 & 212.598684 & Out\\ \hline
   9 & 6 & 1 & 646.63748 & 215.5458267 & Out\\ \hline
   10 & 4 & 17 & 796.48564 & 199.12141 & Out\\ \hline
   11 & 51948 & 17 & 531.9275 & .01023961461 & In\\ \hline
   12 & 52106 & 17 & 541.85896 & .01039916631 & In\\ \hline
   13 & 4 & 1 & 771.12338 & 192.780845 & Out\\ \hline
   14 & 4 & 1 & 841.583 & 210.39575 & Out\\ \hline
   15 & 4 & 1 & 832.54936 & 208.13734 & Out\\ \hline

   \hline
   \end{tabular}
   }
\end{center}
\section{Calibration Data}
put laundauer and custom calibration tables here
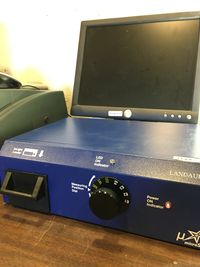
\section{OSL Reader Instructions} The OSL reader is a blue box of dimensions 32.75cm x 23.25cm x 10.5cm. On the left side of the front face is the drawer in which an OSL in a holder is inserted. Once the drawer is shut, the black knob on the front is turned from H/P to E1, opening the OSL and exposing the crystal to an LED.
Appendix 3
OSL reader Insructions
The MicroStar i reader manufactured by Landauer is used to measure the radiation dose absorbed by the OSL crystal. By inserting an OSL into the reader, the crystal structure is exposed to an LED, and a photomultiplier tube on the opposing side is used to measure the photons luminescing from the crystal.
Front of OSL reader.
OSL Holder
The OSL reader has software capable of calibrating the reader, through which low dose and high dose calibrations are created. These different calibrations give separate calibration factors. To create the calibrations for the software, Landauer supplies pre-dosed OSLs providing five measurements to encompass the device's dynamic range. Due to uncertainty in exposure between dosing and usage, a custom calibration is used to reduce error in succeeding measurements. The OSL reader calculates the dose based on the observed number of PMT counts . The equation used for this calculation is:
