Difference between revisions of "LB Thesis SNR"
| (One intermediate revision by the same user not shown) | |||
| Line 28: | Line 28: | ||
[[File:LB Thesis SNR Se81m BeamOff.png|200px]] | [[File:LB Thesis SNR Se81m BeamOff.png|200px]] | ||
[[File:LB Thesis SNR Se75 BeamOff.png|200px]] | [[File:LB Thesis SNR Se75 BeamOff.png|200px]] | ||
| + | |||
| + | Se-81m Fit Parameters: b = -0.32 <math> \pm </math> 0.01, m = 0.39 <math> \pm </math> 0.01, p<0.01 | ||
| + | |||
| + | Se-75 Fit Parameters: b = -0.01 <math> \pm </math> 0.0004 , m = 0.01 <math> \pm </math> 0.0004, p = 0.02 | ||
| + | |||
| + | The intersection with unity was found to be 3.38 <math> \pm </math> 0.07% for Se-81m and 101 <math> \pm </math> 4%. This makes physical sense because the signal to noise ratio for the first two measurements of Se-81m in the 1% sample had a signal to noise ratio of less than one, while the energy line for Se-75 was never visible in any of the initial spectra. | ||
| + | |||
| + | The error in the signal to noise ratio was calculated with | ||
| + | |||
| + | <math> \sigma_{SNR} = \sqrt{(\frac{1}{m^2})^2 \sigma_{m}^2 + \sigma_b^2} | ||
Latest revision as of 19:41, 27 June 2018
Background Analysis
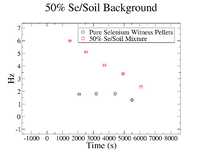
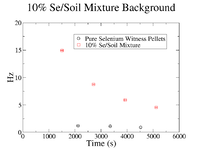
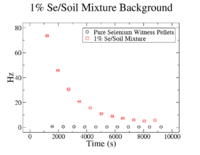
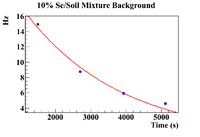
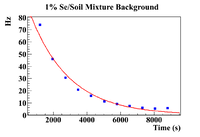
In order to find the SNR at , the background was analyzed to check if it remained constant from until . First, the background was plotted for each concentration of Se/Soil and was overlaid with the the background in the pure sample for each respective target.
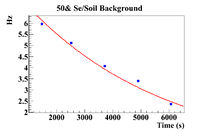
The clearest exponential behavior is seen in the 1% sample. The background rate dropped by 62% between the first and second measurements ( = 7.5 minutes). This indicated that considering the background to be constant from until , which was an average of 23.3 2.67 minutes would not be sufficient. Since this was the case, an exponential fit was attempted on the 1% mixture data to find the half life of the background (even though this is still just an estimate).
50% Fit Parameters: Constant = 2.11 0.004 , Slope = 1.99 0.002
10% Fit Parameters: 3.22 0.008, Slope = 3.67 0.003
1% Fit Parameters: 1% Fit Parameters 4.685 0.004, 4.30 0.001
The exponentiated constant was used as an "initial activity" of the background. This "initial activity" was then efficiency corrected and divided by the initial activity of the selenium line of interest's activity (103 for Se-81m and 265 for Se-75). The signal to noise ratio was calculated with
and the relative error was taken.
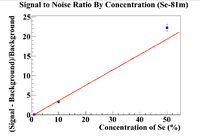
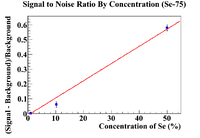
Once the points had been found, a linear fit was used to determine where the signal to noise ratio would intersect with unity.
Se-81m Fit Parameters: b = -0.32 0.01, m = 0.39 0.01, p<0.01
Se-75 Fit Parameters: b = -0.01 0.0004 , m = 0.01 0.0004, p = 0.02
The intersection with unity was found to be 3.38 0.07% for Se-81m and 101 4%. This makes physical sense because the signal to noise ratio for the first two measurements of Se-81m in the 1% sample had a signal to noise ratio of less than one, while the energy line for Se-75 was never visible in any of the initial spectra.
The error in the signal to noise ratio was calculated with
<math> \sigma_{SNR} = \sqrt{(\frac{1}{m^2})^2 \sigma_{m}^2 + \sigma_b^2}
