Difference between revisions of "170049 1% Se Soil Mixture Analysis"
| (2 intermediate revisions by the same user not shown) | |||
| Line 149: | Line 149: | ||
||Rate (Hz) ||13.98 +/- 0.22 || 26.16 +/- 0.32 || 17.70 +/- 0.26 | ||Rate (Hz) ||13.98 +/- 0.22 || 26.16 +/- 0.32 || 17.70 +/- 0.26 | ||
|- | |- | ||
| − | ||Integral Decay Correction (Hz) || | + | ||Integral Decay Correction (Hz) || 13.99 +/- 0.22 || 26.18 +/- 0.32 || 17.71 +/- 0.26 |
|- | |- | ||
||Dead Time (%) || 1.92 +/- 0.26 || 3.95 +/- 0.42 || 3.06 +/- 0.30 | ||Dead Time (%) || 1.92 +/- 0.26 || 3.95 +/- 0.42 || 3.06 +/- 0.30 | ||
|- | |- | ||
| − | ||Dead Time Corrected Signal (Hz) || | + | ||Dead Time Corrected Signal (Hz) ||14.26 +/- 0.23 || 27.26 +/- 0.35 || 18.27 +/- 0.27 |
|- | |- | ||
||Position on Det A (cm) || 70 || 10 || 10 | ||Position on Det A (cm) || 70 || 10 || 10 | ||
|- | |- | ||
| − | ||Efficiency (%) || 0. | + | ||Efficiency (%) ||0.0089 +/- 0.000179 || 0.31 +/- 0.003 || 0.31 +/- 0.003 |
|- | |- | ||
| − | ||Efficiency Corrected Rate (Hz) || | + | ||Efficiency Corrected Rate (Hz) || 160224.72 +/- 4130 || 8793.55 +/- 141.38 || 5893.55 +/- 104.11 |
|- | |- | ||
| − | ||.Dat File Entry For HL Plot || | + | ||.Dat File Entry For HL Plot || 11.98 +/- 0.03 || 9.08 +/- 0.02 || 8.68 +/- 0.02 |
|} | |} | ||
=Flux Simulations= | =Flux Simulations= | ||
The purpose of the flux simulations is to find if the factor that makes my ratios different than Segebade's. Below is the flux through the nickel foil. | The purpose of the flux simulations is to find if the factor that makes my ratios different than Segebade's. Below is the flux through the nickel foil. | ||
Latest revision as of 01:19, 29 March 2018
Below is the information for the target
Front Outer Nickel Foil: 3.4274g
Outer Se: 0.0914g
Soil: 10.240g
Inner Front Foil: 1.8672g
Inner Rear Foil: 1.7220g
Inner Se: 0.0954g
Rear Outer Foil: 3.4887g
Below is a table with the data that is to be analyzed for the mixture:
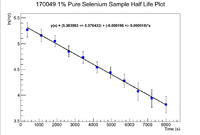
Below is the table for the pure selenium sample which was outside the aluminum cylinder
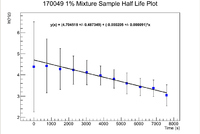
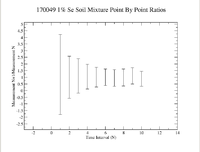
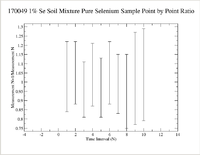
Below are the Half life plots and hte point by point ratio plots for the mixture and the pure selenium sample. Note the error in the mixture.
Nickel Foil Information
For the nickel I have been using counting statistics () to find the error in the signal. This is due to the fact that I can pin down the half life within uncertainty using this type of error.
Below is a table for the front outer nickel foil that was used in the sample.
Below is the table for the rear outer foil:
Flux Simulations
The purpose of the flux simulations is to find if the factor that makes my ratios different than Segebade's. Below is the flux through the nickel foil.


