Difference between revisions of "LB January Flux Simulations"
| (One intermediate revision by the same user not shown) | |||
| Line 54: | Line 54: | ||
==1.5 cm Diam beam== | ==1.5 cm Diam beam== | ||
Below is a more finely binned histogram so a better flux profile can be seen: | Below is a more finely binned histogram so a better flux profile can be seen: | ||
| + | |||
[[File:LB NickelFlux G4Sim 1.5cmBeam FullViewFineBins Jan2018.png|200px]] | [[File:LB NickelFlux G4Sim 1.5cmBeam FullViewFineBins Jan2018.png|200px]] | ||
| − | For a 1.5cm diameter beam I was able to find a place on the nickel foil that had half as much flux as the selenium. Below is a plot of the selenium flux | + | For a 1.5cm diameter beam I was able to find a place on the nickel foil that had half as much flux as the selenium. Below is a plot of the selenium flux with both fine bins and coarse bins |
| + | |||
| + | [[File:LB SeleniumFlux G4Sim 1.5cmBeam FullViewFineBins Jan2018.png|200px]] | ||
[[File:LB SeFluxPlot FullView 1.5cmBeam Jan2018.png|200px]] | [[File:LB SeFluxPlot FullView 1.5cmBeam Jan2018.png|200px]] | ||
Latest revision as of 17:06, 26 February 2018
Simulation Geometry
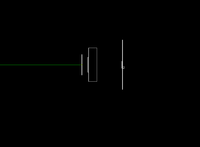
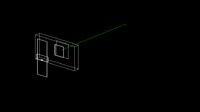
Simulations were run using geant4 to try and see if the ratio of the flux between the nickel foil and the inner selenium pellet would explain why the ratios of the rates are not correct. A general particle source was used to fire electrons in a beam at a titanium beam window, which then proceeds to an aluminum/tungsten radiator. After that the particles will encounter a nickel foil followed by an aluminum sheet and finally a selenium pellet that is -0.75cm off of the beam axis (to try and replicate the location of the foil relative to the selenium pellet). The run.mac file is shown below
/gps/particle e-
/gps/position 0 0 -5 m
/gps/pos/type Beam
/gps/pos/shape Circle
/gps/pos/radius 0.75 cm
/tracking/verbose 2
/gps/direction 0 0 1
/gps/verbose 2
/gps/pos/sigma_r 0.75 cm
/gps/energy 32 MeV
/run/beamOn 1000000
The dimensions of the pieces of interest are:
Se Pellet: 0.25cm radius Nickel Foil: 6cm in x, 2cm in y
A picture of the setup is shown below:
Results
2.5 cm diam electron beam
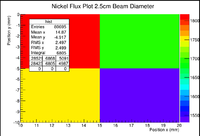
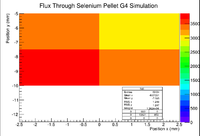
Below are the flux plots as a function of position for the nickel foil and the selenium pellet using a 2.5cm beam diameter.
Now try moving the target around until there is an area that has half as much flux as the selenium pellet.
We can see here that the selenium pellet has 13620 counts in it, while the selected region of the nickel foil has 6805 counts. Taking the ratio gives 0.50.
It could be feasible that with a 2.5cm diameter beam that if the pellet were centered at 1.5cm off beam axis in the x direction, then the flux would be half.
1.5 cm Diam beam
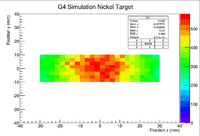
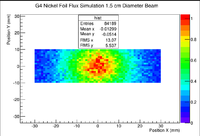
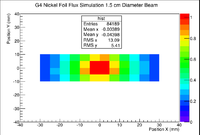
Below is a more finely binned histogram so a better flux profile can be seen:
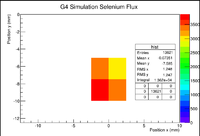
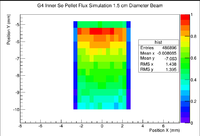
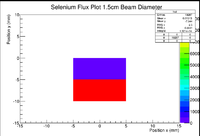
For a 1.5cm diameter beam I was able to find a place on the nickel foil that had half as much flux as the selenium. Below is a plot of the selenium flux with both fine bins and coarse bins
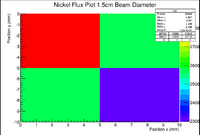
It can be seen that this is a 10mmx10mm square. So find a 10mmx10mm square on the nickel foil that has half as much flux as seen by the selenium. Below is a plot of that region.
Note that this position on the nickel foil is still at the bottom of the Aluminum cylinder, similar to where the selenium would actually be due to the fact that there was not much ash in the cylinder to raise its position in y. It would seem that if the selenium pellet were centered off the x axis by 5mm, then it would be feasible that the flux through the selenium pellet would be half.
The ratio of the number of photons through the selenium and the number of photons through the small area of the nickel is
We can also simply look at the nickel foil flux and find a region where the flux would be half as much. Below is a plot of the nickel foil
From here we can see that the flux is half from the center at the bottom of the foil and from 10-15mm in the x position
