Difference between revisions of "JB Absolute theta"
Jump to navigation
Jump to search
| (54 intermediate revisions by the same user not shown) | |||
| Line 1: | Line 1: | ||
[[Production Analysis|go_back]] | [[Production Analysis|go_back]] | ||
| − | + | [[JB Absolute theta(oldmethod)]] | |
| − | [[ | ||
| − | = | + | =Analysis= |
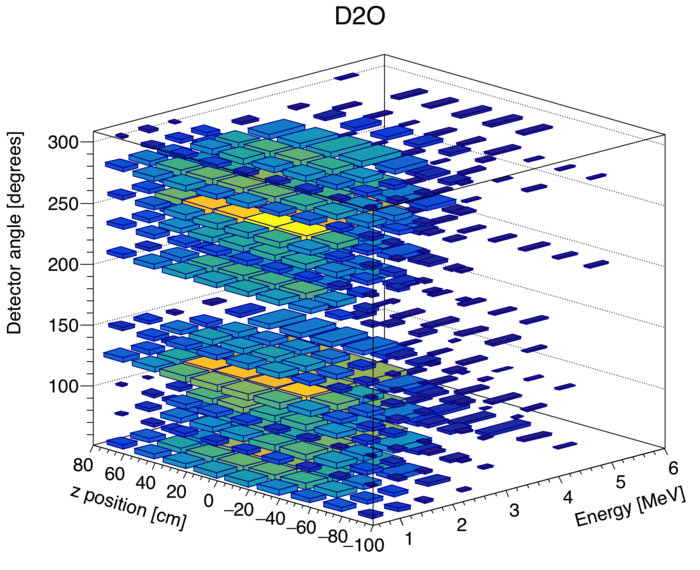
| − | + | After my first attempt at reconstructing the theta_abs distribution gave mediocre results, I decided to try again, but this time without integrating over experimental observables throught analysis, except for at the final step. To illustrate what I mean, see the histogram below: | |
| − | [[File: | + | [[File:D2O3DHistogram.png|700px|thumb|center|alt=Large | Every singles event lies in a three dimensional space consisting of a PMT top and bottom time, and a specific detector. These observables can be recast as energy, vertical z position, and detector angle (54,78,102, ect). ]] |
| − | + | The benefit of conducting the analysis in this 3D space, is that the neutrons correlated with the beam can be normalized to uncorrelated Cf252 neutrons detected in the same detector with similar positions and energies. | |
| − | |||
| − | |||
Latest revision as of 21:28, 22 November 2017
Analysis
After my first attempt at reconstructing the theta_abs distribution gave mediocre results, I decided to try again, but this time without integrating over experimental observables throught analysis, except for at the final step. To illustrate what I mean, see the histogram below:
The benefit of conducting the analysis in this 3D space, is that the neutrons correlated with the beam can be normalized to uncorrelated Cf252 neutrons detected in the same detector with similar positions and energies.
