Difference between revisions of "Investigation of Centroid Shift in Vz Differences"
| (16 intermediate revisions by 2 users not shown) | |||
| Line 1: | Line 1: | ||
| + | =Z at origin 0= | ||
| + | |||
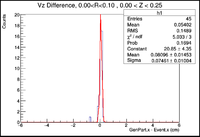
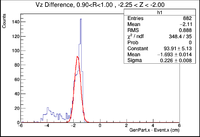
In this section I will investigate the behavior of the central peak on the GenPart.z - Event.z histograms for different annular regions along an extended cylindrical target. While sifting through histograms that had been made, I noticed that there was a shift in the mean value as Z extends away from zero. Below is an example. | In this section I will investigate the behavior of the central peak on the GenPart.z - Event.z histograms for different annular regions along an extended cylindrical target. While sifting through histograms that had been made, I noticed that there was a shift in the mean value as Z extends away from zero. Below is an example. | ||
| Line 16: | Line 18: | ||
The first region is the black curve, then regions 2-5 are found by rotating clockwise around the histogram with region 5 being magenta (macro problems renaming stat boxes, will be fixed). | The first region is the black curve, then regions 2-5 are found by rotating clockwise around the histogram with region 5 being magenta (macro problems renaming stat boxes, will be fixed). | ||
| + | |||
| + | = z between 0 and 1 cm = | ||
| + | = Z gt 1cm = | ||
To investigate further, an xm grace plot will be made of the positive and negative halves of the target to see if there is some sort of trend. | To investigate further, an xm grace plot will be made of the positive and negative halves of the target to see if there is some sort of trend. | ||
| Line 21: | Line 26: | ||
Here is a sample root command line: clas12->Draw("GenPart.z-Event.z >> R1(1000,-5,5)","sqrt(GenPart.x*GenPart.x+GenPart.y*GenPart.y)<0.2 && GenPart.z > 0.0 && GenPart.z < 0.5"); | Here is a sample root command line: clas12->Draw("GenPart.z-Event.z >> R1(1000,-5,5)","sqrt(GenPart.x*GenPart.x+GenPart.y*GenPart.y)<0.2 && GenPart.z > 0.0 && GenPart.z < 0.5"); | ||
| − | I removed the abs(GenPart.x - Event.x)<1 and abs(GenPart.y-Event.y)<1 to have more events in the histograms. | + | I removed the abs(GenPart.x - Event.x)<1 and abs(GenPart.y-Event.y)<1 to have more events in the histograms. Also note that each of these averages were made using a modified fit (slider bar in the FitPanel) to ensure that only the largest peak was involved in the gaussian fit. |
| + | |||
| + | ==Below is a table of the resolutions for Z>0.== | ||
| + | |||
| + | {| border="3" cellpadding="5" cellspacing="0" | ||
| + | |- | ||
| + | || Region in Z || Mean for 0.0cm<R<0.25cm (cm) (Region 1) || Mean for 0.25cm<R<0.5cm (cm) (Region 2) || Mean for 0.5cm<R<0.75cm (cm) (Region 3) || Mean for 0.75cm<R<1.0cm (cm) (Region 4) || Average and Standard Deviation (cm) | ||
| + | |- | ||
| + | || 0.0cm<Z<0.5cm (Region 1) || 0.1808 +/- 0.0141 || 0.1314 +/- 0.0099 || 0.06971 +/- 0.00904 || 0.03146 +/- 0.00860 || 0.1033 +/- 0.066 | ||
| + | |- | ||
| + | || 0.5cm<Z<1.0cm (Region 2) || 0.5591 +/- 0.0149 || 0.5347 +/- 0.0099 || 0.3689 +/- 0.0112 || 0.3256 +/- 0.0092 || 0.4473 +/- 0.1168 | ||
| + | |- | ||
| + | ||1.0cm<Z<1.5cm (Region 3) || 1.016 +/- 0.017 || 0.98 +/- 0.01 || 0.91 +/- 0.01 || 0.8435 +/- 0.0068|| 0.9374 +/- 0.0765 | ||
| + | |- | ||
| + | ||1.5cm<Z<2.0cm (Region 4) || 1.433 +/- 0.012 || 1.427 +/- 0.007 || 1.346 +/- 0.007 || 1.273 +/- 0.007 || 1.3698 +/- 0.0757 | ||
| + | |- | ||
| + | ||2.0cm<Z<2.5cm (Region 5) || 1.859 +/- 0.014 || 1.83 +/- 0.01 || 1.793 +/- 0.007 || 1.698 +/- 0.007 || 1.795 +/- 0.0700 | ||
| + | |- | ||
| + | ||2.5cm<Z<3.0cm || 2.249 +/- 0.012 || 2.247 +/-0.006 || 2.221 +/- 0.007 || 2.143 +/- 0.007 || 2.215 +/- 0.04967 | ||
| + | |} | ||
| + | |||
| + | [[File:Region vs Centroid Z-0.png|200px]] | ||
| + | [[File:Average Centroid vs ZRegion.png|200px]] | ||
| + | |||
| + | ==Here is the information for Z<0cm== | ||
| + | |||
| − | |||
{| border="3" cellpadding="5" cellspacing="0" | {| border="3" cellpadding="5" cellspacing="0" | ||
|- | |- | ||
| − | || Region in Z || Mean for 0.0cm<R<0.25cm (cm) || Mean for 0.25cm<R<0.5cm (cm) || Mean for 0.5cm<R<0.75cm (cm) || Mean for 0.75cm<R<1.0cm (cm) | + | || Region in Z || Mean for 0.0cm<R<0.25cm (cm) (Region 1) || Mean for 0.25cm<R<0.5cm (cm) (Region 2) || Mean for 0.5cm<R<0.75cm (cm) (Region 3) || Mean for 0.75cm<R<1.0cm (cm) (Region 4) || Average and Standard Deviation (cm) |
|- | |- | ||
| − | || 0. | + | ||-0.5cm<Z<0.0cm (Region 1) || -0.2114 +/- 0.0205 || -0.2197 +/- 0.0092 || -0.2152 +/- 0.0088 || -0.1966 +/- 0.0088 ||-0.2107 +/-0.010 |
|- | |- | ||
| − | || 0 | + | || -1.0<Z<-0.5cm (Region 2) || -0.6454 +/- 0.0114 || -0.6162 +/- 0.0082 || -0.5677 +/- 0.0081 || -0.4978 +/- 0.0079 || -0.5815 +/- 0.06458 |
|- | |- | ||
| − | ||1. | + | ||-1.5cm<Z<-1cm (Region 3) || -1.073 +/- 0.017 || -1.047 +/- 0.008 || -0.9566 +/- 0.0080 || -0.9245 +/- 0.0087 || -1.000 +/- 0.0710 |
|- | |- | ||
| − | || | + | ||-2.0cm<Z<-1.5cm (Region 4) || -1.488 +/- 0.010 || -1.447 +/- 0.007 || -1.395 +/- 0.007 || -1.348 +/- 0.008 || -1.4195 +/- 0.0610 |
|- | |- | ||
| − | ||2. | + | ||-2.5cm<Z<-2.0cm (Region 5) || -1.876 +/- 0.011 || -1.857 +/- 0.007 || -1.846 +/- 0.008 || -1.774 +/- 0.007 || -1.8382 +/- 0.0446 |
|- | |- | ||
| − | || | + | ||-3.0cm<Z<-2.5cm (Region 6) || -2.277 +/- 0.012 || -2.271 +/- 0.006 || -2.267 +/- 0.008 || -2.212 +/- 0.008 || -2.2568 +/- 0.0301 |
|} | |} | ||
| + | [[File:AnnularRegion vs mean Z-0.png|200px]] | ||
| + | [[File:Avg mean vs ZRegion Z-0.png|200px]] | ||
Latest revision as of 18:38, 14 November 2016
Z at origin 0
In this section I will investigate the behavior of the central peak on the GenPart.z - Event.z histograms for different annular regions along an extended cylindrical target. While sifting through histograms that had been made, I noticed that there was a shift in the mean value as Z extends away from zero. Below is an example.
Here it can be seen that near zero, the mean value is 0.08 cm, while in the histogram that places the cut further away from zero has a mean value of -1.693 cm. I will make histograms from a ROOT file generated by reconstructing a GEMC 2.5 evio file using Coat-Java 2.4.
Here is the command line for GEMC: ~/src/CLAS/GEMC/experiments/eg12/LB_Vertex/XYZRaster/Solenoid_On/Centroid_Investigation> ~/src/CLAS/GEMC/2.0/Linux__Ubuntu16.04-x86_64-gcc5.4.0/gemc/2.5/gemc -USE_GUI=0 -INPUT_GEN_FILE="LUND,E_6GeV_25Theta_90Phi_1cmXYRaster_6cmZTarg_75k.LUND" -N=75000 eg12_sol_1XYRaster_6cmZtarg.gcard
Here is the command line for CoatJava 2.4: ~/src/CLAS/coatjava-2.4/bin/clas12-reconstruction -config GEOM::new=true -s DCHB:DCTB:EC:FTOF:EB -config DATA::mc=true -config DCTB::useRaster=true -i eg12_sol_75k_1cmXYRaster_6cmZTarg_90Phi_25Theta_GEMC_2.5_11_09_16.ev -o eg12_sol_75k_1cmXYRaster_6cmZTarg_90Phi_25Theta_GEMC_2.5_11_09_16_rec.evio
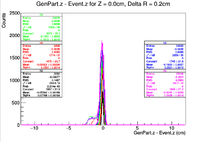
Below is a sample histogram generated using the macro VzDiffDoubleBump.C in /home/lds/src/CLAS/GEMC/experiments/eg12/LB_Vertex/XYRaster/Solenoid_On/30DegRot/LB_DiskTarg on lds3.
The first region is the black curve, then regions 2-5 are found by rotating clockwise around the histogram with region 5 being magenta (macro problems renaming stat boxes, will be fixed).
z between 0 and 1 cm
Z gt 1cm
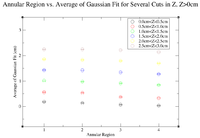
To investigate further, an xm grace plot will be made of the positive and negative halves of the target to see if there is some sort of trend.
Here is a sample root command line: clas12->Draw("GenPart.z-Event.z >> R1(1000,-5,5)","sqrt(GenPart.x*GenPart.x+GenPart.y*GenPart.y)<0.2 && GenPart.z > 0.0 && GenPart.z < 0.5");
I removed the abs(GenPart.x - Event.x)<1 and abs(GenPart.y-Event.y)<1 to have more events in the histograms. Also note that each of these averages were made using a modified fit (slider bar in the FitPanel) to ensure that only the largest peak was involved in the gaussian fit.
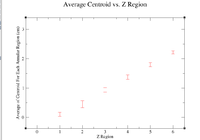
Below is a table of the resolutions for Z>0.
| Region in Z | Mean for 0.0cm<R<0.25cm (cm) (Region 1) | Mean for 0.25cm<R<0.5cm (cm) (Region 2) | Mean for 0.5cm<R<0.75cm (cm) (Region 3) | Mean for 0.75cm<R<1.0cm (cm) (Region 4) | Average and Standard Deviation (cm) |
| 0.0cm<Z<0.5cm (Region 1) | 0.1808 +/- 0.0141 | 0.1314 +/- 0.0099 | 0.06971 +/- 0.00904 | 0.03146 +/- 0.00860 | 0.1033 +/- 0.066 |
| 0.5cm<Z<1.0cm (Region 2) | 0.5591 +/- 0.0149 | 0.5347 +/- 0.0099 | 0.3689 +/- 0.0112 | 0.3256 +/- 0.0092 | 0.4473 +/- 0.1168 |
| 1.0cm<Z<1.5cm (Region 3) | 1.016 +/- 0.017 | 0.98 +/- 0.01 | 0.91 +/- 0.01 | 0.8435 +/- 0.0068 | 0.9374 +/- 0.0765 |
| 1.5cm<Z<2.0cm (Region 4) | 1.433 +/- 0.012 | 1.427 +/- 0.007 | 1.346 +/- 0.007 | 1.273 +/- 0.007 | 1.3698 +/- 0.0757 |
| 2.0cm<Z<2.5cm (Region 5) | 1.859 +/- 0.014 | 1.83 +/- 0.01 | 1.793 +/- 0.007 | 1.698 +/- 0.007 | 1.795 +/- 0.0700 |
| 2.5cm<Z<3.0cm | 2.249 +/- 0.012 | 2.247 +/-0.006 | 2.221 +/- 0.007 | 2.143 +/- 0.007 | 2.215 +/- 0.04967 |
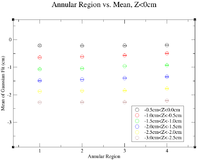
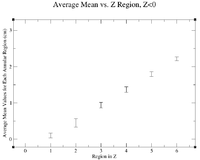
Here is the information for Z<0cm
| Region in Z | Mean for 0.0cm<R<0.25cm (cm) (Region 1) | Mean for 0.25cm<R<0.5cm (cm) (Region 2) | Mean for 0.5cm<R<0.75cm (cm) (Region 3) | Mean for 0.75cm<R<1.0cm (cm) (Region 4) | Average and Standard Deviation (cm) |
| -0.5cm<Z<0.0cm (Region 1) | -0.2114 +/- 0.0205 | -0.2197 +/- 0.0092 | -0.2152 +/- 0.0088 | -0.1966 +/- 0.0088 | -0.2107 +/-0.010 |
| -1.0<Z<-0.5cm (Region 2) | -0.6454 +/- 0.0114 | -0.6162 +/- 0.0082 | -0.5677 +/- 0.0081 | -0.4978 +/- 0.0079 | -0.5815 +/- 0.06458 |
| -1.5cm<Z<-1cm (Region 3) | -1.073 +/- 0.017 | -1.047 +/- 0.008 | -0.9566 +/- 0.0080 | -0.9245 +/- 0.0087 | -1.000 +/- 0.0710 |
| -2.0cm<Z<-1.5cm (Region 4) | -1.488 +/- 0.010 | -1.447 +/- 0.007 | -1.395 +/- 0.007 | -1.348 +/- 0.008 | -1.4195 +/- 0.0610 |
| -2.5cm<Z<-2.0cm (Region 5) | -1.876 +/- 0.011 | -1.857 +/- 0.007 | -1.846 +/- 0.008 | -1.774 +/- 0.007 | -1.8382 +/- 0.0446 |
| -3.0cm<Z<-2.5cm (Region 6) | -2.277 +/- 0.012 | -2.271 +/- 0.006 | -2.267 +/- 0.008 | -2.212 +/- 0.008 | -2.2568 +/- 0.0301 |
